Evaluation of Risk Assessment Tools for Indigenous Individuals with a History of Sexual Crimes: A Response to Ewert case (2018)
By Seung C. Lee, R. Karl Hanson, and Julie Blais
Table of contents
Abstract
In Canada, the issue of cultural bias in risk assessment tools is an ongoing concern, particularly for Indigenous peoples who are overrepresented in the criminal justice system. To date, there has been relatively little research on the validity of structured risk assessment tools for Indigenous peoples. This study examined the predictive accuracy (discrimination and calibration) of two risk assessment tools (the Static-99R and Static-2002R) used with White individuals (n = 1,560) and persons of Indigenous heritage (n = 653) who have a history of sexual crimes from five independent Canadian samples. The results indicated that the Static-99R predicted sexual recidivism with similar accuracy for Indigenous peoples and White individuals. The Static-2002R predicted sexual recidivism only for White individuals. The domains of persistence/paraphilia and youthful stranger aggression were not as predictive for Indigenous individuals as for White individuals; however, the general criminality domain predicted sexual recidivism for both Indigenous and White peoples. Furthermore, results suggested that White individuals had more indicators of paraphilic interests whereas Indigenous peoples displayed higher indicators of general criminality. The findings suggest that the treatment for individuals at risk for sexual offending may benefit from an increased focus on distinctive risk-relevant characteristics of White individuals and Indigenous peoples in the criminal justice system.
Keywords: sexual offending, Indigenous peoples, Static-99R, Static-2002R
Author's note
The opinions, findings, conclusions, and recommendations expressed are those of the authors and do not necessarily reflect those of the institutions that supported this research. Correspondence concerning this article should be addressed to:
Seung C. Lee
Department of Psychology, Carleton University
1125 Colonel By Drive
Ottawa, Ontario K1S 5B6
Email: seungc.lee@carleton.ca
Declaration of Conflicting Interests
R. Karl Hanson is a co-author and certified Static-99R and Static-2002R trainer. The copyright for Static-99R and Static-2002R is held by the Government of Canada, and none of the authors receives royalties from this measure.
Funding
The author(s) received no financial support for the research, authorship, and publication of this article.
Acknowledgments
The authors would like to thank Patti McDonald and Leticia Gutierrez for their helpful feedback on an early version of this article. We would also like to thank the following researchers for permitting us to use their data: Jim Bonta, Andy Haag, and Mark Olver.
Introduction
The purpose of the Canadian correctional system is to administer sentences, promote public safety, and assist in the rehabilitation of offenders (Corrections Act, 1988; Corrections and Conditional Release Act, 1992/2012; Ministry of Correctional Services Act, 1990). Forensic risk assessment has become a ubiquitous practice in achieving these goals, from determining whether offenders should be incarcerated in higher security settings (e.g., Dangerous Offender hearings; ss. 752 and 753 of the Criminal Code of Canada) to deciding who should be released on parole. According to the Risk principle of the widely accepted Risk, Need, and Responsivity model of offender rehabilitation (RNR), treatment programs are most likely to be effective when the most intensive services are provided to the highest risk offenders (Andrews, Bonta, & Wormith, 2006; Andrews & Bonta, 2010; Gendreau, Smith, & French, 2006). Consequently, accurate assessments of recidivism risk are a prerequisite for effective offender rehabilitation.
An ongoing concern of the assessment of recidivism risk is the extent to which measures, developed and validated using predominantly White samples, can be applied to other ethnic and racialized minority groups (i.e., cultural bias). In Canada, the issue of cultural bias has mostly concerned individuals of Indigenous heritage, who are overrepresented at all stages of the criminal justice system (Haag, Boyes, Cheng, MacNeil, & Wirove, 2016). This issue has received renewed attention with the Ewert v. Canada (2015, 2018) case where the Supreme Court of Canada ruled that several well-known risk assessment scales (e.g., Static-99; Hanson & Thornton, 2000; Psychopathy Checklist-Revised [PCL-R], Hare, 2003) had insufficient evidence on cross-cultural validity to justify their use with Indigenous peoples with a history of crime.Note1
Given this context, the purpose of this study was twofold: 1) examine the potential for cultural bias in the predictive validity of two widely adopted scales for individuals with a history of sexual crimes (i.e., Static-99R [Hanson & Thornton, 2000; Helmus, Thornton, Hanson, & Babchishin, 2012] and Static-2002R [Hanson & Thornton, 2003; Helmus, Thornton, et al., 2012]), one of which was specifically named in the Ewert case; and 2) assess the presence and predictive validity of the psychological constructs that underlie these scales. This study represents the largest and most up-to-date evaluation of both the Static-99R and Static-2002R with individuals of Indigenous heritage. It is also the only study of these measures to examine both discrimination (i.e., relative risk) and calibration (i.e., absolute risk) as indicators of predictive validity.
Indigenous Overrepresentation in Canadian Corrections
Despite accounting for approximately 4% of the total Canadian adult population (Statistics Canada, 2015), Indigenous peoples (First Nations, Métis, and Inuit) account for more than 20% of the total offender population (i.e., in custody and in community under supervision; Public Safety Canada, 2018) and 23% (444/ 1,898) of individuals serving a federal sentence for a sexual offence (MacDonald, 2014). Furthermore, Indigenous peoples in the criminal justice system are more likely to be placed in higher security prisons (Public Safety Canada, 2018), less likely to be granted statutory release (i.e., released after 2/3 of their sentence; Public Safety Canada, 2018), and more likely to have their parole revoked (Office of the Correctional Investigator, 2018).
There are several proposed reasons for the overrepresentation of Indigenous peoples in Canadian corrections. First, research has consistently found that Indigenous peoples are more likely to be arrested and convicted than non-Indigenous peoples (e.g., Bonta, Laprairie, & Wallace-Capretta, 1997; Quann & Trevethan, 2000) and have significantly higher recidivism rates (Gutierrez, Wilson, Rugge, & Bonta, 2013; Rojas & Gretton, 2007; Sioui & Thibault, 2002). An important finding for the current study is that Indigenous individuals in the criminal justice system score higher on the majority of established risk factors for general and violent recidivism than non-Indigenous individuals (i.e., Central Eight risk/needs factors; Andrews & Bonta, 2010). For example, Indigenous individuals in the criminal justice system have lengthier criminal histories (e.g., Holsinger, Lowenkamp, & Latessa, 2006; Perley-Robertson, Helmus, & Forth, 2018; Shepherd, Adams, McEntyre, & Walker, 2014), higher rates of substance abuse (e.g., Ellerby & MacPherson, 2002; Shepherd et al., 2014), more problems with family/marital relationships (e.g., Shepherd et al., 2014; Trevethan, Moore, & Rastin, 2002), and less education/employment (Holsinger, Lowenkamp, & Latessa, 2003; Shepherd et al., 2014; Trevethan et al., 2002) than non-Indigenous individuals in the criminal justice system.
The presence of these risk factors is not surprising when we consider that, in comparison to non-Indigenous peoples, Indigenous peoples have lower median incomes ($25,526 vs. $34,604), lower employment rates (52% vs. 60.5%), lower education levels (62% with a high school diploma vs. 80%; Statistics Canada, 2018), and poorer health outcomes (e.g., mental health issues and short life expectancy; Statistics Canada, 2005; Statistics Canada, 2015). It is also well documented that Indigenous peoples report higher rates of childhood maltreatment (neglect and sexual/physical abuse) and intimate partner violence (Boyce, 2016; Scrim, 2010; Sinha et al., 2011). They are also more likely than non-Indigenous peoples to be victimized according to official crime statistics (Boyce, 2016; Scrim, 2010; Sinha et al., 2011).
These indicators of adversity and social disadvantage need to be understood in the context of Canada's history of colonization and the devastating effects of racist social policies towards Indigenous peoples (Truth and Reconciliation Commission of Canada, 2015). As the Royal Commission on Aboriginal Peoples (RCAP) makes clear, many of the most pressing problems in Indigenous communities are predictable consequences of the efforts of the dominant social class to eliminate Indigenous cultures (i.e., residential schools, the Indian Act, and enfranchisement, wherein the Canadian government would strip Status Indians of their status if they obtained a university degree, served in the armed forces, or if a Status Indian woman married a non-Indigenous or non-status person). Whether it is poverty, substance abuse, low levels of formal education, or alienation and isolation, the criminogenic factors that contribute to higher rates of crime among Indigenous peoples in Canada are rooted in some 500 years of Indigenous-settler relations. To quote the RCAP (1996):
People who endure these disruptions may feel adrift - disoriented and unsure of how to get along in the sometimes hostile non-Aboriginal world. If their aboriginality has been devalued or ridiculed, they may have lost pride and self-esteem and be unable to build these qualities in their children. If they have been damaged in heart and soul, they may turn to alcohol, violence, crime or other forms of anti-social behavior (p.36).
The creation of the reserve system has further marginalized Indigenous communities and fostered environments conducive to crime for the following reasons:
- the reserve system creates large groups of disadvantaged people with limited resources;
- these communities tend to exist separate from mainstream society creating the potential for culture clash (e.g., differing views of crime and justice); and
- individuals in this environment are more likely to experience early and sustained abuse (Laprairie, 1996).
Although such conditions do not describe all First Nation Communities, there was no question that the reserve system placed non-Indigenous peoples in control of most of Canada's natural resources – natural resources for which Indigenous people continue to be dependent upon.
Another factor that may lead to Indigenous overrepresentation is the effect of systemic discrimination and bias in how Indigenous individuals are treated at all levels of the criminal justice system (R v. Gladue; Rudin, 2009; Truth and Reconciliation Commission of Canada, 2015). For example, there is evidence of differential treatment of Indigenous peoples in policing (i.e., higher likelihood of arrest), sentencing (i.e., longer sentences), and rehabilitation (i.e., reduced access to culturally appropriate programming; LaPrairie, 2002; Mann, 2009; Rudin, 2009). Underlying this discrimination is the false assumption that Indigenous individuals, just because of their race, are more likely to commit a crime (i.e., higher risk) than non-Indigenous individuals.
Risk Assessment and Cultural Bias
Considerable research has demonstrated that structured approaches to risk assessment, particularly those based on statistical methods (i.e., actuarial), provide a more accurate estimate for the likelihood of recidivism than unstructured judgments (Ægisdóttir et al., 2006; Grove, Zald, Lebow, Snitz, & Nelson, 2000; Hanson & Morton-Bourgon, 2009). Risk assessment scales are criterion-referenced measures because the main goal is to assess the likelihood of a specific outcome in the future. Unlike norm-referenced scales, where the goal is the assessment of a specific construct, predictive validity becomes the most important metric for evaluating the efficacy of criterion-referenced measures (Gutierrez, Helmus, & Hanson, 2016). A comprehensive understanding of predictive validity considers both discrimination (how likely offenders with a higher score are to reoffend than offenders with a lower score) and calibration(how well the estimated recidivism probability from the instrument's norms corresponds with the observed recidivism probability of a new sample).
The Canadian Code of Ethics for Psychologists (Canadian Psychological Association, 2017) states that psychologists need to ensure that assessment methods are appropriate to the particular cultural and social contexts of the individuals being assessed (p. 20). Nevertheless, relatively little research has examined the cultural bias in structured risk assessment instruments. Cultural bias in risk assessment occurs when either discrimination or calibration is systematically different across ethnic groups (Reynolds & Suzuki, 2013). There are several possible causes for the cultural bias in the performance of risk assessment instruments. When looking at cultural bias within the instrument itself, we can refer to both item bias and construct bias (Geisinger & McCormick, 2013; see Haag et al. [2016] for a more thorough review). Item cultural bias refers to differential responses based solely on the cultural interpretation of the content of the item itself (e.g., the term "unrelated victim" could mean something different to someone from a more collectivistic culture). Construct cultural bias occurs when the constructs measured by the scale do not equally apply to individuals with different cultural backgrounds (Geisinger & McCormick, 2013). This could be an indication that the items meant to measure a specific construct are different for different ethnic groups, or that constructs may only partially apply to members of different groups (Byrne et al., 2009).
Until recently, relatively little research attention had been devoted to the validity of structured risk assessment instruments for individuals of Indigenous heritage. This, of course, changed with the Ewert case. Mr. Ewert, a Métis, serving two concurrent life sentences for sexually motivated homicide and assault, challenged the use of psychological and actuarial risk assessment instruments (e.g., Static-99) by the Correctional Service of Canada (CSC). The claim was that Mr. Ewert's rights under s. 24(1) of the Corrections and Conditional Release Act (i.e., the use of accurate and up to date information) and ss. 7 (i.e., right to life, liberty, and security of the person) and 15 (i.e., equality before and under the law) of the Canadian Charter of Rights and Freedoms were violated given that the instruments were not adequately validated for use with Indigenous peoples (Ewert v. Canada, 2015).
The original complaint resulted in a victory for Mr. Ewert; however, this decision was overturned on appeal. The case, therefore, proceeded to the Supreme Court of Canada (SCC) where it was determined that, although Mr. Ewert's Charter rights were not infringed upon, the court made a declaration that CSC had failed in its duties under s. 24(1). More specifically:
The CSC had long been aware of concerns regarding these tools exhibiting cultural bias yet took no action to confirm their validity and continued to use them in respect of Indigenous offenders, despite the fact that research would have been feasible. In doing so, the CSC did not meet the legislated standard set out in s. 24(1)(Ewert v. Canada. 2018; pp.7-8).
In addition to the Ewert case, longstanding concerns about Indigenous over-representation has motivated repeated calls for more and better research (e.g., Mann, 2009; Office of the Auditor General of Canada, 2016).
Risk Assessment with Indigenous Individuals with a History of Sexual Crimes
Structured risk assessment instruments consist of empirically identified risk factors associated with the recidivism outcomes (e.g., violent or sexual recidivism). There are two broad categories of risk factors: static (unchangeable) and dynamic (changeable) risk factors. In the criminal justice system, risk assessment instruments are widely used to estimate the likelihood of recidivism risk (i.e., prediction; static and/or dynamic risk factors) and to guide the effective intervention strategies (i.e., risk reduction; dynamic risk factors; Heilbrun, 1997; Neal & Grisso, 2014).
Within the last few decades, important risk factors associated with sexual recidivism have been identified based on samples of predominantly White people. These risk factors can be organized into two broad categories: indicators of general antisociality (e.g., impulsiveness, supervision failures, criminal history) and sex crime specific indicators (e.g., sexual preoccupation, emotional congruence with children; Hanson & Bussière, 1998; Hanson & Morton-Bourgon, 2005; Mann, Hanson, & Thornton, 2010; Whitaker et al., 2008). When examining the risk profile of Indigenous individuals with a history of sexual crime, they tend to score significantly higher on general antisociality while scoring lower on sexual deviancy compared to non-Indigenous individuals (Babchishin, Blais, et al., 2012; Ellerby & MacPherson, 2002; Helmus, Babchishin, Blais, 2012). They also tend to be younger and have higher sexual, violent, and general recidivism rates (e.g., Babchishin, Blais et al., 2012; Rastin & Johnson, 2002; Rojas & Gretton, 2007).
Few studies have examined the predictive validity of risk assessment scales with Indigenous peoples with a history of sexual offending. Olver and his colleagues (2018) demonstrated that the Violence Risk Scale - Sex Offender version (VRS-SO; Wong, Olver, Nicholaichuk, & Gordon, 2003) significantly predicted sexual recidivism for both Indigenous and non-Indigenous individuals with a history of sexual crimes. They further demonstrated that treatment change was significantly related to reductions in risk for both groups. In contrast, Helmus, Babchishin, et al. (2012) found that the STABLE-2007, another dynamic scale, did not predict sexual recidivism for Indigenous individuals with a history of sexual crimes. Their results were mostly attributed to the poor performance of the general criminality items; sexual deviancy items performed equally well for Indigenous and non-Indigenous individuals.
Static-99R and Static-2002R are the most commonly used actuarial risk tools for adult males with a history of sexual crimes in Canada (Bourgon, Mugford, Hanson, & Coligado, 2018) and the U.S. (Kelley, Ambroziak, Thornton & Barahal, 2018). The Static-99R contains 10 static (i.e., unchangeable) items (e.g., prior sex offences) and the total score (-3 to 12) is used to estimate the likelihood of sexual offending. The Static-2002R was developed to improve the conceptual coherence of the Static-99R scale and, thus, to measure psychological constructs (e.g., deviant sexual interests, general criminality). Static-2002R also contains only static items (8 of 14 items from Static-99R), and the total score (-2 to 13) is used to estimate the likelihood of sexual offending. Also, the Static-2002R items are categorized into five conceptually meaningful constructs (see Hanson & Thornton, 2003).
A recent study found that considering the items from both Static-99R and Static-2002R improves the assessment of the psychologically meaningful constructs associated with sexual recidivism (Brouillette-Alarie, Babchishin, Hanson, & Helmus, 2016). The three major propensities are the following: 1) persistence/paraphilia (e.g., rate of sexual offending, male victim); 2) youthful stranger aggression (e.g., age at release, non-sexual violence at index, unrelated victim); and 3) general criminality (e.g., breach of conditional release; prior nonsexual violence; Brouillette-Alarie et al., 2016). The first construct, persistence/paraphilia, is associated with deviant sexual interests, but without the intent to harm their victims (e.g., pedophilia, voyeurism, and exhibitionism). The second construct, youthful stranger aggression, is related to the intent to sexually harm the victim (e.g., sexual sadism, hostility towards women). The construct of general criminality is related to the antisocial traits (e.g., impulsivity, lack of remorse, rule violations; Brouillette-Alarie, Proulx, & Hanson, 2017).
Furthermore, the Static-99R and Static-2002R recently adopted the standardized risk category system (i.e., Level I, II, III, IVa, and IVb; Hanson, Babchishin, Helmus, Thornton, & Phenix, 2016). Each category demonstrates quantitative information (e.g., likelihood of sexual reoffending, percentile ranks) as well as psychological characteristics associated with each level (e.g., sexual deviance and general antisociality). Consequently, the standardized risk levels assist evaluators to arrive at the same inferences for individuals assigned to the same risk category, regardless of the risk tool used.
There is only one study to examine the predictive validity (discrimination) of the Static-99R and Static-2002R for Indigenous peoples in Canada. Babchishin and colleagues (2012) examined the predictive validity of both scales among 1,588 individuals with a history of sexual crime (Indigenous, n = 319; non-Indigenous, n = 1,269). Overall, there was moderate discrimination between recidivists and non-recidivists for both groups for the Static-99/R (sexual recidivism; AUCs of .71 for Indigenous individuals and .74 for non-Indigenous individuals). The Static-2002R, however, was significantly less predictive of sexual recidivism for Indigenous individuals compared to non-Indigenous individuals. Total Static-2002R scores did not significantly predict sexual recidivism for Indigenous individuals with a history of sexual crime (AUC of .61 vs. AUC of .76 for non-Indigenous individuals). This study did not evaluate the calibration of either Static-99/R or Static-2002R.
Current Study
The Ewert decision (2018) highlighted the lack of research examining cultural bias in several widely adopted risk assessment scales in Canadian corrections - including the Static-99R. The purpose of this study was to provide an updated examination of the predictive validity of both the Static-99R and Static-2002R for Indigenous men and White men with a history of sexual crimes. The development and validation samples of Static-99R and Static-2002R comprised predominantly White individuals. White individuals - a dominant and privileged group - might have distinctive features associated with criminal behaviour, features that differ from the factors motivating criminal behaviour among Indigenous peoples.
There are other ethnic groups in Canada with potentially distinctive features (e.g., South Asians, East Asians, Caribbean Blacks). Of these groups, this study focused on Indigenous peoples because of their overrepresentation at all stages of the criminal justice system, and the concern that risk assessment practices could be contributing to this problem. Given legal and public policy concerns, this study also focused on the ability of these risk tools to identify individuals at high risk for sexual recidivism. Finally, this is the first study to assess both discrimination and calibration when evaluating the predictive accuracy of these specific tools.
Based on existing research, we expected Indigenous individuals to score higher on the total scores for both the Static-99R and Static-2002R, largely due to elevated scores on the items indicative of general antisociality. We also expected Indigenous peoples to score lower than White individuals on items related to sexual deviancy. Regarding predictive validity, we expected the Static-99R to show moderate discrimination for Indigenous individuals, but that discrimination would be lower than that observed for White individuals. Given the similarity between the Static-99R and Static-2002R, we expected similar results for both risk tools. Although previous studies with Indigenous peoples found that the Static-2002R was less accurate than the Static-99R, this finding lacks theoretical explanation and may be a sampling anomaly that could disappear with future research. No hypotheses regarding the calibration analyses were made for either instrument because no previous studies examined calibration of either tool for Indigenous peoples.
The second goal of this study was to examine the presence and predictive validity of risk-relevant characteristics for Indigenous and White peoples with a history of sexual crimes. Although no study to date has applied these specific constructs to Indigenous peoples, we would again expect that Indigenous individuals with a history of sexual crime to score higher on indicators of general criminality and lower on indicators of sexual deviancy than White individuals with a history of sexual crime.
Methods
Sample
The current study included two groups, adult Indigenous men (n = 653) and adult White men (n = 1,560) from five independent Canadian samples (Bonta & Yessine, 2005; Brankley, Lee, Babchishin, Hanson, & Harris, 2017; Haag, 2005; Lee, Mularczyk, Babchishin, Blais, & Bonta, 2018; Olver et al., 2018). The Indigenous study group represented a mixed group of First Nations, Métis, and Inuit individualsNote2 and the White study group referred to the individuals of European descent.
All samples were adult males (18 years or older) who had been convicted of sexual crimes and were classified by an administrative process as having a high level of risk and/or need (e.g., preselected [referred to as National Flagging System], detained until the end of a sentence, or attended high-intensity treatment programs). Although the samples were collected across all Canadian regions, most of the Indigenous group were from the Prairies (see Appendix A). The high proportion of Indigenous samples from the Prairies could be due to the even higher overrepresentation rates of Indigenous peoples in the Prairie provinces compared to other provinces (Department of Justice, 2017). The current samples partially overlap with the samples from Babchishin, Blais, et al. (2012; i.e., Bonta & Yessine [2005] and Haag [2005]).
Bonta & Yessine (2005). The original sample included three subgroups: (1) individuals flagged as potential Dangerous Offenders (considered for indeterminate sentences) by the National Flagging System, (2) individuals designated as Dangerous Offenders, and (3) individuals who committed a violent reoffence after being detained until their Warrant Expiry Date (WED). Only the first group (referred to as National Flagging System) was included in this study because Static-99 scores were only available for this group. These individuals were released into the community between 1992 and 2004 and followed until April 2005. Sexual recidivism was defined as a conviction for a sexual offence (excluding prostitution offences, indecent phone calls, and possession of child pornography) after the release into the community. The sexual recidivism information was obtained from the Canadian Police Information Centre (CPIC).
Haag (2005). The original study sample included all male Canadian federal inmates serving a sentence for a sex offence whose warrant expiry date (WED) was in 1995. For the current study, only individuals detained until WED and released into the community (about 25% of the total sample) were included. Sexual recidivism was defined as a conviction for a further sexual offence within seven years after release, and the sexual recidivism information was obtained from the CPIC.
Olver et al. (2018). This study included adult males who served federal sentences and attended sex crime specific treatment programs (e.g., Clearwater programs, National Sex Offender Program) between 1983 and 2008. Sexual recidivism was defined as any criminal code violation for a sexually motivated offence (including child pornography offences). The recidivism information was obtained from the CPIC.
Brankley et al. (2017). This study was an extended follow-up to the Hanson and Harris (1998/2000) study. Adult males who had served part of their sentences in the community (e.g., probation, parole) were selected from all Canadian federal and provincial correctional systems (except Prince Edward Island). All individuals had been convicted of a sexual offence involving physical contact with the victim(s). Sexual recidivism was defined as any subsequent offences that were considered sexually motivated (including offence, charge, or conviction) and their recidivism information was obtained from official (CPIC) and unofficial sources (news articles).
Lee et al. (2018). The sample used in this study comprised individuals who had a history of sexual crimes taken from the Blais and Bonta (2015) study. Updated recidivism information was obtained resulting in a longer follow-up period than was available in the original study. Participants were adult males categorized into three separate and mutually exclusive groups: 1) Flagged Offenders, 2) Dangerous Offenders, and 3) Long-Term Offenders. File information for all three groups was gathered from the National Flagging System coordinators across Canada. Sexual recidivism was defined as any subsequent offences that were considered sexually motivated (including offence, charge, or conviction) and their recidivism information was obtained from official (CPIC) and unofficial sources (news articles).
In accordance with the Tri-Council Policy Statement 2 (TCPS2, Article 9.17, 2010), experts' reviews and opinions from individuals of Indigenous heritage who were engaged professionally with the issue of Indigenous overrepresentation in Canada's criminal justice system were solicited (Leticia Gutierrez and Patti McDonald). Their contributions help shape the interpretations and narratives of the research findings. This research project received research ethics approval from Carleton University's Research Ethics Boards (CUREB)-B.
Measures
Static-99R (Hanson & Thornton, 2000; Helmus, Thornton, et al., 2012). Static-99R is a 10-item empirical actuarial risk tool designed to assess the risk of sexual recidivism among adult males with a history of sexual offending. The Static-99R is identical to the Static-99 except that it contains revised age weights. The total score (ranging from -3 to 12) is calculated by summing all items and can be used to place individuals in one of five risk categories: Level I - very low risk (scores of -3 to -2), Level II - below average risk (scores of -1 to 0), Level III - average risk (scores of 1 to 3), Level IVa - above average risk (scores of 4 to 5), and Level IVb - well above average risk (scores of 6 or higher; Hanson et al., 2017). When necessary, Static-99R scores were computed from Static-99 scores by using the individual's date of birth to calculate the updated age item.
Static-2002R (Hanson & Thornton, 2003; Helmus, Thornton, et al., 2012). The Static-2002R is also an empirical actuarial risk assessment tool for an adult male with a history of sexual offending. The scale has 14 items grouped into five main subscales: Age at Release (1 item), Persistence of Sex Offending (3 items), Sexual Deviance (3 items), Relationship to Victims (2 items), and General Criminality (5 items). The Static-2002R items are identical to the original Static-2002 except for updated age weights. The total score for Static-2002R can range from -2 to 13 and can be used to place individuals in one of five risk categories: Level I - very low risk (scores of -2 to -1), Level II - below average risk (scores of 0 to 1), Level III - average risk (scores of 2 to 4), Level IVa - above average risk (scores of 5 to 6), and Level IVb - well above average risk (scores of 7 or higher; Hanson et al., 2017). When necessary, Static-2002R scores were computed from Static-2002 scores by using the individual's date of birth to calculate the updated age item.
Sexual recidivism. Sexual recidivism was defined as any subsequent offence(s) that were considered sexually motivated (offence, charge or conviction). Some studies, however, did not consider Category B sex offencesNote3 as defined by the Static-99R coding rules (e.g., possession of child pornography, prostitution offenses; Phenix, Fernandez, Harris, Helmus, Hanson, & Thornton, 2017, p. 27). To assess sexual recidivism, official criminal records were used for all of the studies (e.g., CPIC) and unofficial sources were used for a subset of the studies (e.g., news articles).
Psychological constructs of Static-99/R and Static-2002R. Three psychological constructs were identified from the Static-99R and Static-2002R items: 1) persistence/paraphilia, related to deviant sexual interests but without the intent to harm their victims (e.g., pedophilia, voyeurism, and exhibitionism), 2) youthful stranger aggression, related to the intent to sexually harm the victim (e.g., sexual sadism, hostility towards women), and 3) general criminality, related to the antisocial trait (e.g., impulsivity, lack of remorse, rule violations; Brouillette-Alarie et al., 2016; Brouillette-Alarie et al., 2017). These psychological constructs were used to compare risk-relevant characteristics between Indigenous and White individuals who had committed sexual crimes.
Plan of Analysis
Aggregation of findings. AUC values and logistic regression parameters across the studies were aggregated using fixed-effect meta-analyses (Borenstein, Hedges, Higgins, & Rothstein, 2009; Hanson & Broom, 2005). Fixed-effect analyses have the advantage of providing an estimate of between-study variability (Q) that can be used to compare the variability across the studies (Borenstein et al., 2009). The Q statistics is distributed as a chi-square, with k-1 degree of freedom (k = the number of studies).
Comparing the risk-relevant characteristics. For assessing the relationship of risk-relevant characteristics between Indigenous and White study groups, AUC analyses (Swets, Dawes, & Monahan, 2000) were used. The AUC can vary between 0 and 1, with .50 indicating no difference between the groups. AUCs above .50 indicate that the Indigenous study group has higher levels of the risk-relevant characteristic compared to the White study group. As a rough heuristic, an AUC of .56 corresponds to small effect size, while .64 reflects a moderate effect, and .71 reflects a large effect size (Rice & Harris, 2005). In contrast, AUCs below .50 indicate that the White study group has higher levels of the risk relevant characteristic compared to the Indigenous study group (.44 for a small effect, .33 for a moderate effect, and .29 for a large effect). An AUC value is statistically significant if the 95% confidence interval does not include .50.
When a risk factor was a binary variable, the odds ratio (instead of AUC) was calculated with 0.5 added to each cell to stabilize the variance (Fleiss & Berlin, 2009). An odds ratio is defined as p/(1-p), where p is the raw proportion of the sample with the characteristic. Odds ratios above 1 indicate that the Indigenous study group has higher levels of the risk-relevant characteristic compared to the White study group. For example, an odds ratio of 2 would indicate that the Indigenous study group has twice the odds of having the risk-relevant characteristic compared to the White study group. No association is indicated when the 95% confidence interval of the odds ratio contains 1 (i.e., the odds are equal for both groups).
Predictive validity of Static-99R and Static-2002R. Assessing the predictive accuracy of a risk assessment instrument requires considering discrimination (how different are recidivists from non-recidivists?) as well as calibration (correspondence between expected and observed recidivism rates). For discrimination, we used two statistical methods: 1) AUCs from receiver operating characteristic (ROC) analysis (Swets et al., 2000), and 2) odds ratios from logistic regression (Hosmer, Lemeshow, & Sturdivant, 2013). For calibration, we used a fixed-effect meta-analysis to compare logistic regression parameters (i.e., base rates; Borenstein et al., 2009; Hanson & Broom, 2005).
Area Under the Curve (AUC). AUC values can also be interpreted as the probability that a randomly selected recidivist would have a more deviant score than a randomly selected non-recidivist. AUC values are expected to be smaller in prognostic studies than in diagnostic studies because the outcome of interest in prognostic studies does not exist at the time of assessment, and may never happen (Royston, Moons, Altman, & Vergouwe, 2009; Helmus & Babchishin, 2017). The AUC has the advantage of being insensitive to base rates and robust to outliers (Ruscio, 2008). An AUC value is statistically significant if the 95% confidence interval does not include .50.
To compare the unpaired AUC values, bootstrapping (n = 10,000) was used to obtain the standard error (S.E.) of the differences between AUC1 and AUC2 of the two (original) ROC curves with a pROC packagefor the statistical software R (Robin et al., 2011, 2014). The 95% confidence intervals of differences between AUC1 and AUC2 were calculated as follows:
95% C.I. = (AUC1 – AUC2) ± 1.96* S.E.
The difference of AUC values is statistically significant if the 95% confidence interval does not include 0.
Odds ratios. Odds ratios indicate the change in relative risk associated with a one-unit change in Static-99/R and Static-2002R scores. For example, Static-99R scores for the 5-year estimates are associated with a consistent relative risk increase of approximately 1.28 (Hanson, Thornton, Helmus, & Babchishin, 2016) in the high-risk/high-needs samples. This indicates that the odds of recidivism increase 1.28 times as each Static-99R score increases. The primary advantage of odds ratios is that they are less influenced by a restriction of range than AUCs (Hanson, 2008).
Comparing logistic regression parameters. Calibration was examined by comparing the extent to which logistic regression parameters, such as intercept values (centered on Static-99R scores of 2 [B02] and Static-2002R scores of 3[B03]), differed from the logistic regression parameters for the high-risk/high-needs sample norms (Hanson et al., 2016). B0 coefficients centered on 2 for the Static-99R and centered on 3 for the Static-2002R (median values among those with a sexual offence conviction in Canada) represent the expected recidivism rate for sex offenders in the middle of the risk distribution. Specifically, the B02 represents the expected recidivism rate for a Static-99R score of 2 (p2) in logit units (ln[p2/{1-p2}]) and the B03 represents the expected recidivism rate for a Static-2002R score of 3 (p3) in logit units (ln[p3/{1-p3}]).
In addition, high-risk/high-needs sample norms were used to evaluate the calibration of the Static-99R and Static-2002R given that the current samples were preselected as individuals with a high risk to reoffend (e.g., individuals flagged as potential Dangerous Offenders or who had attended high-intensity treatment). Differences between the parameters in the current sample and those of the norms were tested using Q statistics from a fixed-effect meta-analysis (Borenstein et al., 2009; Hanson & Broom, 2005). The Q statistics is distributed as a chi-square, with k-1 degree of freedom (k = the number of studies, which in this case k = 2: Indigenous study group versus the norms, and, separately, the White study group versus the norms).
The index used to assess the differences between the parameters of Indigenous and White study groups was the bi-difference statistic, which was calculated for each parameter by subtracting the bi of the White samples from bi of the Indigenous samples. The variance for the bi difference was calculated according to the Ley (1972) using the following formula:
Var (bi diff) = s2x + s2y - 2rxysxsy
where sx is the standard deviation of the di from the Indigenous sample, sy is the standard deviation of the di from the White sample, and rxy is the correlation coefficient estimating the relationship between the average effect size for the Indigenous sample and the White sample.
Results
The Indigenous study group was, on average, approximately 4 years younger than the White study group (36.1 versus 40.6 years; AUC = .61, 95% CI [.57, .65]). The average Static-99R and Static-2002R total scores for both groups were in the Above Average range (Risk Level IVa, see Table 1), and were approximately a 1/2 point higher for the Indigenous study group than the White study group (4.8 versus 4.3 for Static-99R, AUC = .57, 95% CI [.53, .60]; 6.1 versus 5.7 for Static-2002R, AUC = .55, 95% CI [.51, .59]).
Indigenous |
White |
||||||||
|---|---|---|---|---|---|---|---|---|---|
Study |
n |
Age at release |
Static-99R |
Static-2002R |
n |
Age at release |
Static-99R |
Static-2002R |
|
M (SD) |
M (SD) |
M (SD) |
M (SD) |
M (SD) |
M (SD) |
||||
Bonta & Yessine (2005) |
37 |
36.8 (7.8) |
5.1 (2.1) |
- |
118 |
40.4 (10.1) |
5.0 (2.2) |
- |
|
Haag (2005) |
50 |
33.7 (8.7) |
4.2 (1.9) |
5.8 (1.9) |
141 |
38.6 (10.1) |
3.9 (2.4) |
5.5 (2.5) |
|
Olver et al. (2018) |
425 |
- |
4.6 (2.4) |
- |
739 |
- |
3.2 (2.9) |
- |
|
Brankley et al. (2017) |
36 |
35.5 (8.4) |
4.7 (2.0) |
6.3 (2.1) |
346 |
40.4 (11.6) |
4.2 (2.4) |
5.9 (2.5) |
|
Lee et al. (2018) |
105 |
38.3 (9.2) |
5.4 (2.1) |
6.4 (2.1) |
216 |
43.9 (12.3) |
4.8 (2.7) |
5.8 (2.8) |
|
Average (fixed-effect) |
653 |
36.1 (4.2) |
4.8 (0.9) |
6.1 (1.2) |
1,560 |
40.6 (5.5) |
4.3 (1.1) |
5.7 (1.5) |
|
Comparing Risk-Relevant Characteristics
The Indigenous study group showed less persistence/paraphilia than the White study group (AUC = .39). Compared to the White study group, the Indigenous study group was significantly less likely to have a history of non-contact sex offences (odds ratio = 0.45), male victim (odds ratio = 0.22), unrelated young victim (odds ratio = 0.27), and prior sex offences (AUC = 0.45; Table 2).
Regarding youthful stranger aggression, the Indigenous study group showed a significantly higher score than the White study group (AUC of .60). The difference was attributed to two items (age at release and index non-sexual violence). Specifically, the Indigenous study group was significantly younger than the White study group (AUC of .59) and more likely to have been convicted of a violent index offence (odds ratio = 1.61; Table 2).
Indigenous |
White |
Odds Ratio |
95% CI |
AUC |
|||||
|---|---|---|---|---|---|---|---|---|---|
Items |
% |
n/N |
% |
n/N |
|||||
Persistence/Paraphilia |
|||||||||
Prior sex offences (Static-99R; Item #5) |
.453 [.413, .493] |
||||||||
None |
36.0 |
82/228 |
34.7 |
285/821 |
|||||
1-2 charges or 1 conviction |
30.3 |
69/228 |
22.5 |
185/821 |
|||||
3-5 charges or 2-3 convictions |
21.9 |
50/228 |
19.5 |
160/821 |
|||||
6+ charges or 4+ convictions |
11.8 |
27/228 |
23.3 |
191/821 |
|||||
Prior sentencing occasions for sexual offences (Static-2002R; Item #2) |
.470 [.424, .515] |
||||||||
None |
36.0 |
82/191 |
38.8 |
273/703 |
|||||
1 |
26.8 |
61/191 |
32.7 |
230/703 |
|||||
2-3 |
18.4 |
42/191 |
20.5 |
144/703 |
|||||
4 or more |
2.6 |
6/191 |
8.0 |
56/703 |
|||||
Rate of sexual offending (Static-2002R; Item #4) |
1.04 |
[0.73, 1.48] |
|||||||
< 1 sentencing occasion every 15 years |
71.7 |
137/191 |
72.4 |
509/703 |
|||||
≥ 1 sentencing occasion every 15 years |
28.3 |
54/191 |
27.6 |
194/703 |
|||||
Non-contact sex offences (Static-99R; Item #7) |
0.45 |
[0.24, 0.82] |
|||||||
No |
94.7 |
215/227 |
88.6 |
727/821 |
|||||
Yes |
5.3 |
12/227 |
11.4 |
94/821 |
|||||
Male victim (Static-99R; Item #10) |
0.22 |
[0.15, 0.35] |
|||||||
No |
88.6 |
202/228 |
63.2 |
519/821 |
|||||
Yes |
11.4 |
26/228 |
36.8 |
302/821 |
|||||
2+ victims < 12 year-old, one unrelated (Static-2002R;Item # 7) |
0.27 |
[0.18, 0.40] |
|||||||
No |
82.7 |
158/191 |
56.2 |
395/703 |
|||||
Yes |
17.3 |
33/191 |
43.8 |
308/703 |
|||||
Persistence/Paraphilia |
M = 1.48 (SD = 1.53), n = 191 |
M = 2.18 (SD = 1.81), n = 703 |
.387 [.343, .430] |
||||||
Youthful stranger aggression |
|||||||||
Age at release (Static-99R; Item #1) |
.590 [.549, .631] |
||||||||
18 to 34.9 |
46.6 |
103/221 |
33.3 |
263/789 |
|||||
35 to 39.9 |
18.6 |
41/221 |
18.0 |
142/789 |
|||||
40 to 59.9 |
33.9 |
75/221 |
41.7 |
329/789 |
|||||
60 or older |
0.9 |
2/221 |
7.0 |
55/789 |
|||||
Juvenile sexual arrest prior to age 18 (Static-2002R; Item #3) |
1.01 |
[0.56, 1.81] |
|||||||
No |
92.1 |
176/191 |
92.0 |
647/703 |
|||||
Yes |
7.9 |
15/191 |
8.0 |
56/703 |
|||||
Ever lived with a lover for +2 years (Static-99R; Item #2) |
1.23 |
[0.91, 1.66] |
|||||||
Yes |
57.7 |
131/227 |
62.7 |
510/814 |
|||||
No |
42.3 |
96/227 |
37.3 |
304/814 |
|||||
Index non-sexual violence - any convictions (Static-99R; Item #3) |
1.61 |
[1.18, 2.19] |
|||||||
No |
63.0 |
143/227 |
73.2 |
601/821 |
|||||
Yes |
37.0 |
84/227 |
26.8 |
220/821 |
|||||
Unrelated victim (Static-99R; Item #8) |
0.73 |
[0.47, 1.13] |
|||||||
No |
13.6 |
31/228 |
10.4 |
85/821 |
|||||
Yes |
86.4 |
197/228 |
89.6 |
736/821 |
|||||
Stranger victim (Static-99R; Item #9) |
1.21 |
[0.90, 1.62] |
|||||||
No |
50.4 |
115/228 |
55.1 |
452/820 |
|||||
Yes |
49.6 |
113/228 |
44.9 |
368/820 |
|||||
Youthful stranger aggression |
M = 3.26 (SD = 1.62), n = 184 |
M = 2.68 (SD = 1.77), n = 668 |
.599 [.553, .644] |
||||||
General Criminality |
|||||||||
Any community supervision violation (Static-2002R; Item #12) |
3.88 |
[2.36, 6.36] |
|||||||
No |
9.9 |
19/191 |
30.4 |
214/703 |
|||||
Yes |
90.1 |
172/191 |
69.6 |
489/703 |
|||||
Years free prior to index sex offence (Static-2002R; Item #13) |
3.11 |
[2.05, 4.72] |
|||||||
> 36 months prior to sexual offence AND > 48 months prior to sex conviction |
15.7 |
30/191 |
37.0 |
260/703 |
|||||
< 36 months prior to sexual offence OR < 48 months prior to sex conviction |
84.3 |
161/191 |
63.0 |
443/703 |
|||||
Prior criminal involvement (Static-2002R; Item #10) |
2.58 |
[1.37, 4.86] |
|||||||
No |
5.8 |
11/191 |
14.1 |
99/703 |
|||||
Yes |
94.2 |
180/191 |
85.9 |
604/703 |
|||||
Prior sentencing occasions for anything (Static-2002R; Item #11) |
.670 [.628, .712] |
||||||||
0-2 |
14.7 |
28/191 |
42.5 |
299/703 |
|||||
3-13 |
64.9 |
124/191 |
50.9 |
358/703 |
|||||
14 + |
20.4 |
39/191 |
6.5 |
46/703 |
|||||
Prior sentencing dates (Static-99R; Item #6) |
3.17 |
[2.28, 4.41] |
|||||||
3 or less |
24.6 |
56/228 |
50.9 |
418/821 |
|||||
4 or more |
75.4 |
172/228 |
49.1 |
403/821 |
|||||
Prior non-sexual violence – any convictions (Static-99R; Item #4) |
3.25 |
[2.36, 4.47] |
|||||||
No |
27.6 |
63/228 |
55.5 |
455/820 |
|||||
Yes |
72.4 |
165/228 |
44.5 |
365/820 |
|||||
Prior non-sexual violence sentencing occasion (Static-2002R; Item #14) |
3.96 |
[2.79, 5.61] |
|||||||
No |
27.7 |
53/191 |
60.5 |
425/703 |
|||||
Yes |
72.3 |
138/191 |
39.5 |
278/703 |
|||||
General Criminality |
M = 4.47 (SD = 1.43), n = 191 |
M = 3.22 (SD = 1.74), n = 703 |
.722 [.682, .763] |
||||||
Note: Numbers in bold indicate statistical significance (i.e., p < 0.05). |
|||||||||
The Indigenous study group showed more general criminality than the White study group (AUC = .72; Table 2). All the items associated with general criminality were significantly higher for the Indigenous study group than the White study group. Compared to the White study group, the Indigenous study group was more likely to have a history of community supervision violation, prior non-sexual violent crimes, and prior criminal involvement.
Predictive Accuracy of Three Psychological Structures and Items
Persistence/paraphilia predicted sexual recidivism for the White study group (AUC of .65). The AUC value for the Indigenous study group was, however, lower than that of the White study group (AUC of .58), but the difference was not statistically significant. All the items of persistence/paraphilia had lower predictive accuracy for the Indigenous study group compared the White study group. Only two items (prior sex offences and unrelated young victim) significantly predicted sexual recidivism rates for the Indigenous study group. For one item (non-contact sex offences), the direction of the effect was reversed for the Indigenous study group (i.e., Indigenous peoples with a history of non-contact sex offences are less likely to commit another sexual crime in the future; Table 3).
Indigenous |
White |
||||||||
|---|---|---|---|---|---|---|---|---|---|
Items |
AUC |
n/N |
AUC |
n/N |
Diff. |
95% C.I. |
|||
Persistence/Paraphilia |
|||||||||
Prior sex offences (Static-99R; Item #5) |
.608 [.528, .688] |
59/219 |
.626 [.582, .670] |
187/759 |
- .018 |
[-.108, .072] |
|||
Prior sentencing occasions for sexual offences (Static-2002R; Item #2) |
.571 [.482, .660] |
50/182 |
.628 [.582, .674] |
171/641 |
- .057 |
[-.159, .045] |
|||
Rate of sexual offending (Static-2002R; Item #4) |
.573 [.496, .650] |
50/182 |
.606 [.564, .647] |
171/641 |
- .033 |
[-.120, .054] |
|||
Non-contact sex offences (Static-99R; Item #7) |
.474 [.448, .499] |
59/219 |
.522 [.494, .551] |
187/759 |
- .048 |
[-.086, -.010] |
|||
Male victim (Static-99R; Item #10) |
.495 [.449, .541] |
59/219 |
.538 [.498, .579] |
187/759 |
- .043 |
[-.103, .017] |
|||
2+ victims < 12 year-old, one unrelated (Static-2002R;Item # 7) |
.572 [.502, .641] |
50/182 |
.573 [.530. .617] |
171/641 |
- .001 |
[-.050, .048] |
|||
Persistence/Paraphilia |
.581 [.489, .673] |
50/182 |
.645 [.597, .693] |
171/641 |
- .127 |
[-.333, .079] |
|||
Youthful stranger aggression |
|||||||||
Age at release (Static-99R; Item #1) |
.514 [.436, .592] |
59/219 |
.616 [.574, .659] |
186/757 |
- .102 |
[-.189, -.015] |
|||
Juvenile sexual arrest prior to age 18 (Static-2002R; Item #3) |
.502 [.458, .546] |
50/182 |
.534 [.507, .561] |
171/641 |
-.032 |
[-.084, .020] |
|||
Ever lived with a lover for +2 years (Static-99R; Item #2) |
.470 [.396, .543] |
59/218 |
.531 [.490, .571] |
186/753 |
- .061 |
[-.143, .021] |
|||
Index non-sexual violence - any convictions (Static-99R; Item #3) |
.580 [.506, .654] |
59/218 |
.512 [.476, .549] |
187/759 |
.068 |
[-.013, .149] |
|||
Unrelated victim (Static-99R; Item #8) |
.516 [.466, .566] |
59/219 |
.537 [.516, .558] |
187/759 |
- .021 |
[-.074, .032] |
|||
Stranger victim (Static-99R; Item #9) |
.513 [.438, .588] |
59/219 |
.577 [.536, .618] |
187/758 |
- .064 |
[-.148, .020] |
|||
Youthful stranger aggression |
.529 [.439, .620] |
50/182 |
.644 [.597, .690] |
170/636 |
- .115 |
[-.217, -.013] |
|||
General Criminality |
|||||||||
Any community supervision violation (Static-2002R; Item #12) |
.572 [.542, .602] |
50/182 |
.616 [.582, .649] |
171/641 |
- .044 |
[-.089, .001] |
|||
Years free prior to index sex offence (Static-2002R; Item #13) |
.517 [.459, .576] |
50/182 |
.579 [.539, .619] |
171/641 |
- .062 |
[-.133, .009] |
|||
Prior criminal involvement (Static-2002R; Item #10) |
.500 [.461, .539] |
50/182 |
.548 [.522, .573] |
171/641 |
- .048 |
[-.095, -.001] |
|||
Prior sentencing occasions for anything (Static-2002R; Item #11) |
.578 [.499, .578] |
50/182 |
.592 [.549, .635] |
171/641 |
- .014 |
[-.105, .077] |
|||
Prior sentencing dates (Static-99R; Item #6) |
.568 [.509, .626] |
59/219 |
.566 [.525, .607] |
187/759 |
.002 |
[-.096, .100] |
|||
Prior non-sexual violence – any convictions (Static-99R; Item #4) |
.563 [.501, .625] |
59/219 |
.541 [.500, .583] |
187/758 |
.022 |
[-.051, .095] |
|||
Prior non-sexual violence sentencing occasion (Static-2002R; Item #14) |
.545 [.475, .616] |
50/182 |
.515 [.472, .558] |
171/641 |
.030 |
[-.051, .111] |
|||
General Criminality |
.589 [.501, .677] |
50/182 |
.613 [.568, .658] |
171/641 |
-.024 |
[-.122, .074] |
|||
Note: Numbers in bold indicate statistical significance (i.e., p < 0.05). |
|||||||||
Youthful stranger aggression predicted sexual recidivism for the White study group (AUC of .64), but not for the Indigenous study group (AUC of .53), which was significantly lower than that of the White study group. Specifically, the item of age at release for the Indigenous study group did not predict sexual recidivism and was significantly lower than the value for the White study group (AUCs of .51 versus .62). In other words, sexual recidivism risk for the Indigenous study group was unrelated to age at release. In addition, it was found that the relationship between the Indigenous study group and their victims (i.e., unrelated/stranger victim) was not associated with sexual recidivism risk. Only one item (index non-sexual violence) predicted sexual recidivism for the Indigenous study group (AUC of .58) whereas it did not predict for the White study group (AUC of .51). The difference was, however, not statistically significant (Table 3).
Overall, general criminality significantly and similarly predicted sexual recidivism for both Indigenous and White study groups (AUC of .59 and .61). The item of prior criminal involvement did not predict sexual recidivism for the Indigenous study group (AUC of .50), and it was also significantly lower than that of the White study group (AUC of .55; Table 3). Most AUC values between Indigenous and White study groups, however, did not differ significantly.
Predictive Validity Static-99R and Static-2002R
Overall, sexual recidivism rates for the Indigenous study group were higher than those of White study group (Table 4). For the Indigenous study group, 16.2% sexually reoffended within a fixed 5-year follow-up period and 24.0% sexually reoffended within a fixed 10-year follow-up period. For the White study group, 11.9% sexually reoffended within a fixed 5-year follow-up period and 19.3% sexually reoffended within a fixed 10-year follow-up period.
Indigenous |
White |
||||||||
|---|---|---|---|---|---|---|---|---|---|
Study |
Sexual Recidivism |
AUC |
Sexual Recidivism |
AUC |
|||||
% |
n/N |
% |
n/N |
||||||
Fixed 5-year |
|||||||||
Bonta & Yessine (2005) |
19.2 |
5/26 |
.60 [.25, .96] |
14.4 |
13/90 |
.71 [.58, .85] |
|||
Haag (2005) |
28.0 |
14/50 |
.60 [.42, .77] |
17.7 |
25/141 |
.70 [.59, .81] |
|||
Olver et al. (2018) |
14.3 |
57/400 |
.62 [.55, .70] |
9.6 |
64/665 |
.71 [.65, .77] |
|||
Brankley et al. (2017) |
11.4 |
4/35 |
.62 [.27, .97] |
11.4 |
35/308 |
.70 [.61, .80] |
|||
Lee et al. (2018) |
19.3 |
17/88 |
.56 [.41, .72] |
15.8 |
27/171 |
.69 [.59, .79] |
|||
Average (fixed-effect) |
16.2 |
97/599 |
.61 [.55, .67]ns |
11.9 |
164/1,375 |
.70 [.66, .74] ns |
|||
Fixed 10-year |
|||||||||
Olver et al. (2018) |
23.4 |
64/274 |
.67 [.59, .74] |
16.7 |
72/432 |
.71 [.65, .77] |
|||
Brankley et al. (2017) |
20.0 |
7/35 |
.60 [.34, .87] |
21.7 |
65/299 |
.74 [.67, .80] |
|||
Lee et al. (2018) |
28.8 |
19/66 |
.66 [.51, .81] |
23.1 |
27/117 |
.70 [.59, .82] |
|||
Average (fixed-effect) |
24.0 |
90/375 |
.66 [.60, .72] ns |
19.3 |
164/848 |
.72 [.68, .76] ns |
|||
Note: ns indicates no significant variability across studies (Q statistics). Numbers in bold indicate statistical significance (i.e., p < 0.05). |
|||||||||
Static-99R
Discrimination. Using the fixed 5-year follow-up, the Static-99R was able to discriminate recidivists from non-recidivists for both Indigenous and White study groups. Whereas the White study group had the moderate AUC value of .70, the AUC value for the Indigenous study group was smaller (AUC = .61). With the fixed 10-year follow-up, the AUC value of the Indigenous study group increased to moderate effect size (AUC of .66) but was still lower than the AUC value of the White study group (AUC of .72; Table 4).
Before comparing predictive accuracies across groups, the degree of consistency within each group was examined. For the Indigenous study group, both the 5-year (5 studies) and 10-year sexual recidivism rates (3 studies) with a Static-99R score of 2 (B02) were very similar across the studies included in this meta-analysis (both p > .50, see Table 5). The relative risk (B1) of the Static-99R across the studies was also very similar with a fixed 5-year follow-up (5 studies) as well as with a fixed 10-year follow-up (3 studies; both p > .70, see Table 5).
Study |
Base rate (Static-99R score of 2 in logit units) |
Relative risk |
Odds Ratio |
95% C.I. |
|||||
|---|---|---|---|---|---|---|---|---|---|
B02 |
SE |
B1 |
SE |
Lower |
Upper |
||||
Fixed 5-year |
|||||||||
Bonta & Yessine (2005) |
- 1.876 |
(13.3%) |
.954 |
.162 |
.234 |
1.18 |
0.72 |
1.63 |
|
Haag (2005) |
- 1.384 |
(20.0%) |
.551 |
.187 |
.181 |
1.21 |
0.85 |
1.56 |
|
Olver et al. (2018) |
- 2.393 |
(8.4%) |
.265 |
.201 |
.067 |
1.22 |
1.09 |
1.35 |
|
Brankley et al. (2017) |
- 2.366 |
(8.6%) |
.991 |
.114 |
.283 |
1.12 |
0.57 |
1.68 |
|
Lee et al. (2018) |
- 2.030 |
(11.6%) |
.623 |
.168 |
.148 |
1.18 |
0.89 |
1.47 |
|
Q (df = 4) |
2.93, p = .570 |
0.14, p = .998 |
|||||||
I2 |
0.0 |
0.0 |
|||||||
Average (fixed-effect) |
- 2.175 |
(10.2%) |
.212 |
.190 |
.056 |
1.21 |
1.09 |
1.35 |
|
Fixed 10-year |
|||||||||
Olver et al. (2018) |
- 2.001 |
(11.9%) |
.276 |
.274 |
.071 |
1.32 |
1.18 |
1.45 |
|
Brankley et al. (2017) |
- 1.736 |
(15.0%) |
.783 |
.126 |
.226 |
1.13 |
0.69 |
1.58 |
|
Lee et al. (2018) |
- 2.195 |
(10.0%) |
.756 |
.342 |
.175 |
1.41 |
1.06 |
1.75 |
|
Q (df = 2) |
0.18, p = .914 |
0.58, p = .750 |
|||||||
I2 |
0.0 |
0.0 |
|||||||
Average (fixed-effect) |
- 1.995 |
(12.0%) |
.246 |
.271 |
.063 |
1.31 |
1.16 |
1.48 |
|
Note: Numbers in bold indicate statistical significance (i.e., p < 0.05). |
|||||||||
For the White study group, both the 5-year (5 studies) and 10-year sexual recidivism rates (3 studies) with a Static-99R score of 2 (B02) across the studies were very similar (both p > .60, see Table 6). The relative risk (B1) of Static-99R across the studies was also very similar with a fixed 5-year follow-up (5 studies; p = .93) as well as with a fixed 10-year follow-up (3 studies; p = .60; Table 6).
Study |
Base rate (Static-99R score of 2 in logit units) |
Relative risk |
Odds Ratio |
95% C.I. |
|||||||||
|---|---|---|---|---|---|---|---|---|---|---|---|---|---|
B02 |
SE |
B1 |
SE |
Lower |
Upper |
||||||||
Fixed 5-year |
|||||||||||||
Bonta & Yessine (2005) |
- 3.305 |
(3.5%) |
.863 |
.442 |
.188 |
1.56 |
1.19 |
1.92 |
|||||
Haag (2005) |
- 2.343 |
(8.8%) |
.392 |
.324 |
.106 |
1.38 |
1.17 |
1.59 |
|||||
Olver et al. (2018) |
- 2.889 |
(5.3%) |
.212 |
.287 |
.054 |
1.33 |
1.23 |
1.44 |
|||||
Brankley et al. (2017) |
- 3.047 |
(4.5%) |
.366 |
.340 |
.089 |
1.40 |
1.23 |
1.58 |
|||||
Lee et al. (2018) |
- 2.539 |
(7.3%) |
.401 |
.279 |
.092 |
1.32 |
1.14 |
1.50 |
|||||
Q (df = 4) |
2.75, p = .600 |
0.90, p = .925 |
|||||||||||
I2 |
0.0 |
0.0 |
|||||||||||
Average (fixed-effect) |
- 2.797 |
(5.7%) |
.151 |
.306 |
.038 |
1.36 |
1.26 |
1.46 |
|||||
Fixed 10-year |
|||||||||||||
Olver et al. (2018) |
- 2.149 |
(10.4%) |
.228 |
.326 |
.059 |
1.38 |
1.27 |
1.50 |
|||||
Brankley et al. (2017) |
- 2.437 |
(8.0%) |
.292 |
.407 |
.075 |
1.50 |
1.36 |
1.65 |
|||||
Lee et al. (2018) |
- 2.070 |
(11.2%) |
.406 |
.300 |
.099 |
1.35 |
1.15 |
1.54 |
|||||
Q (df = 2) |
0.78, p = .677 |
1.02, p = .600 |
|||||||||||
I2 |
0.0 |
0.0 |
|||||||||||
Average (fixed-effect) |
- 2.227 |
(9.7%) |
.164 |
.346 |
.042 |
1.41 |
1.30 |
1.53 |
|||||
Note: Numbers in bold indicate statistical significance (i.e., p < 0.05). |
|||||||||||||
The 5-year sexual recidivism rates with a Static-99R score of 2 for the Indigenous study group were significantly higher than that of the White study group (10.2% versus 5.7%; Table 7; Figure 1). The 10-year sexual recidivism rates at a Static-99R score of 2 for the Indigenous study group were, however, similar to that of the White study group (11.9% versus 9.7%; Table 7; Figure 2). The discrimination (change in relative risk) was higher for the White study group than for the Indigenous study group with both 5-year (odds ratios = 1.21 versus 1.36) as well as 10-year follow-up periods (1.31 versus 1.41), but these differences in discrimination between racial groups were not statistically significant (Table 7; Figure 1; Figure 2).
Meta-Average (HRHN Norms) |
Indigenous |
White |
BIndigenous-White |
95% C.I. |
|||||
|---|---|---|---|---|---|---|---|---|---|
Fixed 5-year |
|||||||||
Base rate |
|||||||||
B02 (SD) |
- 2.06 (.153) (11.3%) |
- 2.18 (.212) (10.2%) |
- 2.80 (.151) (5.7%) |
0.623 |
[0.179, 1.066] |
||||
QΔ (df = 1) |
0.18 |
11.60*** |
|||||||
Relative risk |
|||||||||
B1 (SD) |
.250 (.042) |
.190 (.055) |
.306 (.038) |
- 0.116 |
[- 0.245, 0.013] |
||||
QΔ (df = 1) |
0.755 |
0.971 |
|||||||
Fixed 10-year |
|||||||||
Base rate |
|||||||||
B02 (SD) |
- 1.44 (.186) (19.2%) |
- 2.00 (.246) (11.9%) |
- 2.23 (.164) (9.7%) |
0.232 |
[- 0.307, 0.770] |
||||
QΔ (df = 1) |
3.64 |
9.99** |
|||||||
Relative risk |
|||||||||
B1 (SD) |
.231 (.056) |
.271 (.063) |
.346 (.042) |
- 0.075 |
[- 0.222, 0.071] |
||||
QΔ (df = 1) |
0.28 |
2.72 |
|||||||
Note: ***p < .001, **p < .01, * p < .05. r (between Indigenous and White) = 0.260 for B02 and 0.208 for B1. Numbers in bold indicate statistical significance (i.e., p < 0.05). |
|||||||||
Figure 1. Logistic curves of Static-99R for Indigenous and White study groups with the High Risk/High Need Norms with a fixed 5-year follow-up.
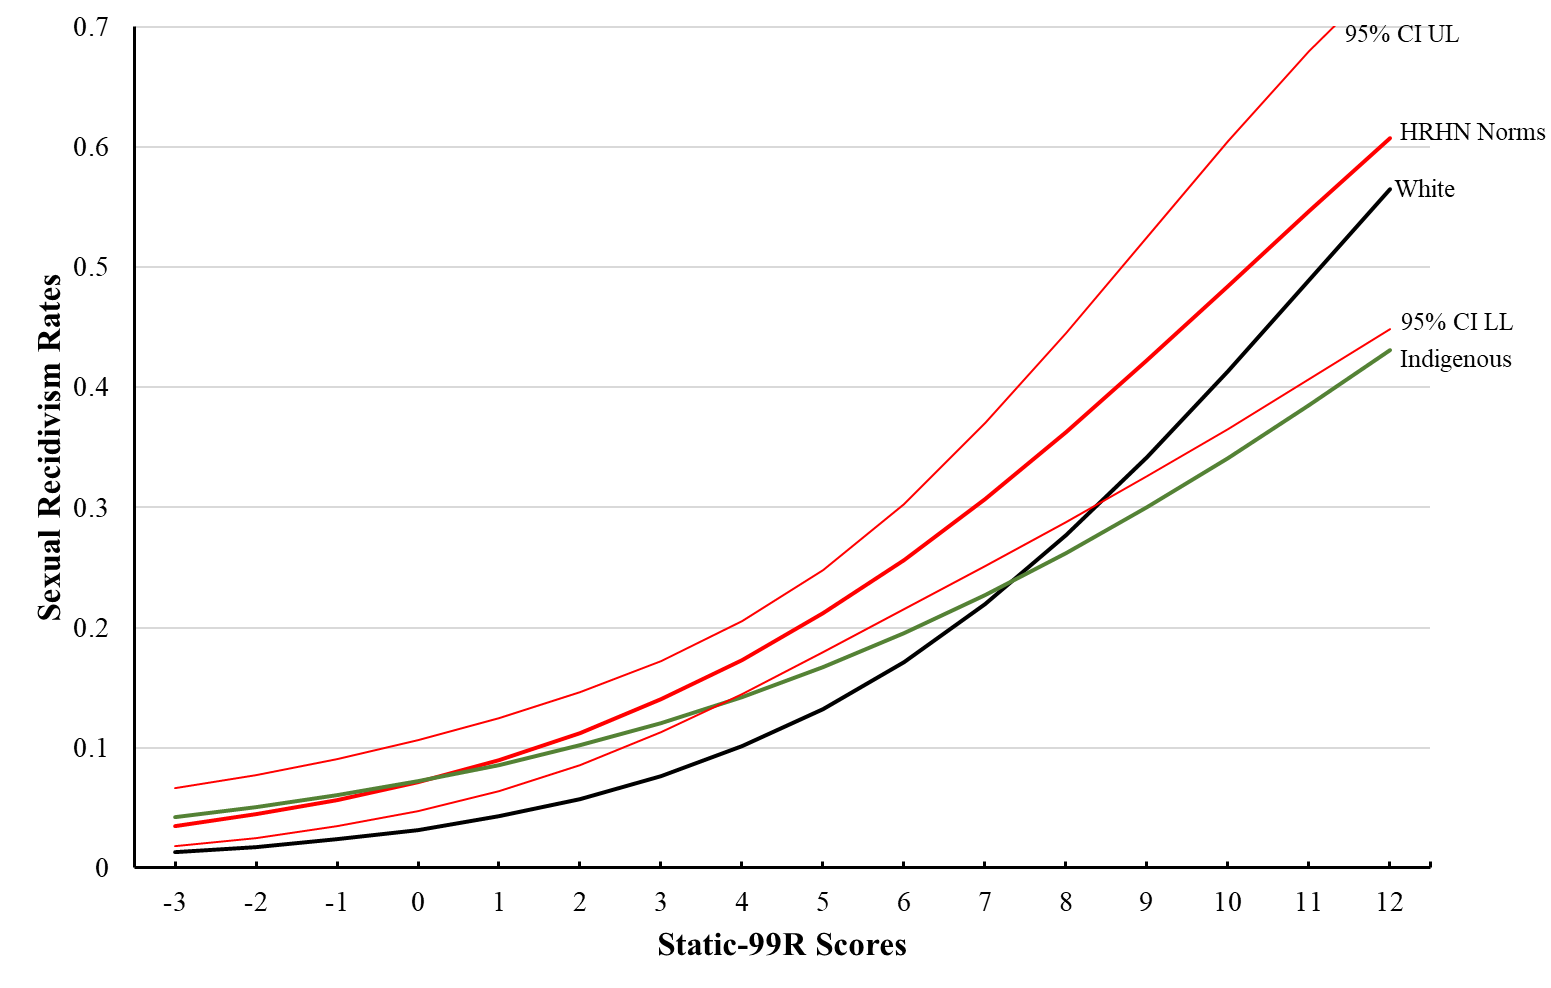
Image description
This figure illustrates the logistic curves of Static-99R for Indigenous and White study groups with the High Risk/High Need Norms with a fixed 5-year follow-up showing the 5-year sexual recidivism rates with a Static-99R score of 2 for the Indigenous study group were significantly higher than that of the White study group (10.2% versus 5.7%). The discrimination (change in relative risk) was higher for the White study group than for the Indigenous study group with both 5-year (odds ratios = 1.21 versus 1.36) as well as 10-year follow-up periods (1.31 versus 1.41), but these differences in discrimination between racial groups were not statistically significant
Figure 2. Logistic curves of Static-99R for Indigenous and White study groups with the High Risk/High Need Norms with a fixed 10-year follow-up.
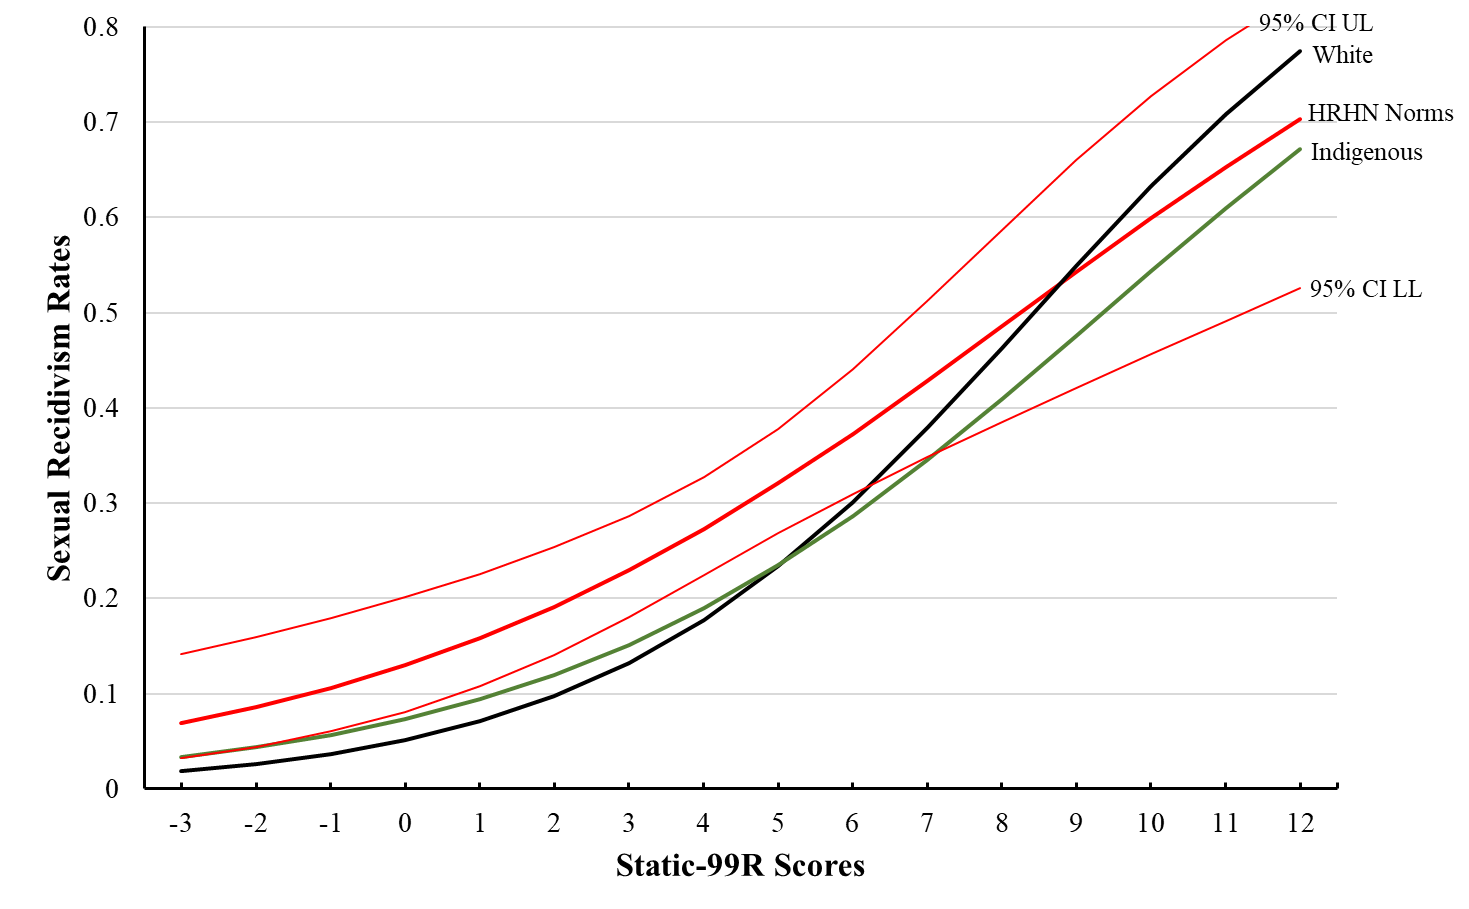
Image description
This figure illustrates the logistic curves of Static-99R for Indigenous and White study groups with the High Risk/High Need Norms with a fixed 10-year follow-up showing the 10-year sexual recidivism rates at a Static-99R score of 2 for the Indigenous study group were similar to that of the White study group (11.9% versus 9.7%). The discrimination (change in relative risk) was higher for the White study group than for the Indigenous study group with both 5-year (odds ratios = 1.21 versus 1.36) as well as 10-year follow-up periods (1.31 versus 1.41), but these differences in discrimination between racial groups were not statistically significant
Calibration. For the Indigenous study group, when compared to the high-risk/high-needs norms (from Hanson et al., 2016), the adjusted (score of 2) base rate with a fixed 5-year follow-up period was slightly lower (11.3% versus 10.2%) and the discrimination was smaller (odds ratios = 1.28 versus 1.21), but those differences were not statistically significant (Table 7; Figure 1). With a fixed 10-year follow-up period, the adjusted (score of 2) base rate for the Indigenous study group was lower (19.2% versus 11.9%), and the discrimination was larger for the Indigenous study group compared to the norms (odds ratios = 1.26 versus 1.31), but those differences were not statistically significant (Table 7; Figure 2).
For the White study group, when compared to the high-risk/high-needs norms (from Hanson et al., 2016), the adjusted (score of 2) base rate with a fixed 5-year follow-up period was significantly lower (11.3% versus 5.7%) and the discrimination was larger (odds ratios = 1.28 versus 1.36), but not significant (Table 7; Figure 1). With a fixed 10-year follow-up period, the adjusted (score of 2) base rate for the White study group was significantly lower (19.2% versus 9.7%), and the discrimination was larger (odds ratios = 1.26 versus 1.41), but not significantly so (Table 7; Figure 2).
Static-2002R
Compared to those of Static-99R, the sample size of the Indigenous study group for the Static-2002R was reduced to 173 (3 studies) with a 5-year follow-up period and 101 (2 studies) with a 10-year follow-up period.
Discrimination. The Static-2002R was able to discriminate recidivists from non-recidivists for the White study group (AUCs > .69). The predictive accuracy of Static-2002R for the Indigenous study group was, however, lower (AUCs < .61) and not statistically significant (Table 8).
Study |
Indigenous |
White |
|||||||
|---|---|---|---|---|---|---|---|---|---|
Sexual Recidivism |
AUC |
Sexual Recidivism |
AUC |
||||||
% |
n/N |
% |
n/N |
||||||
Fixed 5-year |
|||||||||
Haag (2005) |
28.0 |
14/50 |
.56 [.36, .75] |
17.7 |
25/141 |
.69 [.59, .80] |
|||
Brankley et al. (2017) |
11.4 |
4/35 |
.57 [.27, .87] |
11.4 |
35/308 |
.70 [.61, .79] |
|||
Lee et al. (2018) |
19.3 |
17/88 |
.56 [.42, .70] |
15.8 |
27/171 |
.69 [.59, .79] |
|||
Average (fixed-effect) |
20.2 |
35/173 |
.56 [.45, .67]ns |
14.0 |
87/620 |
.69 [.64, .75] ns |
|||
Fixed 10-year |
|||||||||
Brankley et al. (2017) |
20.0 |
7/35 |
.64 [.40, .88] |
21.7 |
65/299 |
.74 [.67, .80] |
|||
Lee et al. (2018) |
28.8 |
19/66 |
.60 [.45, .75] |
23.1 |
27/117 |
.69 [.58, .81] |
|||
Average (fixed-effect) |
25.7 |
26/101 |
.61 [.49, .74] ns |
22.1 |
92/416 |
.72 [.67, .78] ns |
|||
Note: ns indicates no significant variability across studies (Q statistics). Numbers in bold indicate statistical significance (i.e., p < 0.05). |
|||||||||
Similar to the outcomes of Static-99R, there were very consistent base rates and relative risk levels of Static-2002R across studies within each racial group. Specifically, for the Indigenous study group, both the 5-year (3 studies) and 10-year sexual recidivism rates (2 studies) with a Static-2002R score of 3 (B03) across the studies were very similar (both p > .40; Table 9). The overall outcomes of Static-2002R, however, did not seem to be stable given the small number of studies in the meta-analysis. For example, the average base rate (B03) within a fixed 5-year follow-up (16.4%) was higher than that within a fixed 10-year follow-up (14.3%) because there were a different number of studies in each analysis. The relative risk (B1) of the Static-2002R across the studies was also very similar with a fixed 5-year follow-up (3 studies) as well as with a fixed 10-year follow-up (2 studies; both p > .60; see Table 9). Nevertheless, the relative risk (i.e., odds ratios) of the Static-2002R was not statistically significant (i.e., poor discrimination; Table 9).
Study |
Base rate (Static-2002R score of 3 in logit units) |
Relative risk |
Odds Ratio |
95% C.I. |
|||||||
|---|---|---|---|---|---|---|---|---|---|---|---|
B03 |
SE |
B1 |
SE |
Lower |
Upper |
||||||
Fixed 5-year |
|||||||||||
Haag (2005) |
- 1.212 |
(22.9%) |
.600 |
.092 |
.171 |
1.09 |
0.76 |
1.43 |
|||
Brankley et al. (2017) |
- 2.540 |
(7.3%) |
1.124 |
.142 |
.268 |
1.15 |
0.63 |
1.68 |
|||
Lee et al. (2018) |
- 1.768 |
(14.6%) |
.563 |
.093 |
.132 |
1.10 |
0.84 |
1.36 |
|||
Q (df = 2) |
1.20, p = .549 |
0.03, p = .985 |
|||||||||
I2 |
0.0 |
0.0 |
|||||||||
Average (fixed-effect) |
- 1.630 |
(16.4%) |
.386 |
.099 |
.097 |
1.10 |
0.91 |
1.34 |
|||
Fixed 10-year |
|||||||||||
Brankley et al. (2017) |
- 2.437 |
(8.0%) |
.997 |
.293 |
.229 |
1.34 |
0.89 |
1.79 |
|||
Lee et al. (2018) |
- 1.560 |
(17.4%) |
.591 |
.178 |
.137 |
1.19 |
0.93 |
1.46 |
|||
Q (df = 1) |
0.42, p = .449 |
0.19, p = .667 |
|||||||||
I2 |
0.0 |
0.0 |
|||||||||
Average (fixed-effect) |
- 1.788 |
(14.3%) |
.509 |
.208 |
.117 |
1.23 |
0.97 |
1.55 |
|||
For the White study group, both the 5-year (3 studies) and 10-year sexual recidivism rates (2 studies) with a Static-2002R score of 3 (B03) across the studies were very similar (both p > .20; Table 10). The relative risk (B1) of Static-2002R across the studies was also very similar with a fixed 5-year follow-up (3 studies) as well as with a fixed 10-year follow-up (2 studies; p > .20; Table 10).
Study |
Base rate (Static-2002R score of 3 in logit units) |
Relative risk |
Odds Ratio |
95% C.I. |
||||||
|---|---|---|---|---|---|---|---|---|---|---|
B03 |
SE |
B1 |
SE |
Lower |
Upper |
|||||
Fixed 5-year |
||||||||||
Haag (2005) |
- 2.506 |
(7.5%) |
.427 |
.313 |
.100 |
1.37 |
1.17 |
1.56 |
||
Brankley et al. (2017) |
- 3.200 |
(3.9%) |
.407 |
.314 |
.085 |
1.37 |
1.20 |
1.53 |
||
Lee et al. (2018) |
- 2.561 |
(7.2%) |
.410 |
.248 |
.085 |
1.28 |
1.11 |
1.45 |
||
Q (df = 2) |
1.76, p = .415 |
0.37, p = .829 |
||||||||
I2 |
0.0 |
0.0 |
||||||||
Average (fixed-effect) |
- 2.765 |
(6.0%) |
.239 |
.289 |
.052 |
1.34 |
1.21 |
1.48 |
||
Fixed 10-year |
||||||||||
Brankley et al. (2017) |
- 2.686 |
(6.4%) |
.332 |
.391 |
.072 |
1.48 |
1.34 |
1.62 |
||
Lee et al. (2018) |
- 2.040 |
(11.5%) |
.406 |
.258 |
.089 |
1.29 |
1.12 |
1.47 |
||
Q (df = 1) |
1.52, p = .220 |
1.36, p = .248 |
||||||||
I2 |
0.0 |
0.0 |
||||||||
Average (fixed-effect) |
- 2.427 |
(8.1%) |
.257 |
.338 |
.056 |
1.40 |
1.26 |
1.56 |
||
Note. Numbers in bold indicate statistical significance (i.e., p < 0.05). |
||||||||||
The 5-year sexual recidivism rates with a Static-2002R score of 3 for the Indigenous study group were significantly higher than that of the White study group (16.4% versus 6.0%; Table 11; Figure 3). The 10-year sexual recidivism rates with a Static-2002R score of 3 for the Indigenous study group were also higher than that of the White study group, but the difference was not statistically significant (14.3% versus 8.1%). The discrimination (change in relative risk) was higher for the White study group than the Indigenous study group for both 5-year (odds ratios = 1.10 versus 1.34) and 10- year follow-up periods (1.23 versus 1.40); however, the difference between racial groups was statistically significant only for the 5-year follow-up period (Table 11; Figure 3).
Meta-Average (HRHN Norms) |
Indigenous |
White |
B Indigenous-White |
95% C.I. |
|||||
|---|---|---|---|---|---|---|---|---|---|
Fixed 5-year |
|||||||||
Base rate |
|||||||||
B03 (SD) |
- 1.88 (.153) (13.2%) |
- 1.63 (.386) (16.4%) |
- 2.76 (.239) (6.0%) |
1.135 |
[0.402, 1.868] |
||||
QΔ (df = 1) |
0.36 |
9.75** |
|||||||
Relative risk |
|||||||||
B1 (SD) |
.218 (.042) |
.099 (.097) |
.289 (.051) |
- 1.190 |
[- 0.379, - 0.001] |
||||
QΔ (df = 1) |
1.24 |
1.15 |
|||||||
Fixed 10-year |
|||||||||
Base rate |
|||||||||
B03 (SD) |
- |
- 1.78 (.509) (14.3%) |
- 2.43 (.257) (8.1%) |
0.639 |
[- 0.303, 1.581] |
||||
QΔ (df = 1) |
- |
- |
|||||||
Relative risk |
|||||||||
B1 (SD) |
- |
.208 (.117) |
.338 (.056) |
- 0.130 |
[- 0.356, 0.095] |
||||
QΔ (df = 1) |
- |
- |
|||||||
Note. ***p < .001, **p < .01, * p < .05. r(between Indigenous and White) = 0.359 for B02 and 0.280 for B1. Numbers in bold indicate statistical significance (i.e., p < 0.05). |
|||||||||
Figure 3. Logistic curves of Static-2002R for Indigenous and White study groups with the High Risk/High Need Norms with a fixed 5-year follow-up.
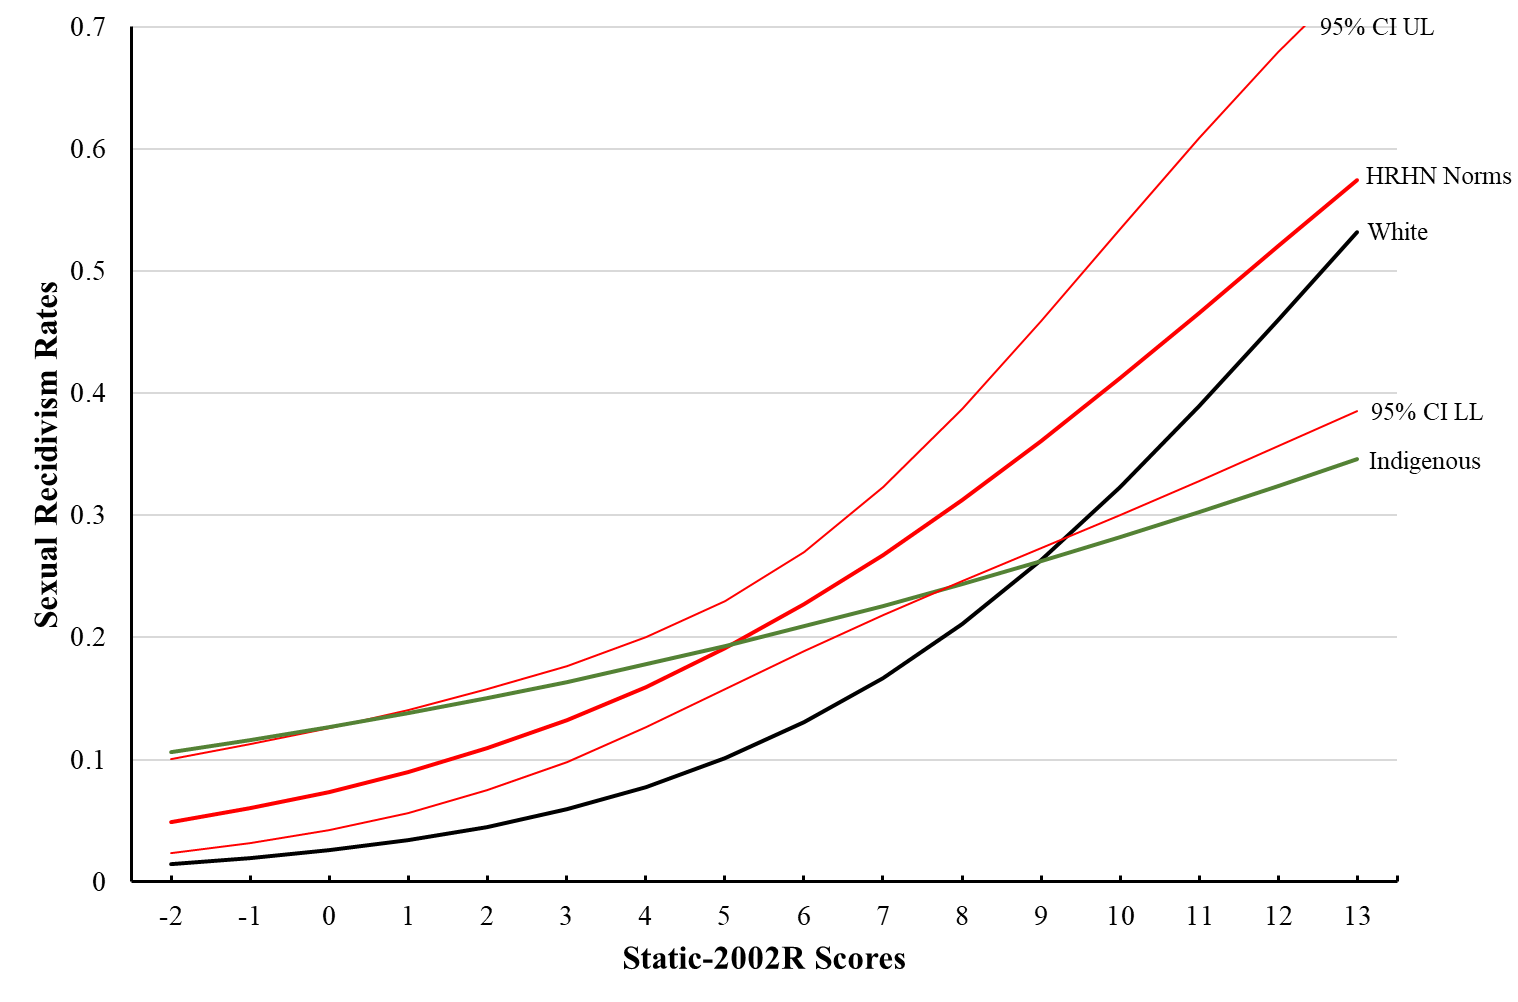
Image description
This figure illustrates the logistic curves of Static-2002R for Indigenous and White study groups with a High Risk/High Need Norms with a fixed 5-year follow-up showing the 5-year sexual recidivism rates with a Static-2002R score of 3 for the Indigenous study group were significantly higher than that of the White study group (16.4% versus 6.0%). The 10-year sexual recidivism rates with a Static-2002R score of 3 for the Indigenous study group were also higher than that of the White study group, but the difference was not statistically significant (14.3% versus 8.1%). The discrimination (change in relative risk) was higher for the White study group than the Indigenous study group for both 5-year (odds ratios = 1.10 versus 1.34) and 10- year follow-up periods (1.23 versus 1.40); however, the difference between racial groups was statistically significant only for the 5-year follow-up period.
Calibration. For the Indigenous study group, when compared to the high-risk/high-needs norms (from Hanson et al., 2016), the adjusted (score of 3) base rate with a fixed 5-year follow-up period was slightly higher (13.2% versus 16.4%; p = .55), and the discrimination was smaller, but not significantly (odds ratios = 1.24 versus 1.10; p = .27; Table 11). Nevertheless, the overall calibration was poor at the high-risk level (e.g., 6 or higher - Level IVb; Figure 3). There were meaningful discrepancies between expected and observed recidivism rates at the highest risk levels (i.e., overestimation).
For the White study group, when compared to the high-risk/high-needs norms (from Hanson, et al., 2016), the adjusted (score of 3) base rate with a fixed 5-year follow-up period was significantly lower (13.2% versus 6.0%) and the discrimination was larger, but not significant (odds ratios = 1.24 versus 1.34; Table 11; Figure 3).
Discussion
Professional and legal concerns, in particular, the Ewert decision (2018), motivates research on the extent to which widely utilized risk assessment tools, such as the Static-99R and Static-2002R, are valid for use with individuals of Indigenous heritage in the criminal justice system. To this end, the current study examined the potential cultural bias in the predictive validity (both discrimination and calibration) of the Static-99R and Static-2002R for Indigenous individuals with a history of sexual crimes in Canada. Furthermore, this study also examined whether Indigenous peoples who commit sexual crimes have different patterns of risk-relevant characteristics from White individuals and whether these differences could potentially help to explain any observed cultural bias.
Predictive Accuracy of Static-99R and Static-2002R
Consistent with previous findings (i.e., Babchishin, Blais, et al., 2012), Indigenous peoples with a history of sexual crimes had higher total scores on both the Static-99R and Static-2002R than White individuals. When examining discrimination, the Static-99R was able to discriminate recidivists from non-recidivists for both Indigenous and White individuals. However, AUCs tended to be lower for Indigenous individuals (e.g., AUCs of .66 for Indigenous peoples versus .72 for White individuals with a 10-year follow-up period). Results were not as positive for Static-2002R: total scores significantly discriminated recidivists from non-recidivists for White individuals (e.g., AUC of .72 with a 10-year follow-up period), however, neither of the AUCs for the 5-year or the 10-year follow-up period was significant with Indigenous individuals (AUCs = .56 and .61, respectively).
Regarding calibration, there were no significant differences in adjusted base rates (at a score of 2) for Indigenous individuals compared to the high-risk/high-needs norms for Static-99R. In addition, although the overall rates across the Static-99R scores were lower than expected rates (from the norms), the estimated recidivism probability from the norms corresponded well with the observed recidivism probability of the current sample. In contrast, the estimated recidivism probability from the norms of the Static-2002R did not correspond with the observed recidivism probability of the current sample. For White individuals, the adjusted 5-year base rates of sexual recidivism were significantly lower than the high-risk/high-needs norms for the Static-99R and Static-2002R. This finding also extended to the 10-year follow-up period for Static-99R. This indicates that the high-risk/high-needs norms may over-estimate risk for White individuals.
Differences in discrimination between the Static-99R and Static-2002R for Indigenous peoples are somewhat surprising given that the two scales contain many of the same items and are highly correlated (rs ranging from .70 to .92; Babchishin, Hanson, & Helmus, 2012). It is possible that these findings reflect chance variation because the sample size for the Static-2002R studies was small (e.g., the 10-year estimates were based on only two samples with a total of 101 Indigenous individuals, of which 26 were sexual recidivists). Babchishin, Blais, et al.'s (2012) similar finding of relative low discrimination for the Static-2002R compared to the Static-99R cannot be interpreted as an independent replication because of the substantial overlap in the samples included in both meta-analyses. Nevertheless, the current results support extreme caution when using Static-2002R with individuals of Indigenous heritage.
Psychological Constructs
It is possible for a scale to significantly predict the desired outcome between two different cultural groups (i.e., measurement equivalence) while exhibiting cultural bias in the identified underlying constructs of that same scale (i.e., structural non-equivalence; Byrne et al., 2009). Across both Indigenous and White individuals with a history of sexual crimes, the presence and predictive validity of the underlying psychological constructs identified for the Static-99R and Static-2002R were examined. Indigenous individuals had significantly fewer indicators of persistence/paraphilia (e.g., less prior sex offences, non-contact offences, male victims, and young victims) and significantly more indicators of youthful stranger aggression (e.g., younger at release, more non-sexual violence at index) and general criminality (e.g., community supervision violations, prior criminal involvement, prior non-sexual violence, etc.) compared to White individuals. This pattern of results is consistent with the general research on risk assessment with Indigenous peoples (e.g., Babchishin, Blais et al., 2012; Helmus et al., 2012; Olver et al., 2018; Perley-Robertson et al., 2018; Shepherd et al., 2014).
Neither the persistence/paraphilia nor the youthful stranger aggression constructs significantly predicted sexual recidivism for Indigenous individuals. Given that these constructs did predict sexual recidivism for White individuals, it is possible that the same items are measuring different constructs for individuals of different racial/ethnic backgrounds. In contrast, general criminality similarly predicted sexual recidivism for both groups. Several specific findings across the constructs are worth highlighting.
When examining individual items of the persistence/paraphilia construct, the difference in discrimination could be attributed to two items: a) non-contact sex offences and b) any male victim. For White individuals, those items are well-established indicators of general sexual deviancy and paraphilic interests (e.g., pedophilia, exhibitionism, voyeurism). Further research is required to determine whether these items measure similar constructs for Indigenous peoples. Although there is no reason to believe that the construct of deviant sexual interests does not apply to individuals of Indigenous heritage, the Static-99R and Static-2002R might not include items that specifically address how sexual deviancy is expressed among Indigenous peoples.
In particular, it was surprising that a history of non-contact sex offences predicted less, not more, sexual recidivism for Indigenous individuals. A history of noncontact sexual offending is strongly related to increased sexual recidivism among predominately White samples (Hanson & Bussière, 1998; Helmus & Thornton, 2015). Although all explanations are highly speculative, it may be that exhibitionism, which is the strongest driver of the increased risk for noncontact offending among White individuals, could be a culturally specific disorder. For White individuals, exhibitionism is often a highly repetitive and persistent disorder. It could also be a disorder of White males (like serial killing). The noncontact offending was rare among the Indigenous individuals in the current study, and it is similarly rare for African Americans (Lee, Hanson, Calkins, & Jeglic, 2018).
Within the youthful stranger aggression construct, the lack of relationship between age and sexual recidivism for Indigenous peoples was unexpected. Among White males, there is strong empirical support for declining sexual recidivism risk with advanced age (Barbaree & Blanchard, 2008; Hanson, 2002), supported by credible theory, including decreased sexual drive, predictable increases in sexual self-regulation, and reductions in opportunity (Hanson, 2002). Some cultural values of Indigenous society might suppress the effect of age on sexual recidivism. For example, there might be unique cultural values that promote sexual self-regulation and suppress sexually deviant interests from a young age. As well, sexual offending in middle age may mean something different from youthful offending for Indigenous peoples compared to White individuals. In particular, sexual offending in a person's 40s and 50s may be a sign of persistent problems with sexual self-regulation for Indigenous individuals.
Overall, the differences in the presence and predictive validity of risk-relevant characteristics between Indigenous and White peoples may be indicative of different trajectories or pathways that lead to sexual offending. Recently, Brouillette-Alarie and Proulx (2018) developed an etiological model that included two broad paths to sexual offending, one characterized by social isolation and sexual deviance (e.g., sexual interest in children) and the other characterized by antisociality (e.g., impulsivity), physical and psychological victimization and sexual promiscuity. Whereas the first path was related to sexual recidivism, especially crimes against children, the second was more related to non-sexual violence and sexual offending against adult women. Although the characteristics of the Indigenous individuals in the current study more closely resembled the second, antisocial path than the first, they did not clearly fit that pattern either. It is possible that there are distinctive pathways to sexual offending for Indigenous people that are not well represented by any of our current etiological models. Identifying cultural differences in the etiology of sexual offending could, therefore, add tremendously to our knowledge of Indigenous individuals with a history of sexual crimes.
Cultural bias in Static-99R and Static-2002R for Indigenous People
There were three main findings in this study: 1) the Static-99R showed acceptable discrimination and calibration for both White individuals and Indigenous peoples, 2) the Static-2002R poorly discriminated recidivists from non-recidivists for Indigenous individuals and showed overall poor calibration, and 3) risk-relevant characteristics that predict sexual recidivism for White individuals occur at different levels and predict differently for Indigenous peoples compared to White individuals. These findings, however, raise another central question about how much similarity is sufficient to justify the use of risk assessment tools for any different racial or ethnic group, including the use of the STATIC risk tools with Indigenous peoples. To respond to the Supreme Court's decision in Ewert, we need to know what evidence would be sufficient to support the use of the tools for Indigenous peoples. Conversely, how different do the results need to be before evaluators should not use a risk tool developed on White individuals with a specific racial/ethnic minority?
The scientific and professional communities do not currently have clear conventions or standards to evaluate the extent to which observed cultural variation in assessment tools is tolerable. One approach to setting a limit for cultural bias is to estimate the likelihood that the observed differences are primarily due to chance variation. From this perspective, the a priori expectation is that there are no real cultural differences and that any observed differences are the results of sampling (random or biased) from the same population. For many individuals concerned with Indigenous overrepresentation, the null hypothesis is a very questionable assumption. Instead, some degree of racial differences would be expected, which, from a Bayesian perspective, would lower the amount of evidence required to conclude that real differences were present. The primary problem with relying solely on statistically significant differences, however, is that it is possible to detect differences that are too small to matter. With large samples, differences of a couple of percentage points could be statistically significant but result in the same substantive conclusions.
Another approach to evaluating cultural bias is whether the evidence supports the same inferences for the same test score. From this perspective, the primary concern is the consistency of the decisions that would follow from the test scores. If there are real cultural differences in test performance, these differences are tolerable if the decision maker would nonetheless be justified in making the same decision regardless of the race/ethnicity of the case at hand. For example, parole would be equally denied to a White inmate whose risk was estimated at 30% and to an Indigenous inmate whose risk was estimated at 20% if the acceptable risk threshold was 5 recidivists out of 100 parole releases. In this example, the same score was associated with meaningfully different recidivism rates for White individuals and Indigenous peoples, but despite racial differences, the test results would justify the same decision. In this case, the test supports the valid inference that the individual's risk is greater than 5% for both these racial groups. In contrast, the cultural bias in the test result would be problematic if the decision threshold was 25 out of 100.
The above example suggests that it would be difficult to have a single standard for tolerable cultural bias: the amount and nature of tolerable bias would depend on the decisions that are required. Consequently, evaluators need to consider carefully the extent to which the specific inferences they make from a test score are justified based on the available evidence, and whether any observed racial/cultural differences would influence the decision-at-hand.
For the Static-99R and Static-2002R, there are several different types of information associated with test scores by the tools' developers (Hanson et al., 2017; Phenix, Helmus & Hanson, 2016). These meanings have been organized into standardized risk levels (i.e., Level I, II, III, IVa, and IVb), which are intended to convey quantitative information (percentile ranks, risk ratios, recidivism rates) as well as psychological characteristics (e.g., severity of criminogenic needs, developmental history, treatment needs). The current study focused only on certain quantitative information provided by these risk tools (i.e., risk ratios, recidivism rates). Further research is needed to determine the extent to which other risk-relevant characteristics (e.g., sexual self-regulation problems, response to treatment) have the same associations with the Static-99R and Static-2002R scores for Indigenous and White individuals.
Advancing our understanding of cultural bias in risk assessment tools requires examining the meanings of constructs (i.e., the inferences of risk levels) across different racial/ethnic groups. This study focused on the ability of these risk tools to identify individuals as high risk for sexual recidivism, given its direct relevance for the Ewert case. Overall, the relative risk (odds ratios) and absolute sexual recidivism rates of the Static-99R for Indigenous peoples were very similar to the norms asserted by the test developers (Phenix et al., 2016). Consequently, evaluators can support inferences about sexual recidivism rates based on Static-99R risk levels for both Indigenous and White peoples. In contrast, the findings of the current study did not support the Static-2002R relative risk estimates nor the absolute recidivism rate estimates for Indigenous peoples, for unknown reasons.
Although this study was not intended to directly examine the risk-relevant psychological constructs associated with the standardized risk levels, there were enough significantly different patterns on risk-relevant characteristics between Indigenous and White peoples to suggest that cultural differences were likely. In particular, White individuals showed higher levels of deviant sexual interests whereas Indigenous individuals showed higher levels of general criminality. Consequently, future research should examine the extent to which individuals assessed as an above average risk by the Static-99R and Static-2002R risk tools may present with different psychological profiles depending on their racial/cultural background.
Limitations
Despite several strengths of the current study (e.g., largest sample to date; consideration of discrimination and calibration), there are several aspects that limit confidence in the conclusions. First, it is important to note that Indigenous peoples in Canada are not a homogenous group. They comprise the First Nations (58%) and Inuit (4%), the original inhabitants in North America, and the Métis (35%) those with mixed European and Indigenous ancestry (Statistics Canada, 2018). Each subgroup has its own language and culture. Consequently, it is difficult to determine the extent to which the results generalize to each subgroup.
Furthermore, individuals living off-reserve might show more similar risk-relevant characteristics with White individuals than those living on reserve (e.g., 66% of the First Nations and almost all Métis and Inuit are living off reserve; Statistics Canada, 2018). Those variables were, however, not available in this study. In addition, all individuals with a history of sexual crimes in this study were already identified as high-risk (e.g., from federal prisons, National Flagging System, sex offender treatment programs) and the findings may not generalize to lower risk Indigenous and White individuals (e.g., individuals serving sentences in the community).
Finally, despite having larger samples of Indigenous individuals than previous studies, the numbers were still well below the sample size required for stable logistic regression estimates (i.e., 100 recidivists and 100 non-recidivists; Vergouse, Steyerberg, Eijkemans, & Habbema, 2005).
Implications for Research
The current results reinforce the importance of considering both discrimination (i.e., relative risk) and calibration (i.e., absolute risk) when evaluating risk tools. For example, whereas the Static-99R showed lower discrimination for Indigenous individuals than White individuals, calibration for Indigenous peoples seemed to be similar with or better than White individuals (e.g., the high-risk/high needs norms did not significantly differ from the adjusted recidivism rate of Indigenous individuals but did for White individuals).
Second, there are several important variables that could not be examined in this study that would help in further understanding the differences in the predictive validity of risk assessment scales. As previously mentioned, we were unable to categorize the Indigenous samples into more specific types (i.e., First Nations, Métis, or Inuit) or to consider those who live on reserve versus those who live off-reserve. Bonta, LaPrairie, and Wallace-Capretta (1997) found significant differences between Indigenous peoples living on and off reserve (e.g., off-reserve had higher risk scores), highlighting the importance of considering this variable. Future research should, therefore, try to gain a higher level of specificity when defining the Indigenous group as this would provide a more nuanced appraisal of differences in the predictive validity of risk assessment scales.
Third, no study to date has examined whether the inclusion of culturally specific variables (e.g., loss of native language; effect of residential schools; Mann, 2009) would add incremental validity to the prediction of recidivism outcomes for Indigenous peoples. Relatedly, the inclusion of such factors could potentially help to explain differences in the underlying psychological constructs that have been identified for the Static-99R and Static-2002R. More specifically, there may be constructs that are distinctive to Indigenous individuals in the criminal justice system, and the exclusion of items tapping into these constructs may help explain the relatively poor predictive accuracy of certain risk tools for Indigenous individuals (Gutierrez et al., 2016). As well, there may be patterns of sexual offending that is distinctive to White individuals, such as exhibitionism and the possession of child abuse images (both coded as noncontact sexual offences in the Static-99R and Static-2002R risk tools).
Implications for Policy and Practice
The Static-99R was one of the impugned measures identified in Ewert v. Canada (2015, 2018). Consistent with previous findings (e.g., Babchishin, Blais et al., 2012), the current study supports the use of the Static-99R for Indigenous peoples to identify individuals at high risk for sexual recidivism (Risk Principle). Specifically, the Static-99R was able to discriminate recidivists from non-recidivists for Indigenous peoples at acceptable levels of accuracy. Although the discrimination was lower for Indigenous individuals than White individuals, the differences are small and, even considering the differences, the Static-99R scores support similar inferences for both groups.
Regarding calibration, the base rates of the Static-99R for Indigenous men were very similar to the high-risk/high-needs norms asserted by the test developers (Phenix et al., 2016). In contrast, the Static-2002R had significantly poorer predictive accuracy for Indigenous men (discrimination and calibration) than for either the norms or the White individuals in the current study. Consequently, our findings do not support the use of Static-2002R for assessing the likelihood of sexual recidivism for Indigenous individuals with a history of sexual crimes.
Given that Indigenous men with a history of sexual crimes scored significantly higher on indices of general criminality (e.g., criminal history, non-sexual violence) and significantly lower on indices of sexual criminality (e.g., paraphilia), the treatment for Indigenous men who commit sexual crimes may benefit from an increased focus on general criminality (e.g., antisocial attitudes and behaviours). In addition, treatment programming will likely be most effective when it takes into consideration the cultural values or norms of Indigenous peoples (e.g., spirituality) as well as socio-demographic characteristics that influence their response to treatment (e.g., low education and socioeconomic status, systemic oppression, distrust of criminal justice system; Responsivity PrincipleNote4; Gutierrez, Chadwick, & Wanamaker, 2018).
Conclusion
In Ewert v. Canada (2018), the Supreme Court of Canada ruled that CSC's use of certain recidivism risk tools with Indigenous individuals violated s. 24(1) of the Corrections and Conditional Release Act. Specifically, this section requires that the information CSC uses in making decisions about an offender is as accurate and as up to date as possible. The court did not determine that the use of the expunged tools actually caused harm. Instead, it concluded that CSC had not done its due diligence in verifying the validity for Indigenous peoples of certain risk tools commonly used by the service.
Due to the rules of evidence, the Supreme Court Justices hearing the Ewert case could only consider the scientific research deemed credible by Judge Phelan in the original, 2015 Federal Court hearing. The only expert relied on in that case, Dr. Stephen Hart, asserted in his 2012 report that the validity of the risk tools for Indigenous peoples was unknown because of insufficient research on the topic. Consequently, Chief Justice McLachlin and colleagues were unaware of any subsequent research, including the 2012 meta-analysis of Babchishin and colleagues on the predictive accuracy of the Static-99R and Static-2002R for Indigenous peoples.
As previously stated, there is a lack of clear criteria by which to determine whether any observed amount of cultural bias is tolerable. With regards to the Ewert case, Judges Rowe and Côté noted it was not the place of the courts to determine which risk tools psychologists should use. Decisions concerning the scientific credentials of psychological tests or criminological assessment tools are made by professional communities of practice.
Based on the accumulated evidence and the current results, there is sufficient research to justify the use of the Static-99R, but not Static-2002R, for assessing the likelihood of sexual recidivism among Indigenous men. Some cultural bias in the Static-99R is likely, but the available evidence indicates that Static-99R scores will most often support the same general inferences concerning relative risk and absolute sexual recidivism rates regardless of whether the individual being assessed is White or Indigenous. Nevertheless, given that risk assessment tools are used at every point of contact with the criminal justice system (e.g., policing, sentencing, rehabilitation programming, parole), continued efforts to validate risk assessment scales with Indigenous peoples remains a research priority.
References
Ægisdóttir, S., White, M. J., Spengler, P. M., Maugherman, A. S., Anderson, L. A., Cook, R. S., … Rush, J. D. (2006). The meta-analysis of clinical judgment project: Fifty-six years of accumulated research on clinical versus statistical prediction. The Counseling Psychologist, 34, 341-382. doi: 10.1177/0011000005285875
Andrews, D. A., & Bonta, J. (2010). Rehabilitating criminal justice policy and practice. Psychology, Public Policy, and Law, 16, 39-55. doi:10.1037/a0018362
Andrews, D. A., Bonta, J., & Wormith, S. J. (2006). The recent past and near future of risk and/or need assessment. Crime and Delinquency, 52, 7-27. doi:10.1177/0011128705281756
Babchishin, K. M., Blais, J., & Helmus, L. (2012). Do static risk factors predict differently for Aboriginal sex offenders? A multi-site comparison using the original and revised Static-99 and Static-2002 scales. Canadian Journal of Criminology & Criminal Justice, 54, 1-43. doi:10.1037/t04644-000
Babchishin, K. M., Hanson, R. K., & Helmus, L. (2012). Even highly correlated measures can add incrementally to predicting recidivism among sex offenders. Assessment, 19, 442–461. doi:10.1177/1073191112458312
Barbaree, H. E., & Blanchard, R. (2008). Sexual deviance over the lifespan: Reduction in deviant sexual behavior in the aging sex offender. In D. R. Laws & W. T. O'Donohue (Eds.), Sexual deviance: Theory, assessment, and treatment (pp. 37-60). New York, NY: Guilford.
Blais, J., & Bonta, J. (2015). Tracking and Managing High Risk Offenders: A Canadian Initiative. Law & Human Behavior (American Psychological Association), 39, 253-265. doi:10.1037/lhb0000109
Bonta, J., LaPrairie, C., & Wallace-Capretta, S. (1997). Risk prediction and re-offending: Aboriginal and non-aboriginal offenders. Canadian Journal of Criminology, 39, 127-144.
Bonta, J., & Yessine, A. K. (2005). [Recidivism data for 155 released sexual offenders from the offenders identified in The National Flagging System: Identifying and responding to high risk, violent offenders (User Report 2005-04). Ottawa, ON: Public Safety and Emergency Preparedness Canada.] Unpublished raw data.
Borenstein, M., Hedges, L. V., Higgins, J. P. T., & Rothstein, H. R. (2009). Introduction to meta-analysis. West Sussex, U.K.: John Wiley & Sons, Ltd.
Bourgon, G., Mugford, R., Hanson, R. K., & Coligado, M. (2018). Offender risk assessment practices vary across Canada. Canadian Journal of Criminology & Criminal Justice, 60, 167-205. doi:10.3138/cjccj.2016-0024
Boyce, J. (2016). Victimization of Aboriginal people in Canada, 2014. (Catalogue no. 85-002-X). Retrieved from the Statistics Canada website: https://www150.statcan.gc.ca/n1/en/pub/85-002-x/2016001/article/14631-eng.pdf?st=4WKRP8AE
Brankley, A., Lee, S. C., Babchishin, K. M., Hanson, R. K., & Harris, J. R. (2017). Updated recidivism information for 409 individuals from the Dynamic Predictors Project (1998). Unpublished raw data.
Brouillette-Alarie, S., Babchishin, K. M., Hanson, R. K., & Helmus, L. M. (2016). Latent constructs of the Static-99R and Static-2002R: A three-factor solution. Assessment, 23, 96-111. doi:10.1177/1073191114568114
Brouillette-Alarie, S., & Proulx, J. (2018). The etiology of risk in sexual offenders: A preliminary model. Sexual Abuse. Advance online publication.doi: 10.1177/1079063218759325
Brouillette-Alarie, S., Proulx, J., & Hanson, R. K. (2017). Three central dimensions of sexual recidivism risk: Understanding the latent constructs of Static-99R and Static-2002R. Sexual Abuse. Advance online publication. doi:10.1177/1079063217691965
Byrne, B. M., Oakland, T., Leong, F. T. L., van, d. V., Hambleton, R. K., Cheung, F. M., & Bartram, D. (2009). A critical analysis of cross-cultural research and testing practices: Implications for improved education and training in psychology. Training and Education in Professional Psychology, 3, 94-105. doi:10.1037/a0014516
Canadian Charter of Rights and Freedoms, ss. 7 & 15, Part I of the Constitution Act, 1982, being Schedule B to the Canada Act 1982 (UK), 1982, c 11.
Canadian Institutes of Health Research, Natural Sciences and Engineering Research Council of Canada, & Social Sciences and Humanities Research Council of Canada (2010). Tri-council policy statement: Ethical conduct for research involving humans. Ottawa, ON: Secretariat on Responsible Conduct of Research. Retrieved from http://www.pre.ethics.gc.ca/pdf/eng/tcps2-2014/TCPS_2_FINAL_Web.pdf
Canadian Psychological Association. (2017). Canadian code of ethics for psychologists (4th ed.). Retrieved from https://www.cpa.ca/docs/File/Ethics/CPA_Code_2017_4thEd.pdf
Corrections Act, R.S.N.W.T. 1988, c.C-22.
Corrections and Conditional Release Act (S.C. 1992, c. 20)
Corrections and Conditional Release Act (S.C. 2012, c. 1)
Criminal Code, RSC (1985) c C-46
Department of Justice (2017, September). Spotlight on Gladue: Challenges, experiences, and possibilities in Canada's criminal justice system: 2. Statistical overview on the overrepresentation of Indigenous persons in the Canadian correctional system and legislative reforms to address the problem. https://www.justice.gc.ca/eng/rp-pr/jr/gladue/p2.html
Ellerby, L. A., & MacPherson, P. (2002). Exploring the profiles of Aboriginal sexual offenders: Contrasting Aboriginal and non-Aboriginal sexual offenders to determine unique client Characteristics and potential implications for sex offender assessment and treatment strategies (research report no. R-122). Ottawa, ON: Correctional Service of Canada. Retrieved from: http://www.csc-scc.gc.ca/research/092/r122_e.pdf
Ewert v. Canada, 2007 FC 13
Ewert v. Canada, 2015 FC 1093
Ewert v. Canada, 2018 SCC 30
Fleiss, J. L., & Berlin, J. A. (2009). Effect sizes for dichotomous data. In H. Cooper, L. V. Hedges, & J. C. Valentine (Eds.), The handbook of research synthesis and meta-analysis (2nd ed., pp. 237-253). New York, NY: Russell Sage Foundation.
Geisinger, K. F., & McCormick, C. (2013). Testing and assessment in cross-cultural psychology. In J. R. Graham, J. A. Naglieri & I. B. Weiner (Eds.), Handbook of psychology (Vol. 10). Assessment psychology (2nd ed.) (pp. 114-139). Hoboken, N.J.: John Wiley & Sons Inc.
Gendreau, P., Smith, P., & French, S. A. (2006). The theory of effective correctional intervention: Empirical status of future directions. In F. T. Cullen, J. P. Wright, & K. R. Blevins (Eds.), Taking stock: The status of criminological theory (pp. 419-446). Piscataway, NJ: Transaction Publishers.
Grove, W. M., Zald, D. H., Lebow, B. S., Snitz, B. E., & Nelson, C. (2000). Clinical versus mechanical prediction: A meta-analysis. Psychological Assessment, 12, 19-30. doi:10.1037/1040-3590.12.1.19
Gutierrez, L., Chadwick, N., & Wanamaker, K. A. (2018). Culturally relevant programming versus the status quo: A meta-analytic review of the effectiveness of treatment of indigenous offenders. Canadian Journal of Criminology and Criminal Justice, 60, 321-353. doi:10.3138/cjccj.2017-0020.r2
Gutierrez, L., Helmus, L. M., & Hanson, R. K. (2016). What we know and don't know about risk assessment with offenders of indigenous heritage. Journal of Threat Assessment and Management, 3, 97-106. doi:10.1037/tam0000064
Gutierrez, L., Wilson, H. A., Rugge, T., & Bonta, J. (2013). The prediction of recidivism with aboriginal offenders: A theoretically informed meta-analysis. Canadian Journal of Criminology and Criminal Justice, 55, 55-99. doi:10.3138/cjccj.2011.E.51
Haag, A. M. (2005). Recidivism data from 191 offenders detained until their warrant expiry date. Unpublished raw data. From: Do psychological interventions impact on actuarial measures: An analysis of the predictive validity of the Static-99 and Static-2002 on a re-conviction measure of sexual recidivism. Dissertations Abstracts International, 66(08), 4531B. (UMI No. NR05662).
Haag, A. M., Boyes, A., Cheng, J., MacNeil, A., & Wirove, R. (2016). An introduction to the issues of cross-cultural assessment inspired by Ewert v. Canada. Journal of Threat Assessment and Management, 3, 65-75. doi:10.1037/tam0000067
Hanson, R. K. (2002). Recidivism and age: Follow-up data from 4,673 sexual offenders. Journal of Interpersonal Violence, 17, 1046-1062. doi:10.1177/088626002236659
Hanson, R. K. (2008). What statistics should we use to report predictive accuracy? Crime Scene, 15(1), 15-17. Retrieved from http://www.cpa.ca/cpasite/UserFiles/Documents/Criminal%20Justice/Crime%20Scene%202008-04.pdf
Hanson, R. K., Babchishin, K. M., Helmus, L. M., Thornton, D., & Phenix, A. (2017). Communicating the results of criterion referenced prediction measures: Risk categories for the Static-99R and Static-2002R sexual offender risk assessment tools. Psychological Assessment, 29, 582-597. doi:10.1037/pas0000371
Hanson, R. K., & Broom, I. (2005). The utility of cumulative meta-analysis: Application to programs for reducing sexual violence. Sexual Abuse: Journal of Research and Treatment, 17, 357-373. doi:10.1177/107906320501700402
Hanson, R. K., & Bussière, M. T. (1998). Predicting relapse: a meta-analysis of sexual offender recidivism studies. Journal of Consulting and Clinical Psychology, 66, 348–362. doi:10.1037/0022-006X.66.2.348
Hanson, R. K., & Harris, A. J. (1998). Dynamic Predictors of Sexual Recidivism. (Corrections Research User Report No. 1998–01). Ottawa, Ontario, Canada: Department of the Solicitor General of Canada.
Hanson, R. K., & Harris, A. J. (2000). Where should we intervene? Dynamic predictors of sex offense recidivism. Criminal Justice & Behavior, 27, 6-35. doi:10.1177/0093854800027001002
Hanson, R. K., & Morton-Bourgon, K. E. (2005). The characteristics of persistent sexual offenders: a meta-analysis of recidivism studies. Journal of Consulting and Clinical Psychology, 73, 1154–1163. doi:10.1037/0022-006X.73.6.1154
Hanson, R. K., & Morton-Bourgon, K. (2009). The accuracy of recidivism risk assessments for sexual offenders: A meta-analysis of 118 prediction studies. Psychological Assessment, 21, 1-21. doi:10.1037/a0014421
Hanson, R. K. & Thornton, D. (2000). Improving risk assessments for sex offenders: A comparison of three actuarial scales. Law and Human Behavior, 24, 119-136. doi:10.1023/A:1005482921333
Hanson, R. K., & Thornton, D. (2003). Notes on the development of Static-2002. (Corrections Research User Report No. 2003–01). Ottawa, Ontario, Canada: Department of the Solicitor General of Canada.
Hanson, R. K., Thornton, D., Helmus, L., & Babchishin, K. M. (2016). What sexual recidivism rates are associated with Static-99R and Static-2002R scores? Sexual Abuse: A Journal of Research and Treatment, 28, 218-252. doi:10.1177/1079063215574710
Hare, R. D. (2003). Manual for the Psychopathy Checklist-Revised (2nd ed.). Toronto, Ontario: Multi-Health Systems.
Heilbrun, K. (1997). Prediction versus management models relevant to risk assessment: The importance of legal decision-making context. Law and Human Behavior, 21, 347-359. doi:10.1023/A:102485101794
Helmus, L. M., & Babchishin, K. M. (2017). Primer on risk assessment and the statistics used to evaluate its accuracy. Criminal Justice and Behavior, 44, 8-25. doi:10.1177/0093854816678898
Helmus, L., Babchishin, K. M., & Blais, J. (2012). Predictive accuracy of dynamic risk factors for Aboriginal and non-Aboriginal sex offenders: An exploratory comparison using STABLE-2007. International Journal of Offender Therapy & Comparative Criminology, 56, 856-876. doi:10.1177/0306624X11414693
Helmus, L., & Thornton, D. (2015). Stability and predictive and incremental accuracy of the individual items of Static-99R and Static-2002R in predicting sexual recidivism: A meta-analysis. Criminal Justice and Behavior, 42, 917-937. doi:10.1177/0093854814568891
Helmus, L, Thornton, D, Hanson, R. K., & Babchishin, K. M. (2012). Improving the predictive accuracy of Static-99 and Static-2002 with older sex offenders: Revised age weights. Sexual Abuse: A Journal of Research and Treatment, 24, 64-101. doi:10.1177/1079063211409951
Holsinger, A. M., Lowenkamp, C. T., & Latessa, E. J. (2003). Ethnicity, gender, and the Level of Service Inventory-Revised. Journal of Criminal Justice, 31, 309. doi:10.1016/S0047-2352(03)00025-4
Holsinger, A. M., Lowenkamp, C. T., & Latessa, E. J. (2006). Exploring the predictive validity of the Level of Service Inventory-Revised with Native American offenders. Journal of Criminal Justice, 34, 331-337. doi:10.1016/j.jcrimjus.2006.03.009
Hosmer, D. W., Lemeshow, S., & Sturdivant, R. X. (2013). Applied logistic regression (3rd ed.). New York, NY: Wiley.
Kelley, S. M., Ambroziak, G., Thornton, D., & Barahal, R. M. (2018). How do professionals assess sexual recidivism risk? An updated survey of practices. Sexual Abuse. Advance online publication. doi: 10.1177/1079063218800474
Laprairie, C. (1996). Examining aboriginal corrections in Canada. (Catalogue. No. JS5-1/14-1996E). Ottawa, ON: Ministry of the Solicitor General. Retrieved from: https://www.publicsafety.gc.ca/cnt/rsrcs/pblctns/xmnng-brgnl-crrctns/xmnng-brgnl-crrctns-eng.pdf
LaPrairie, C. (2002). Aboriginal over-representation in the criminal justice system: A tale of nine cities. Canadian Journal of Criminology, 44, 181–208.
Lee, S. C., Mularczyk, K., Babchishin, K. M., Blais, J., & Bonta, J. (2018). Updated recidivism information for 360 individuals from the National Flagging System Project (2015). Unpublished raw data.
Lee, S. C., Hanson, R. K. Calkins, C., & Jeglic, E. (2018). Paraphilia and antisociality: Motivations for sexual offending may differ for American Whites and Blacks. Manuscript submitted for publication.
Ley, P. (1972). Quantitative aspects of psychological assessment: An introduction. London: Duckworth.
MacDonald, S. F. (2014). Profile of Aboriginal men offenders: Custody and supervision snapshots (Report No. 2014 Nº R-321). Retrieved from the Correctional Service Canada website: http://publications.gc.ca/site/eng/9.810320/publication.html
Mann, M. (2009). Good Intentions, Disappointing Results: A Progress Report on Federal Aboriginal Corrections. Ottawa, ON: Office of the Correctional Investigator. Retrieved from http://www.oci-bec.gc.ca/cnt/rpt/pdf/oth-aut/oth-aut20091113-eng.pdf
Mann, R. E., Hanson, R. K., & Thornton, D. (2010). Assessing risk for sexual recidivism: Some proposals on the nature of psychologically meaningful risk factors. Sexual Abuse: Journal of Research and Treatment, 22, 191-217. doi:10.1177/1079063210366039
Ministry of Correctional Services Act, R.S.O. 1990, c. M.22.
Neal, T. M. S., & Grisso, T. (2014). Assessment practices and expert judgment methods in forensic psychology and psychiatry: An international snapshot. Criminal Justice and Behavior, 41, 1406-1421. doi:10.1177/0093854814548449
Office of the Auditor General of Canada. (2016). Preparing Indigenous offenders for release. Ottawa, ON. Retrieved from http://www.oag-bvg.gc.ca/internet/English/parl_oag_201611_03_e_41832.html
Office of the Correctional Investigator (2018). Annual report of the office of the correctional investigator, 2017-2018. (Catalogue no. PS100). Retrieved from the Office of the Correctional Investigator website: http://www.oci-bec.gc.ca/cnt/rpt/pdf/annrpt/annrpt20172018-eng.pdf
Olver, M. E., Sowden, J. N., Kingston, D. A., Nicholaichuk, T. P., Gordon, A., Beggs Christofferson, S. M., & Wong, S. P. (2018). Predictive accuracy of Violence Risk Scale - Sexual Offender Version Risk and change scores in treated Canadian Aboriginal and non-Aboriginal sexual offenders. Sexual Abuse, 30, 254-275. doi:10.1177/1079063216649594
Perley-Robertson, B., Helmus, L. M., & Forth, A. (2018). Predictive accuracy of static risk factors for Canadian indigenous offenders compared to non-indigenous offenders: Implications for risk assessment scales. Psychology, Crime & Law. Advance online publication. doi:10.1080/1068316X.2018.1519827
Phenix, A., Fernandez, Y., Harris, A. J. R., Helmus, M, Hanson R. K. & Thornton D. (2017). Static-99R Coding Rules – Revised 2016. Research Report 2017-R012. Ottawa: Public Safety Canada.
Phenix, A., Helmus, L., & Hanson, R. K. (2016). Static-99R & Static-2002R evaluators' workbook. Retrieved from: http://www.static99.org/
Public Safety Canada (2018). Corrections and Conditional Release Statistical Overview. (Catalogue No. PS1-3E-PDF). Retrieved from the Public Safety Canada website: https://www.publicsafety.gc.ca/cnt/rsrcs/pblctns/ccrso-2017/index-en.aspx
Quann, N. L., & Trevethan, S. (2000). Police-reported Aboriginal crime in Saskatchewan. (Catalogue no.85F0031XIE). Ottawa, ON: Statistics Canada. Retrieved from: http://www.publications.gc.ca/site/eng/9.685779/publication.html
R. v. Gladue, [1999] 1 S.C.R. 688.
Rastin, C. J., & Johnson, S. L. (2002). Inuit sexual offenders: Victim, offence and recidivism characteristics. Forum on Corrections Research, 14(3). Ottawa, ON: Correctional Service of Canada. Retrieved from: http://www.csc-scc.gc.ca/research/forum/e143/143n_e.pdf
Reynolds, C. R., & Suzuki, L. A. (2013). Bias in psychological assessment: An empirical review and recommendations. In J. R. Graham, J. A. Naglieri, & I. B. Weiner (Eds.), Handbook of psychology: Assessment psychology (Vol. 10, pp. 82-113). Hoboken, NJ: John Wiley.
Rice, M. E., & Harris, G. T. (2005). Comparing effect sizes in follow-up studies: ROC area, Cohen's d, and r. Law and Human Behavior, 29, 615-620. doi:10.1007/s10979-005-6832-7
Robin, X., Turck, N., Hainard, A., Tiberti, N., Lisacek, F., Sanchez, J., & Müller, M. (2011).pROC: an open-source package for R and S+ to analyze and compare ROC curves. BMC Bioinformatics, 12, 77-84. doi:10.1186/1471-2105-12-77
Robin, X., Turck, N., Hainard, A., Tiberti, N., Lisacek, F., Sanchez, J., & Müller, M. (2014). Package 'pROC'. Retrieved from:https://cran.r-project.org/web/packages/pROC/pROC.pdf
Rojas, E. Y., & Gretton, H. M. (2007). Background, offence characteristics, and criminal outcomes of aboriginal youth who sexually offend: A closer look at aboriginal youth intervention needs. Sexual Abuse: Journal of Research and Treatment, 19, 257-283. doi:10.1177/107906320701900306
Royal Commission on Aboriginal Peoples (1996). Highlights from the Report of the Royal Commission on Aboriginal People (Catalogue no. Z1-1991/1-6E). Retrieved from the Indigenous and Northern Affairs Canada website: https://www.aadnc-aandc.gc.ca/eng/1100100014597/1100100014637#chp3
Royston, P., Moons, K., Altman, D., & Vergouwe, Y. (2009). Prognosis and prognostic research: Developing a prognostic model. British Medical Journal, 338, 1373-1377. doi:10.1136/bmj.b604
Rudin, J. (2009). Aboriginal Peoples and the Criminal Justice System. Retrieved from: http://www.archives.gov.on.ca/en/e_records/ipperwash/policy_part/research/pdf/Rudin.pdf
Ruscio, J. (2008). A probability-based measure of effect size: Robustness to base rates and other factors. Psychological Methods, 13, 19-30. doi:10.1037/1082-989X.13.1.19
Scrim, K. (2010). Aboriginal victimization in Canada: A summary of the literature. Victims of Crime Research Digest, 3. Retrieved from http://www.justice.gc.ca/eng/rp-pr/cj-jp/victim/rd3-rr3/p3.html
Shepherd, S. M., Adams, Y., McEntyre, E., & Walker, R. (2014). Violence risk assessment in Australian aboriginal offender populations: A review of the literature. Psychology, Public Policy, and Law, 20, 281-293. doi:10.1037/law0000017
Sinha, V., Trocmé, N., Fallon, B., MacLaurin, B., Fast, E., Prokop, S. T., … Richard, K. (2011). Kiskisik Awasisak: Remember the children. Understanding the overrepresentation of First Nations children in the child welfare system. Ontario: Assembly of First Nations. Retrieved from the Canadian Child Welfare Research Portal website: http://cwrp.ca/publications/2280
Sioui, R., & Thibault, J. (2002). Examining reintegration potential for Aboriginal offenders. Forum on Corrections Research, 14, 49-51.
Statistics Canada (2005). Projections of the Aboriginal populations, Canada, provinces and territories- 2001 to 2017. (Catalogue no. 91-547-XIE). Retrieved from the Statistics Canada website: https://www150.statcan.gc.ca/n1/pub/91-547-x/91-547-x2005001-eng.pdf
Statistics Canada (2015). Aboriginal statistics at a glance (Catalogue no. 89-645-X2015001). Retrieved from the Statistics Canada website:
https://www150.statcan.gc.ca/n1/en/pub/89-645-x/89-645-x2015001-eng.pdf?st=_GMvlN8d
Statistics Canada (2018). Aboriginal Population Profile. 2016 Census. (Catalogue no. 98-510-X2016001). Retrieved from the Statistics Canada website: http://www12.statcan.gc.ca/census-recensement/2016/dp-pd/abpopprof/details/page.cfm?Lang=E&Geo1=PR&Code1=01&Data=Count&SearchText=Canada&SearchType=Begins&B1=All&SEX_ID=1&AGE_ID=1&RESGEO_ID=1
Swets, J. A., Dawes, R. M., & Monahan, J. (2000). Psychological science can improve diagnostic decisions. Psychological Science in the Public Interest, 1, 1-26. doi:10.1111/1529-1006.001
Trevethan, S., Moore, J.-P., & Rastin, C. J. (2002). A profile of Aboriginal offenders in federal facilities and serving time in the community. Forum on Corrections Research, 14, 17-19. Retrieved from: http://www.csc-scc.gc.ca/text/pblct/forum/e143/143f_e.pdf
Truth and Reconciliation Commission of Canada (2015). Honouring the truth, reconciling for the future. Winnipeg, Manitoba, Canada: Author.
Vergouwe, Y., Steyerberg, E. W., Eijkemans, J. C., & Habbema, J. D. F. (2005). Substantial effective sample sizes are required for external validation studies of predictive logistic regression models. Journal of Clinical Epidemiology, 58, 475-483. doi:10.1016/j.jclinepi.2004.06.017
Whitaker, D. J., Le, B., Karl Hanson, R., Baker, C. K., McMahon, P. M., Ryan, G., ... Rice, D. D. (2008). Risk factors for the perpetration of child sexual abuse: A review and meta-analysis. Child Abuse & Neglect, 32, 529-548. doi:10.1016/j.chiabu.2007.08.005
Wong, S., Olver, M. E., Nicholaichuk, T. P., & Gordon, A. (2003). The Violence Risk Scale: Sexual Offender version (VRS-SO). Saskatoon, Saskatchewan, Canada: Regional Psychiatric Centre and the University of Saskatchewan.
Appendix A
Study |
N |
Pacific |
Prairies |
Ontario |
Quebec |
Atlantic |
|||||||||
|---|---|---|---|---|---|---|---|---|---|---|---|---|---|---|---|
n |
(%) |
n |
(%) |
n |
(%) |
n |
(%) |
n |
(%) |
||||||
Bonta & Yessine (2005)1 |
256 |
51 |
(20.0) |
104 |
(40.6) |
65 |
(25.4) |
0 |
(0.0) |
36 |
(14.1) |
||||
Indigenous |
37 |
- |
- |
- |
- |
- |
- |
- |
- |
- |
- |
||||
White |
118 |
- |
- |
- |
- |
- |
- |
- |
- |
- |
- |
||||
Haag (2005) |
191 |
28 |
(14.7) |
57 |
(29.8) |
69 |
(36.1) |
22 |
(11.5) |
15 |
(7.9) |
||||
Indigenous |
50 |
8 |
(16.0) |
30 |
(60.0) |
6 |
(12.0) |
4 |
(8.0) |
2 |
(4.0) |
||||
White |
141 |
20 |
(14.2) |
27 |
(19.1) |
63 |
(44.7) |
18 |
(12.8) |
13 |
(9.2) |
||||
Olver et al. (2018)2 |
1,164 |
- |
- |
- |
- |
- |
- |
- |
- |
- |
- |
||||
Indigenous |
425 |
- |
- |
- |
- |
- |
- |
- |
- |
- |
- |
||||
White |
739 |
- |
- |
- |
- |
- |
- |
- |
- |
- |
- |
||||
Brankley et al. (2017) |
382 |
112 (29.3) |
109 |
(28.5) |
102 |
(26.7) |
59 |
(15.4) |
|||||||
Indigenous |
36 |
22 (61.1) |
7 |
(19.4) |
1 |
(2.8) |
6 |
(16.7) |
|||||||
White |
346 |
90 (26.0) |
102 |
(29.5) |
101 |
(29.2) |
53 |
(15.3) |
|||||||
Lee et al. (2018) |
321 |
72 |
(22.4) |
107 |
(33.3) |
140 |
(43.6) |
0 |
(0.0) |
2 |
(0.6) |
||||
Indigenous |
105 |
19 |
(18.1) |
66 |
(62.9) |
20 |
(19.0) |
0 |
(0.0) |
0 |
(0.0) |
||||
White |
216 |
53 |
(24.5) |
41 |
(19.0) |
120 |
(55.6) |
0 |
(0.0) |
2 |
(0.9) |
||||
Note. |
|||||||||||||||
Appendix B
Study |
Indigenous |
White |
B Indigenous-White |
95% C.I. |
|---|---|---|---|---|
A fixed 5-year follow-up period |
||||
B02 |
||||
Bonta & Yessine (2005) |
- 1.876 (.954) |
- 3.305 (.863) |
1.43 |
[- 1.09, 3.95] |
Haag (2005) |
- 1.384 (.551) |
- 2.343 (.392) |
0.96 |
[- 0.37, 2.28] |
Olver et al. (2018) |
- 2.393 (.265) |
- 2.889 (.212) |
0.50 |
[- 0.17, 1.16] |
Brankley et al. (2017) |
- 2.366 (.991) |
- 3.047 (.366) |
0.68 |
[- 1.39, 2.75] |
Lee et al. (2018) |
- 2.030 (.623) |
- 2.539 (.401) |
0.51 |
[- 0.94, 1.96] |
B1 |
||||
Bonta & Yessine (2005) |
.162 (.234) |
.442 (.188) |
- 0.28 |
[- 0.87, 0.31] |
Haag (2005) |
.187 (.181) |
.324 (.106) |
- 0.14 |
[- 0.55, 0.27] |
Olver et al. (2018) |
.201 (.067) |
.287 (.054) |
- 0.09 |
[- 0.25, 0.08] |
Brankley et al. (2017) |
.114 (.283) |
.340 (.089) |
- 0.23 |
[- 0.81, 0.36] |
Lee et al. (2018) |
.168 (.148) |
.279 (.092) |
- 0.11 |
[- 0.45, 0.23] |
A fixed 10-year follow-up period |
||||
B02 |
||||
Olver et al. (2018) |
- 2.001 (.276) |
- 2.149 (.228) |
0.15 |
[- 0.55, 0.85] |
Brankley et al. (2017) |
- 1.736 (.783) |
- 2.437 (.292) |
0.70 |
[- 0.94, 2.34] |
Lee et al. (2018) |
- 2.195 (.756) |
- 2.070 (.406) |
- 0.13 |
[- 1.81, 1.56] |
B1 |
||||
Olver et al. (2018) |
.274 (.071) |
.326 (.059) |
- 0.05 |
[- 0.23, 0.13] |
Brankley et al. (2017) |
.126 (.226) |
.407 (.075) |
- 0.28 |
[- 0.74, 0.18] |
Lee et al. (2018) |
.342 (.175) |
.298 (.099) |
0.04 |
[- 0.35, 0.44] |
Appendix C
Study |
Indigenous |
White |
B Indigenous-White |
95% C.I. |
|---|---|---|---|---|
A fixed 5-year follow-up period |
||||
B03 |
||||
Haag (2005) |
- 1.212 (.600) |
- 2.506 (.427) |
1.29 |
[- 0.15, 2.73] |
Brankley et al. (2017) |
- 2.540 (1.124) |
- 3.200 (.407) |
0.66 |
[- 1.68, 3.00] |
Lee et al. (2018) |
- 1.768 (.563) |
- 2.561 (.410) |
0.79 |
[0.57, 2.16] |
B1 |
||||
Haag (2005) |
.092 (.171) |
.313 (.100) |
- 0.22 |
[- 0.61, 0.17] |
Brankley et al. (2017) |
.142 (.268) |
.314 (.085) |
- 0.17 |
[- 0.72, 0.38] |
Lee et al. (2018) |
.093 (.132) |
.248 (.085) |
- 0.15 |
[- 0.46, 0.15] |
A fixed 10-year follow-up period |
||||
B03 |
||||
Brankley et al. (2017) |
- 2.437 (.997) |
- 2.686 (.332) |
0.25 |
[-1.81, 2.31] |
Lee et al. (2018) |
- 1.560 (.591) |
- 2.040 (.406) |
0.48 |
[- 0.93, 1.89] |
B1 |
||||
Brankley et al. (2017) |
.293 (.229) |
.391 (.072) |
- 0.10 |
[- 0.57, 0.37] |
Lee et al. (2018) |
.178 (.137) |
.258 (.088) |
- 0.08 |
[- 0.40, 0.24] |
Note. Numbers in bold indicate statistical significance (i.e., p < 0.05). |
||||
Endnotes
- 1
For an overview of the Ewert case, see a special issue published in the Journal of Threat Assessment and Management [2016; Vol. 3, No. 2].
- 2
First Nations and Inuit peoples were the original inhabitants of the land that is now Canada. Métis is a group of people with mixed European and First Nations ancestry. In the general population, First Nations are the largest subgroup (60%) of the Indigenous peoples in Canada, followed by Métis (35%) and Inuit (4%).
- 3
Category "B" offences are defined as 1) sexual behaviour that is illegal but the parties are consenting or no specific victims is involved or 2) indecency without a sexual motive.
- 4
The correctional intervention could be most effective when delivering in a manner suited to the offender's culture and learning style (Andrews & Bonta, 2010).
- Date modified: