2022 Corrections and Conditional Release Statistical Overview
Products

2022 Corrections and Conditional Release Statistical Overview (HTML)
2022 Corrections and Conditional Release Statistical Overview PDF Version
Reading the 2022 Corrections and Conditional Release Statistical Overview (HTML)
Reading the 2022 Corrections and Conditional Release Statistical Overview PDF Version
Table of contents
- Preface
- Contributing Partners
- Section A: Crime and the Criminal Justice System
- Police-reported crime rate
- Police-reported crime rate by province/territory
- Police-reported violent victimization: 5-year trend
- Police-reported violent victimization of sexual and non-sexual violent offences by age: 5-year trend
- Police-reported violent crime by type and gender of victim
- Self-reported victimization rate
- Self-reported violent victimization rate by type, gender, and age
- Self-reported victimization reported to police by crime
- The rate of adults charged
- Criminal Code and other Federal Statute charges among adults
- Decisions in adult criminal court
- Length of adult custodial sentences
- The rate of youth charged
- Criminal Code and other Federal Statute charges among youth
- Youth criminal court sentences: 5-year trend
- Youth criminal court sentences for most serious sentence: 5-year trend
- International incarceration rates
- International incarceration rates: 10-year trend
- Section B: Corrections Administration
- Corrections costs federally and provincially/territorially
- Number of CSC employees by location
- Cost of incarceration in a federal institution: 5-year trend
- The number of Parole Board of Canada employees
- The number of employees in the Office of the Correctional Investigator
- Most common offender complaints to the Office of the Correctional Investigator
- Section C: Federal Offender and Registered Victims Populations
- Offenders under the responsibility of CSC
- Number of registered victims and number of offenders with a registered victim: 5-year trend
- The number of in-custody offenders: 10-year trend
- Number of admissions to CSC facilities
- Warrant of committal admissions to CSC facilities by sex: 10-year trend
- Number of registered victims by gender: 5-year trend
- CSC total offender population by sentence length
- Offences of victimization among registered victims
- Warrant of committal admissions to a CSC facility by age
- Number of registered victims by age
- Warrant of committal admissions to a CSC facility for Indigenous and non-Indigenous offenders by age
- Age distribution of the CSC offender population compared to the age distribution of the overall Canadian adult population
- CSC offender population by self-reported race
- Number of registered victims by race
- CSC offender population by religion
- CSC offenders by Indigenous and non-Indigenous self-identification
- Offenders in custody at a CSC facility by security risk classification
- Admissions to federal jurisdiction with a life and/or indeterminate sentence*: 10-year trend
- Proportion of offenders with life and/or indeterminate sentences
- Percentage of total offender population serving a sentence for a violent offence
- Indigenous offenders under the responsibility of CSC
- Number of authorizations for transfer to Structured Intervention Units in federal institutions
- Percentage of successful transfers out of Structured Intervention Units in federal institutions
- Number of offender deaths while in custody: 10-year trend
- The number of escapees from federal institutions: 10-year trend
- CSC offenders in community under supervision: 10-year trend
- Offenders under provincial/territorial supervision on probation or conditional sentence: 10-year trend
- Population of offenders on provincial parole: 10-year trend
- Section D: Conditional Release
- Number of CSC offenders granted temporary absences: 10-year trend
- Offenders released from federal institutions including Healing Lodges on parole: 10-year trend
- Federal day and full parole grant rates: 10-year trend
- Federal day and full parole grant rates by Indigenous and non-Indigenous offenders: 10-year trend
- Number of federal Elder-Assisted parole hearings: 10-year trend
- Proportion of sentence served prior to being released on parole: 10-year trend
- Proportion of sentence served prior to being released on parole by Indigenous and non-Indigenous offenders: 10-year trend
- Outcome of federal day parole supervision periods
- Outcome of federal full parole supervision periods
- Offenders released from federal institutions including Healing Lodges on statutory release: 10-year trend
- Outcome of federal statutory release supervision periods
- Rates of violent offence convictions for offenders on federal conditional release: 10-year trend
- Section E: Special Applications of Criminal Justice
- Section F: Federal Services to Registered Victims
- Number of contacts with registered victims: 5-year trend
- Number of victim statements received for consideration in release decisions: 5-year trend
- Requests for financial assistance to attend parole hearings: 5-year trend
- Number of Parole Board of Canada contacts with victims: 10-year trend
- Victim presentations at PBC Hearings: 10-year trend
- Number of requests made by victims to access the PBC decision registry: 10-year trend
- Number of decisions sent from PBC decision registry
Preface
The Corrections and Conditional Release Statistical Overview (CCRSO) has been published annually since 1998. The purpose of the CCRSO is to assist the public in understanding statistical information on corrections and conditional release. A primary consideration in producing the CCRSO was to present general statistical information in a user-friendly way that will facilitate understanding by a broad audience. There are several features of this document that make it different from typical statistical reports:
- The visual representation of the statistics is simple and uncluttered, and under each chart, a few key points assist the reader in extracting information from the chart.
- For each chart, a table of numbers corresponds to the visual representation. In some instances, the table includes additional numbers, (e.g., a 5-year series), even though the chart depicts the data for the most recent year (e.g., Figure A2).
The data used in the CCRSO reflects the most recent data available at the time of publication. For much of the report, data are available from the 2022 calendar year or for the April 1, 2021 - March 31, 2022 fiscal year. For some data, there is a lag in reporting and as such, the most recent data available are from 2021 (or April 1, 2020 - March 31, 2021). There are a few figures for which the cycle of data collection is more infrequent – for example, the General Social Survey on Canadians’ Safety (Victimization) is administered on a 5-year cycle with the most recent available data being from 2019.
Considering much of the data reported for 2020-21 was collected during the COVID-19 pandemic, the report provides an important snapshot of how the pandemic has impacted the criminal justice system. Therefore, some data trends observed between 2019-20 and 2020-21 should be interpreted with caution. The impacts of the COVID-19 pandemic may also be reflected in the data reported for 2021-22.
The CCRSO includes data from partners that have different measures and methods for assessing gender and sex, and use different labels for these terms. For consistency across reporting, in the CCRSO, when sex was measured, the terms Male, Female, and Another sex were used; when gender was measured, the terms Men and Women and Boys and Girls were used.
In addition, some data that was previously labelled as measuring ethnicity has been changed to race in the current CCRSO to more accurately reflect the identity concepts used by partners. As work in measuring racialized groups advances, these terms and identity concepts may change in future years.
Considering the different types of crime statistics and terminology presented in the CCRSO, a certain level of data literacy is essential for accurate interpretation of the data. For example, some figures and tables in the CCRSO display frequencies, while others display rates; frequency and rate data answer different questions and inform responses to crime in different ways. To optimize the public’s ability to form an accurate, informed, and critical interpretation of different crime statistics and terminology presented in the CCRSO, a data literacy focused companion product is available on [website].
To continually improve this annual publication, we welcome your comments. Any correspondence regarding this report, including permission to use tables and figures should be directed to PS.CPBResearch-RechercheSPC.SP@ps-sp.gc.ca.
Contributing Partners
Public Safety Canada
Public Safety Canada (PS) is Canada’s lead federal department for public safety, which includes emergency management, national security and community safety. Its many responsibilities include developing legislation and policies that govern corrections, implementing innovative approaches to community justice, and providing research expertise and resources to the corrections community.
Correctional Service Canada
The Correctional Service of Canada (CSC) is the federal government department responsible for administering custodial sentences of a term of 2 years or more, as imposed by the courts. CSC is responsible for managing institutions of various security levels and supervising offenders under conditional release in the community.
Parole Board of Canada
The Parole Board of Canada (PBC) is an independent administrative tribunal responsible for making decisions about the timing and conditions of release of offenders into the community on various forms of conditional release. The Board also makes pardon, record suspension and expungement decisions and recommendations respecting clemency through the Royal Prerogative of Mercy.
Office of the Correctional Investigator
The Correctional Investigator is the ombudsperson for federal offenders. The Office of the Correctional Investigator (OCI) conducts investigations into the problems of offenders related to decisions, recommendations, acts or omissions of the Correctional Service of Canada that affect offenders individually or as a group.
Canadian Centre for Justice and Community Safety Statistics (Statistics Canada)
The Canadian Centre for Justice and Community Safety Statistics (CCJCSS) is a division of Statistics Canada. The CCJCSS is the focal point of a federal-provincial-territorial partnership, known as the National Justice Statistics Initiative, for the collection of information on the nature and extent of crime and the administration of civil and criminal justice in Canada.
Section A: Crime and the Criminal Justice System
Police-reported crime rate
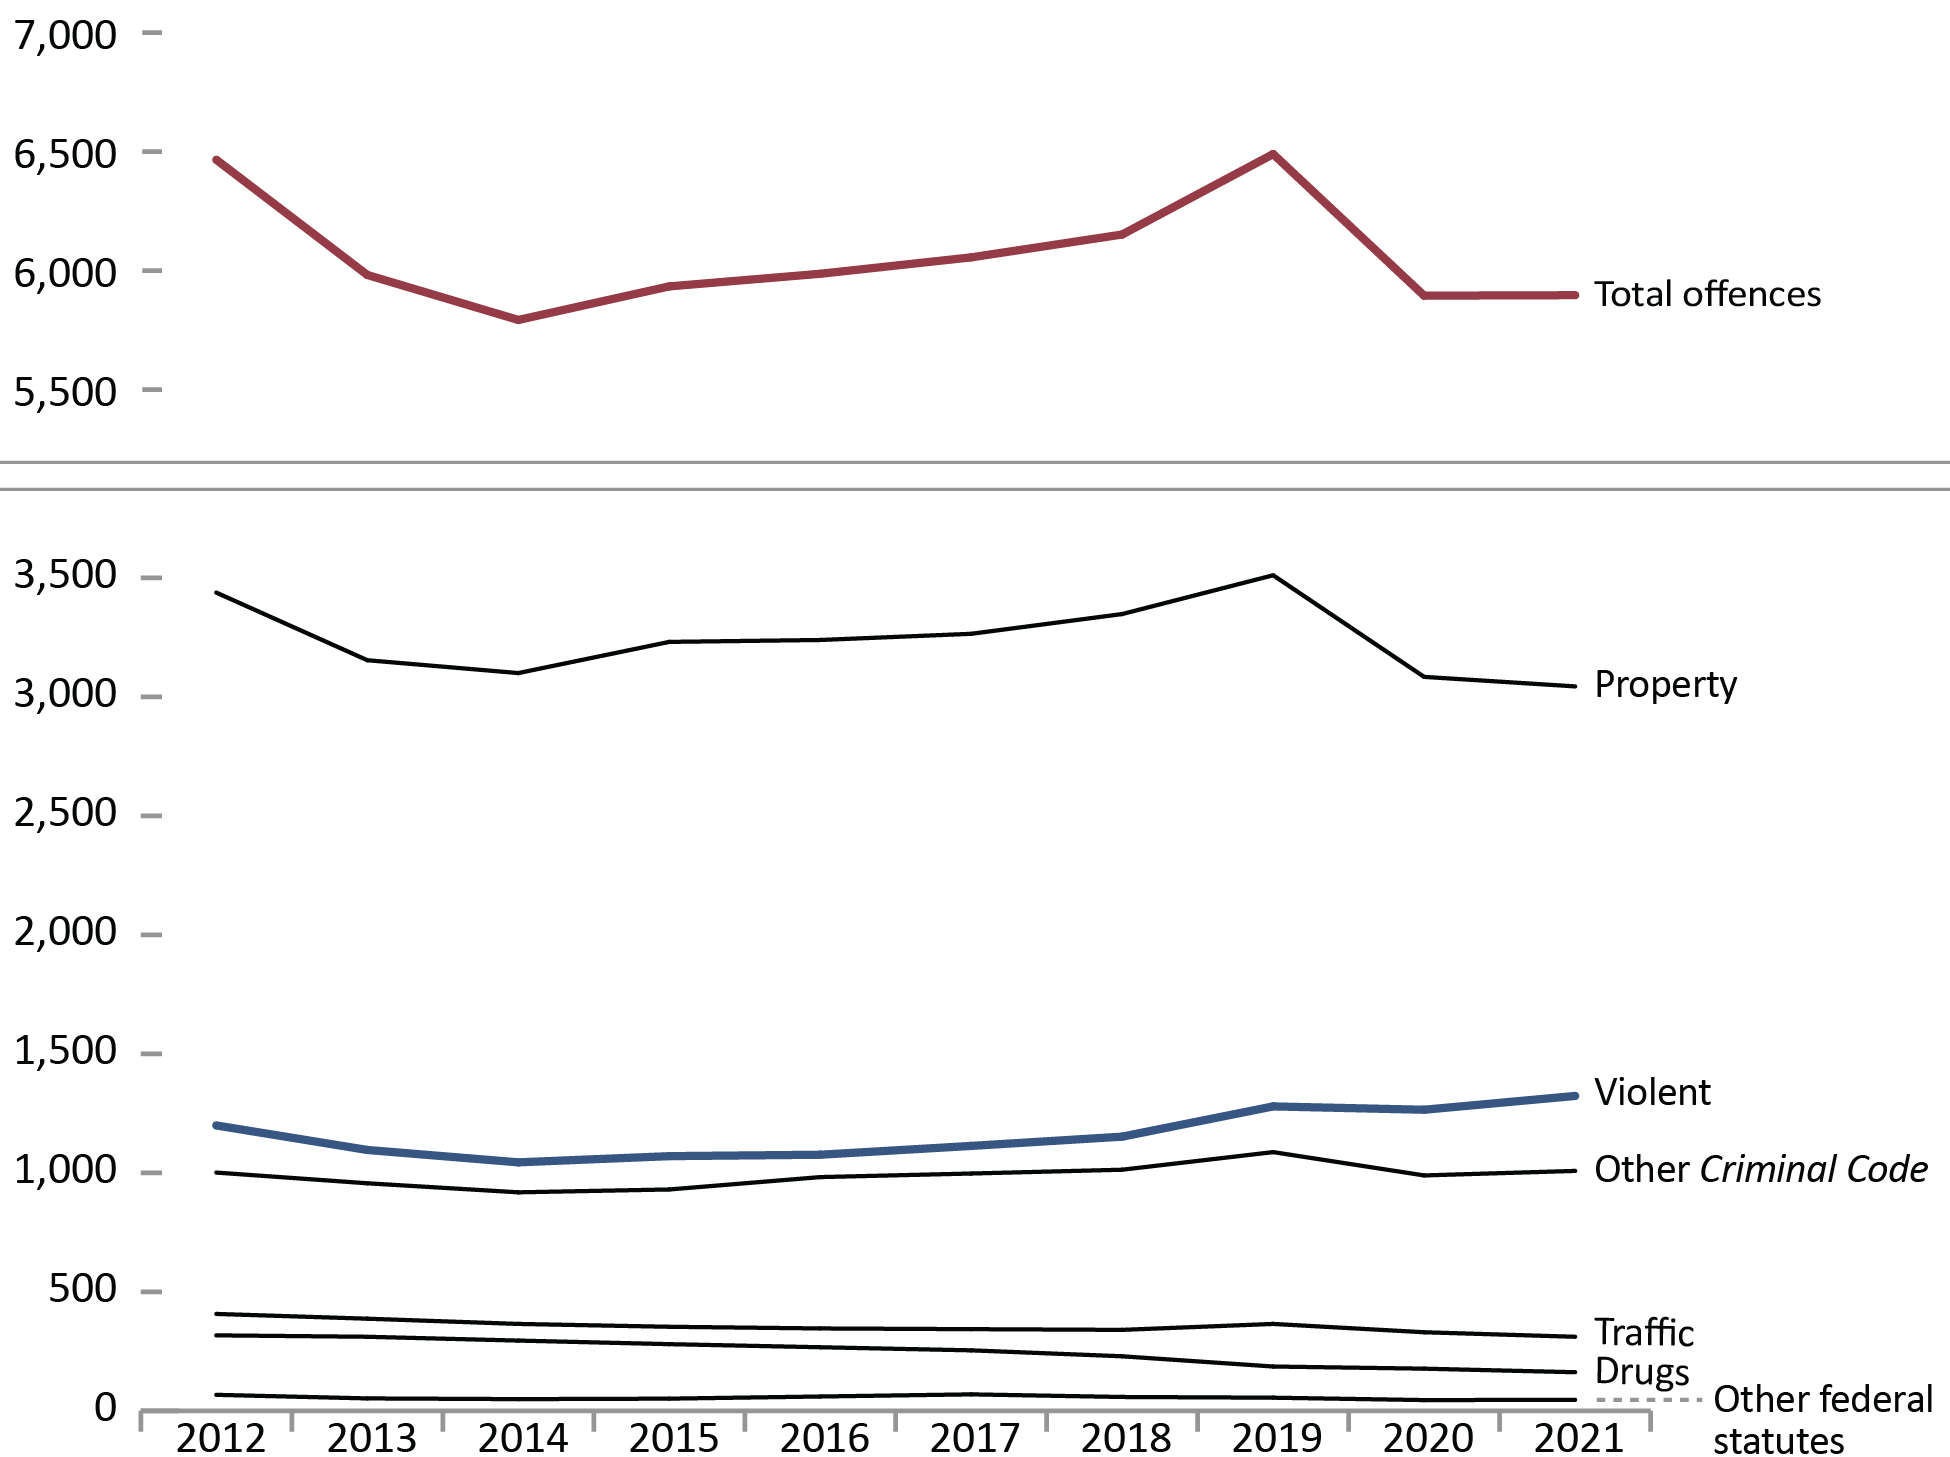
Image description
Line graph showing the police-reported crime rate by type, per 100,000 population, between calendar year 2012 and 2021. The total offence rate decreased from 6,466 per 100,000 population in 2012 to 5,793 in 2014, then steadily increased to a peak of 6,490 in 2019, before decreasing back down to 5,897 in 2021. Excluding the total offence rate, the property crime rate was the highest, by far, decreasing from 3,483 in 2012 to 3,100 in 2014, then gradually increasing to a peak of 3,511 in 2019, before decreasing back down to 3,044 in 2021. The violent crime rate was the second highest, which maintained a relatively stable rate of about 1,100 between 2012 and 2018, then gradually increasing to a peak of 1,323 in 2021. This was followed by the other Criminal Code rate, which hovered around 1,000 between 2012 and 2021. The traffic rate decreased gradually over time, from 407 in 2012 to 311 in 2021. The drug rate decreased steadily over time, from 317 in 2012 to 162 in 2021. Other federal statutes was the lowest rate and was relatively stable over time, from 67 in 2012 to 46 in 2021. Full data are available immediately below.
Source: Table 35-10-0177-01, Incident-based crime statistics, by detailed violations, Canada, provinces, territories and Census Metropolitan Areas
- The police-reported crime rate decreased 2.7% from 2017 to 2020 and then remained stable from 2020 to 2021.
- The only type of offence that meaningfully increased from 2017 to 2021 was violent crime (18.9%).
- Most crime types declined from 2020 to 2021, with property crime showing the smallest decrease (1.3%) and drug-related crime showing the largest decrease (8.5%).
Figure A1 Notes
Other Criminal Code offences (Other CC) includes administration of justice violations, weapons/firearms violations, counterfeit, possession of, accessing, making or distribution of child pornography and prostitution.
Other federal statute offences refer to offences against Canadian federal statutes, such as Customs Act, Employment Insurance Act, Firearms Act, Food and Drugs Act (FDA), Income Tax Act, Controlled Drugs and Substances Act (CDSA) and Narcotic Control Act (NCA). This offence category excludes Criminal Code of Canada offences.
The total crime rate in the Corrections and Conditional Release Statistical Overview includes traffic offences and violations of federal statutes to provide a measure of all criminal offences. As a result, the Total Crime Rate reported here is higher than the crime rate reported by Statistics Canada.
These crime statistics are based on crimes that are reported to the police. Since not all crimes are reported to the police, these figures underestimate actual crime. See A6 to A8 for self-reported rates based on General Social Survey on Canadians’ Safety surveys (victimization), an alternative method of measuring crime.
| Year | Violent | Property | Traffic | Other CC | Drugs | Other fed. statutes | Total charged |
|---|---|---|---|---|---|---|---|
| 1998 | 1,345 | 5,696 | 469 | 1,051 | 235 | 40 | 8,915 |
| 1999 | 1,440 | 5,345 | 388 | 910 | 264 | 44 | 8,474 |
| 2000 | 1,494 | 5,189 | 370 | 924 | 287 | 43 | 8,376 |
| 2001 | 1,473 | 5,124 | 393 | 989 | 288 | 62 | 8,390 |
| 2002 | 1,441 | 5,080 | 379 | 991 | 296 | 54 | 8,315 |
| 2003 | 1,435 | 5,299 | 373 | 1,037 | 274 | 46 | 8,532 |
| 2004 | 1,404 | 5,123 | 379 | 1,072 | 306 | 50 | 8,391 |
| 2005 | 1,389 | 4,884 | 378 | 1,052 | 290 | 60 | 8,090 |
| 2006 | 1,387 | 4,809 | 376 | 1,050 | 295 | 57 | 8,004 |
| 2007 | 1,354 | 4,525 | 402 | 1,029 | 308 | 59 | 7,707 |
| 2008 | 1,334 | 4,258 | 437 | 1,039 | 308 | 67 | 7,475 |
| 2009 | 1,322 | 4,122 | 435 | 1,017 | 291 | 57 | 7,281 |
| 2010 | 1,292 | 3,838 | 420 | 1,029 | 321 | 61 | 6,996 |
| 2011 | 1,236 | 3,536 | 424 | 1,008 | 330 | 60 | 6,628 |
| 2012 | 1,199 | 3,438 | 407 | 1,001 | 317 | 67 | 6,466 |
| 2013 | 1,096 | 3,154 | 387 | 956 | 311 | 52 | 5,982 |
| 2014 | 1,044 | 3,100 | 365 | 918 | 295 | 49 | 5,793 |
| 2015 | 1,070 | 3,231 | 353 | 930 | 280 | 51 | 5,934 |
| 2016 | 1,076 | 3,239 | 346 | 982 | 267 | 60 | 5,987 |
| 2017 | 1,113 | 3,265 | 343 | 997 | 254 | 69 | 6,056 |
| 2018 | 1,152 | 3,348 | 340 | 1,013 | 229 | 58 | 6,152 |
| 2019 | 1,279 | 3,511 | 365 | 1,087 | 186 | 55 | 6,490 |
| 2020 | 1,265 | 3,084 | 330 | 989 | 177 | 45 | 5,895 |
| 2021 | 1,323 | 3,044 | 311 | 1,008 | 162 | 46 | 5,897 |
Source: Table 35-10-0177-01, Incident-based crime statistics, by detailed violations, Canada, provinces, territories and Census Metropolitan Areas
Table A1 Notes
Other Criminal Code offences (Other CC) includes administration of justice violations, weapons/firearms violations, counterfeit, possession of, accessing, making or distribution of child pornography and prostitution.
Other federal statute offences refer to offences against Canadian federal statutes, such as Customs Act, Employment Insurance Act, Firearms Act, Food and Drugs Act (FDA), Income Tax Act, Controlled Drugs and Substances Act (CDSA) and Narcotic Control Act (NCA). This offence category excludes Criminal Code of Canada offences.
These crime statistics are based on crimes that are reported to the police. Since not all crimes are reported to the police, these figures underestimate actual crime. See A6 to A8 for self-reported rates based on General Social Survey on Canadians’ Safety surveys (victimization), an alternative method of measuring crime.
Police-reported crime rate by province/territory
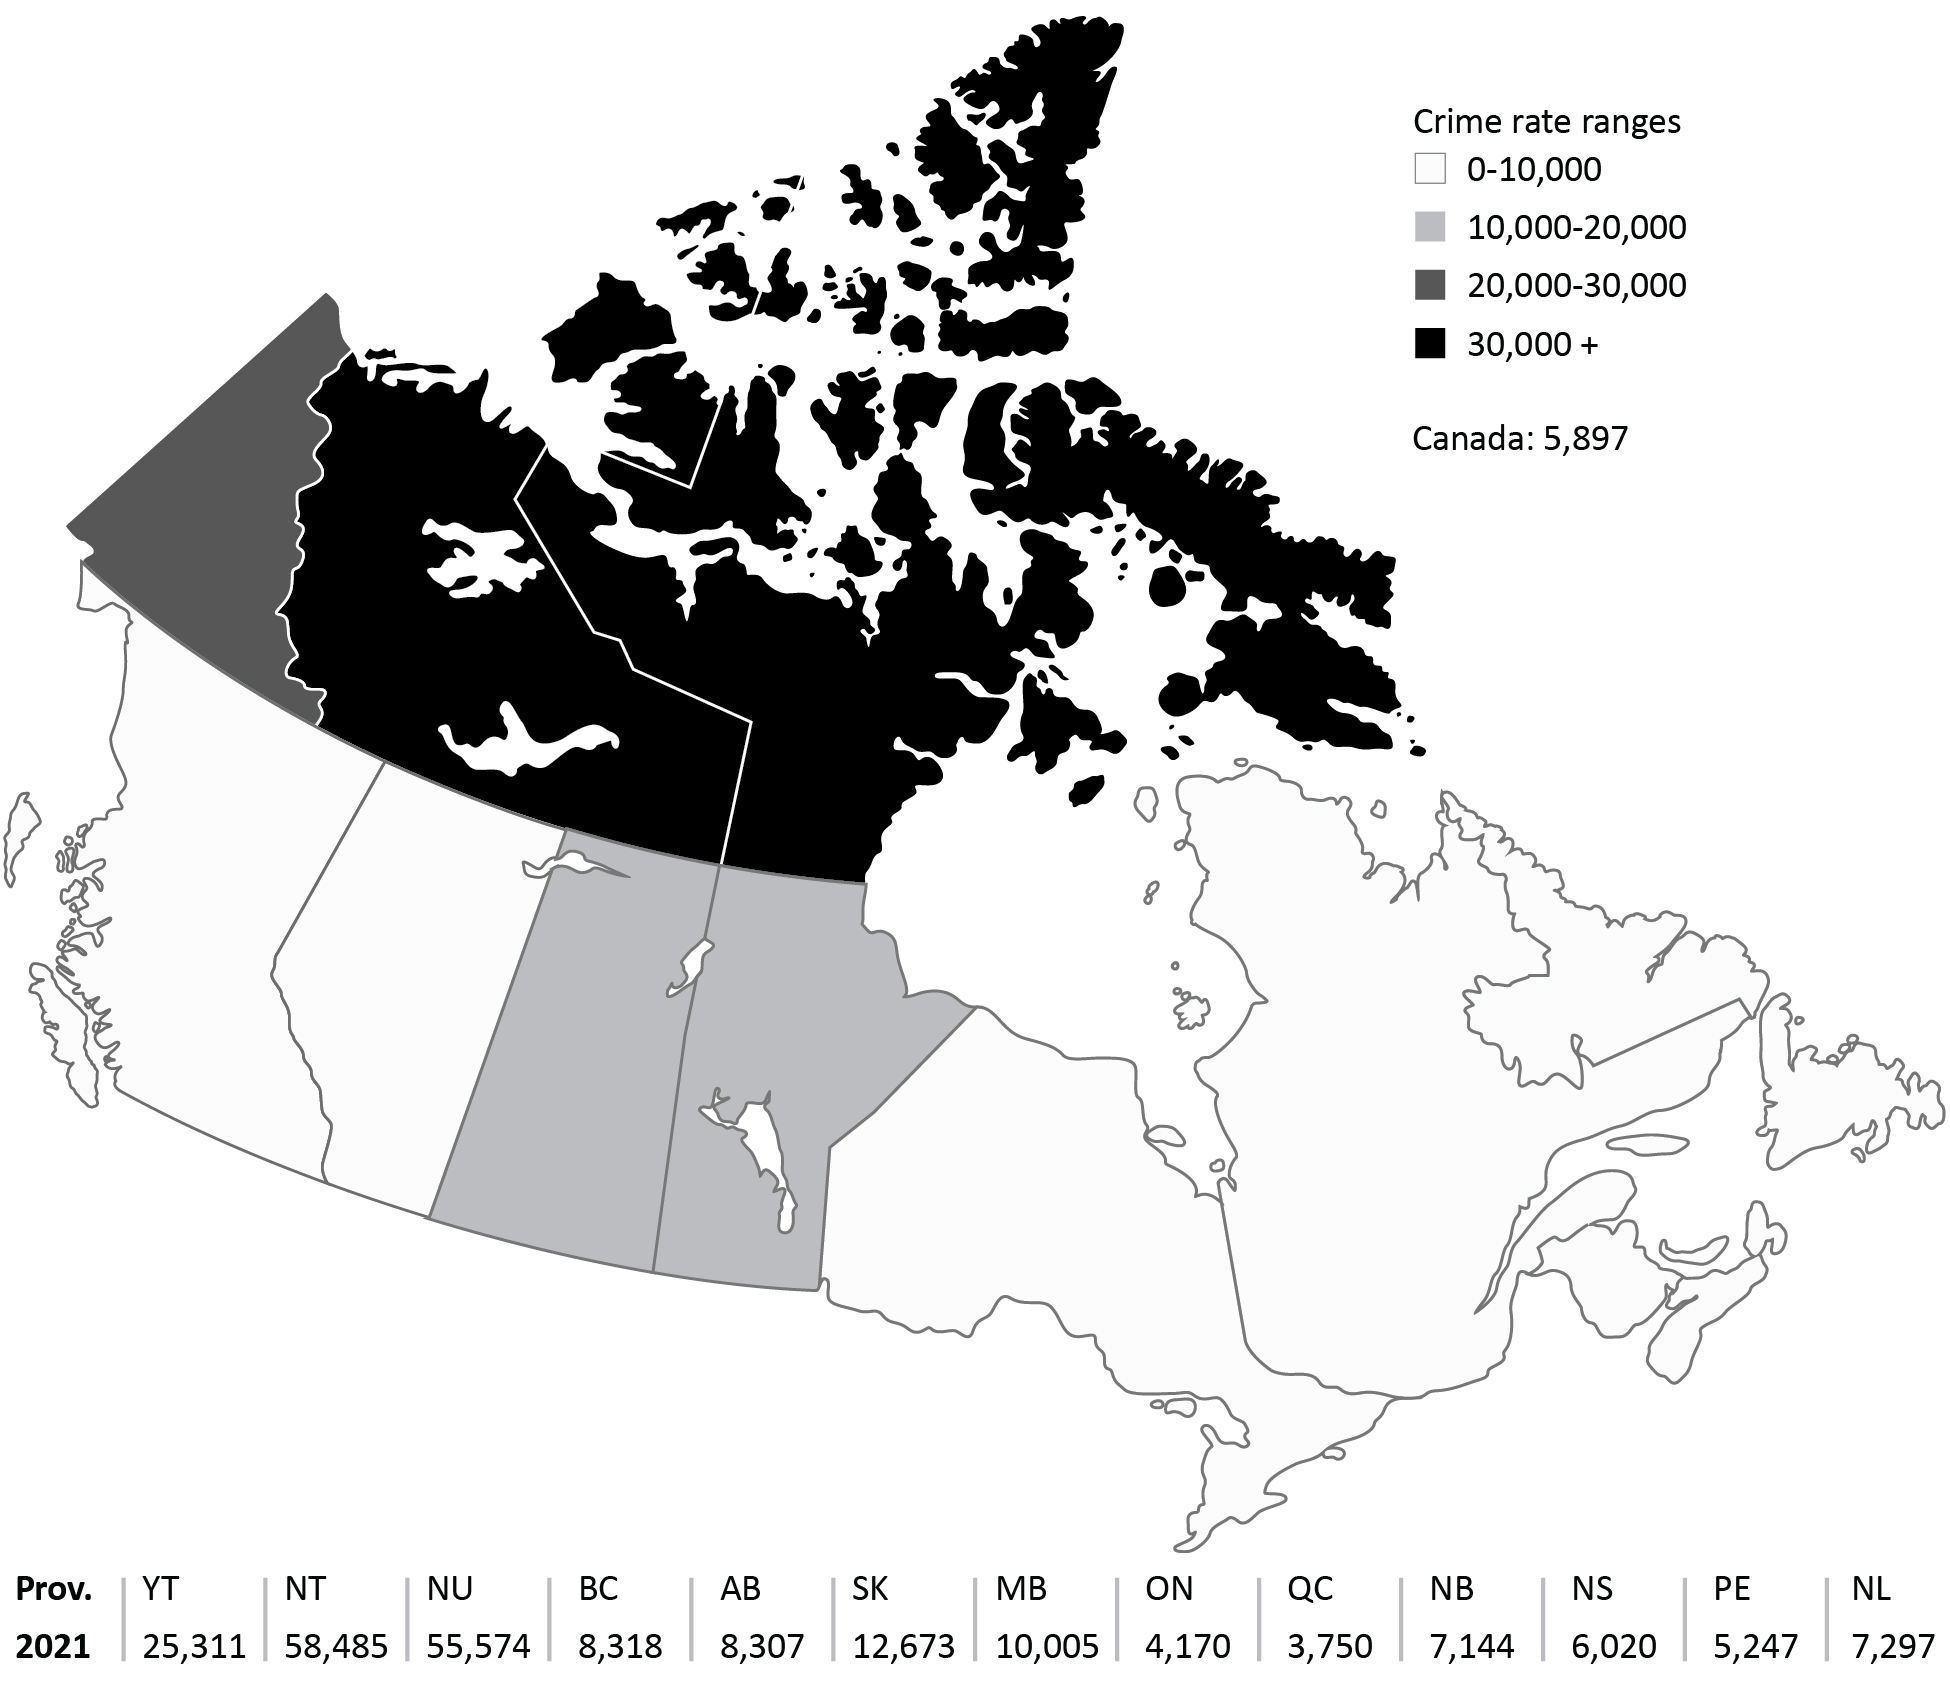
Image description
A map of Canada showing the police-reported crime rate per 100,000 population by province/territory in 2021. The total crime rate in Canada was 5,897 per 100,000 population. Provinces/territories with the lowest rate range (between 0 and 10,000) are shaded in white; these include British Columbia, Alberta, Ontario, Quebec, New Brunswick, Nova Scotia, Prince Edward Island, and Newfoundland. Provinces/territories with a rate range between 10,000 and 20,000 are shaded in light grey; these include Saskatchewan and Manitoba. Provinces/territories with a rate range between 20,000 and 30,000 are shaded in dark grey; which includes the Yukon Territories. Provinces/territories with the highest rate range (above 30,000) are shaded in black – these include Nunavut and the Northwest Territories. Full data are available immediately below.
Source: Table 35-10-0177-01, Incident-based crime statistics, by detailed violations, Canada, provinces, territories and Census Metropolitan Areas
- Crime rates were higher in central Canada and highest in the territories. This general pattern has been stable over time.
- Although the crime rate at a national level decreased then remained stable between 2017 to 2021, the crime rate in most provinces and territories increased over this period. The largest increases were 50.6% and 31.3% in Nunavut and the Northwest Territories, respectively. In contrast, Quebec, Alberta, Saskatchewan, and Ontario experienced a decrease in crime rate over this period.
Figure A2 Notes
These crime statistics are based on crimes that are reported to the police. Since not all crimes are reported to the police, these figures underestimate actual crime. See A6 to A8 for self-reported rates based on General Social Survey on Canadians’ Safety surveys (victimization), an alternative method of measuring crime.
| Province/territory | 2017 | 2018 | 2019 | 2020 | 2021 |
|---|---|---|---|---|---|
Newfoundland & Labrador |
6,042 | 6,042 | 6,687 | 6,769 | 7,297 |
Prince Edward Island |
4,713 | 5,392 | 6,273 | 5,514 | 5,247 |
Nova Scotia |
5,732 | 5,686 | 5,870 | 5,854 | 6,020 |
New Brunswick |
5,753 | 6,056 | 6,750 | 6,779 | 7,144 |
Quebec |
4,330 | 4,165 | 4,065 | 3,596 | 3,750 |
Ontario |
4,259 | 4,509 | 4,544 | 4,039 | 4,170 |
Manitoba |
9,758 | 9,998 | 10,860 | 10,144 | 10,005 |
Saskatchewan |
12,983 | 12,665 | 12,896 | 12,266 | 12,673 |
Alberta |
9,335 | 9,392 | 10,025 | 8,807 | 8,307 |
British Columbia |
8,090 | 8,251 | 9,567 | 8,710 | 8,318 |
Yukon Territories |
22,224 | 21,689 | 26,464 | 25,812 | 25,311 |
Northwest Territories |
44,537 | 45,461 | 55,418 | 60,209 | 58,485 |
Nunavut |
36,912 | 40,094 | 49,186 | 53,945 | 55,574 |
Canada |
6,056 | 6,152 | 6,490 | 5,895 | 5,897 |
Source: Table 35-10-0177-01, Uniform Crime Reporting Survey, Canadian Centre for Justice and Community Safety Statistics, Statistics Canada.
Table A2 Notes
These crime statistics are based on crimes that are reported to the police. Since not all crimes are reported to the police, these figures underestimate actual crime. See A6 to A8 for self-reported rates based on General Social Survey on Canadians’ Safety surveys (victimization), an alternative method of measuring crime.
Police-reported violent victimization: 5-year trend
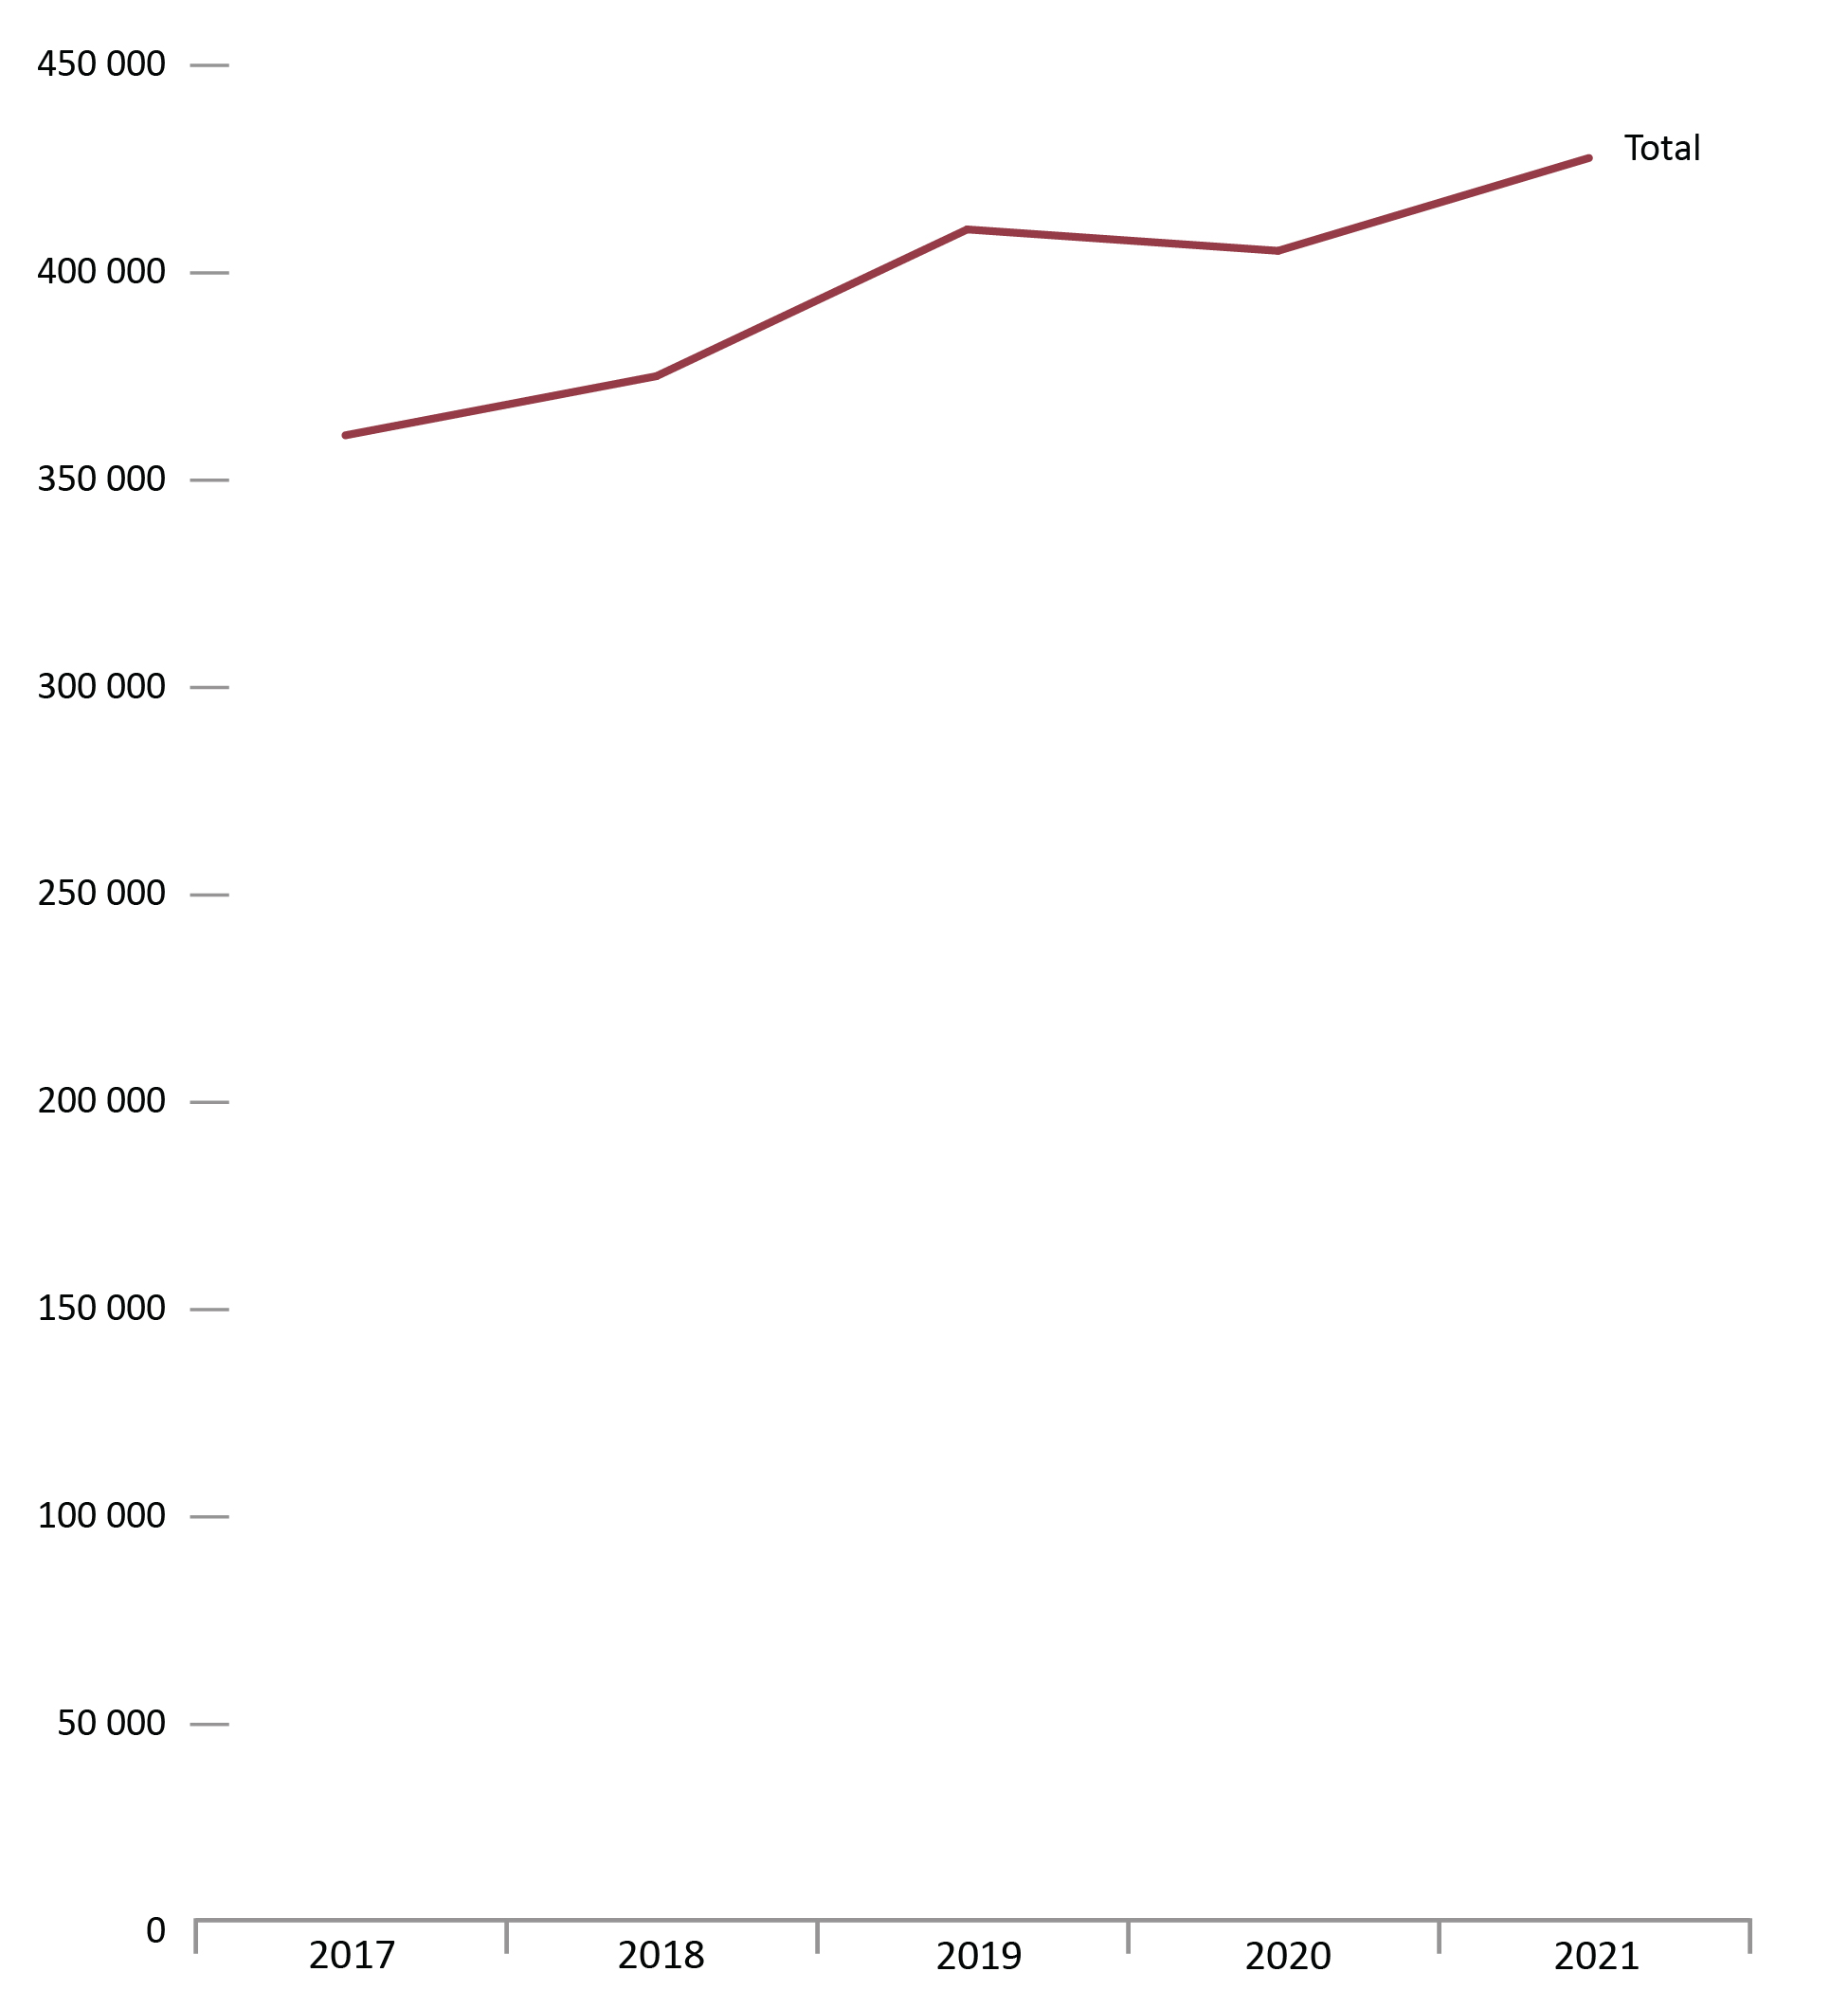
Image description
Line graph showing the total number of police-reported violent victimizations from calendar year 2017 to 2021. The total number of police-reported violent victimizations increased gradually from 356,669 in 2017 to 406,305 in 2019, then dropping slightly to 401,151 in 2020, and increasing again to a peak of 423,531 in 2021. Full data are available immediately below.
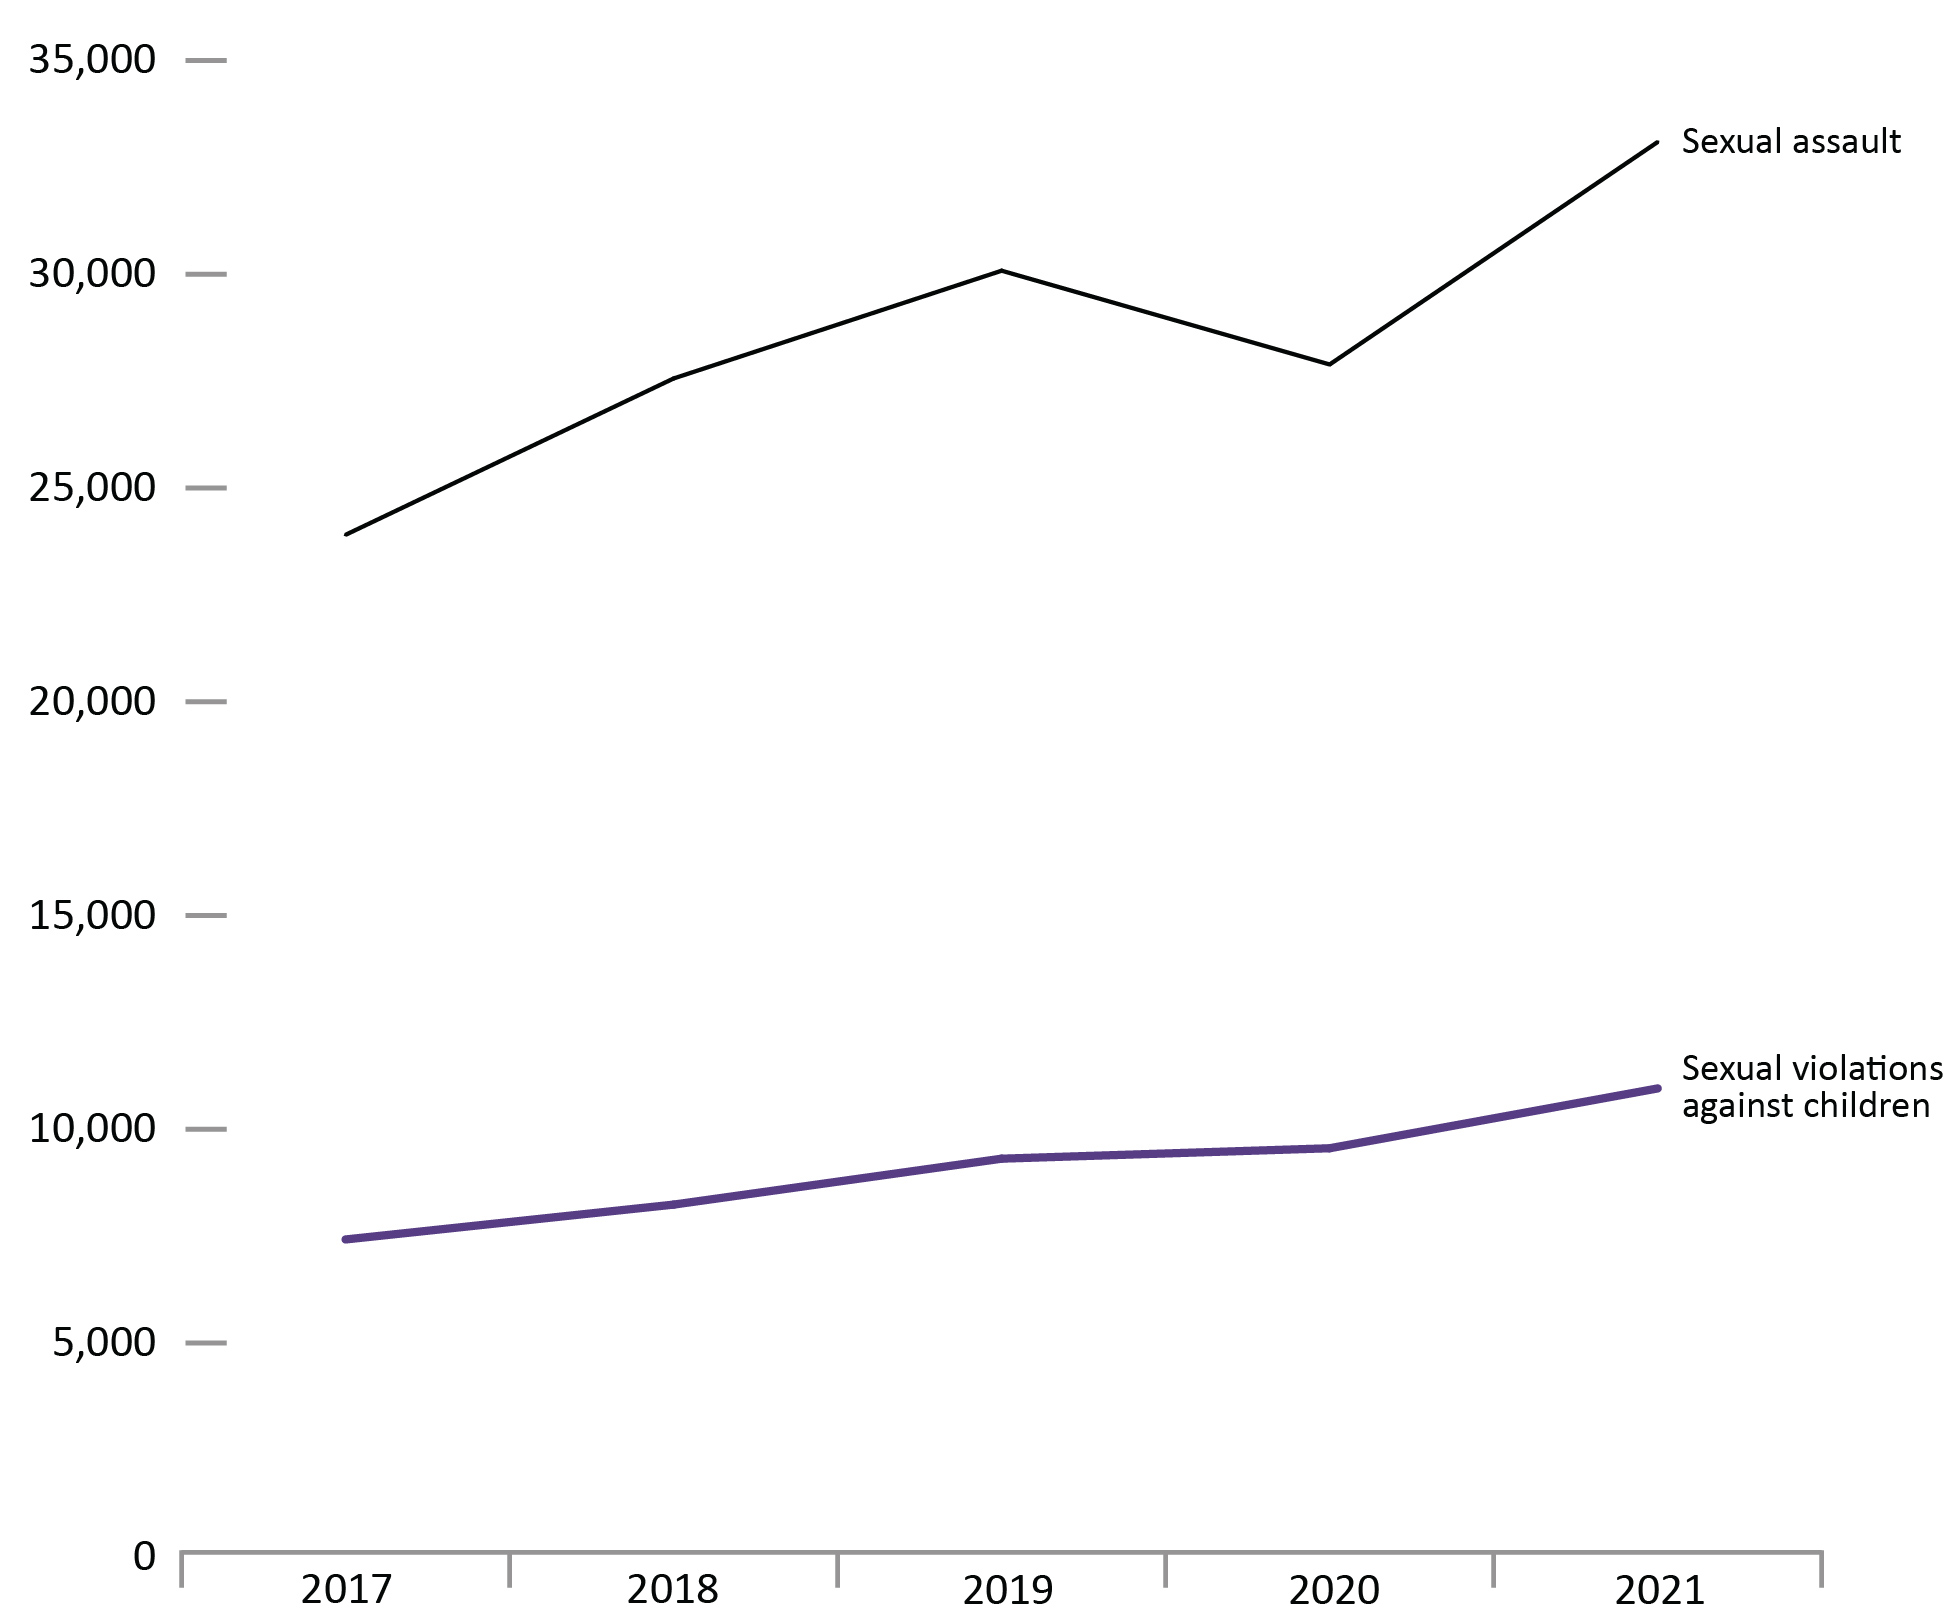
Image description
Line graph showing the number of police-reported violent sexual victimizations from calendar year 2017 to 2021. Sexual assaults increased from 23,905 in 2017 to 30,081 in 2019, then dropping to a low of 27,888 in 2020, and increasing again to a peak of 33,091 in 2021. Sexual violations against children increased from 7,424 in 2017 to 10,956 in 2021. Full data are available immediately below.
Source: Table 35-10-0049-01, Uniform Crime Reporting Survey, Canadian Centre for Justice and Community Safety Statistics, Statistics Canada.
- Police-reported violent victimization increased 12.5% from 2017 to 2020 and then increased 5.6% in the past year (from 2020 to 2021). This pattern was consistent for each type of violent victimization with the exception of Criminal Code traffic violations causing death or bodily harm, which has been on a decline since 2017.
- Police-reported sexual violations against childrenFootnote * increased 28.7% from 2017 to 2020 and then increased 14.6% from 2020 to 2021. This was the largest percentage increase across crime type from 2017 to 2020 and the second largest percentage increase across crime type from 2020 to 2021 (after sexual violations against adults).
- Footnote *
-
Sexual violations against children are a set of Criminal Code violations that specifically concern violations involving child and youth victims. These include violations such as sexual interference, invitation to sexual touching and sexual exploitation, but exclude sexual violations not specific to children.
Figure A3 Notes
Sexual violations against children are a set of Criminal Code violations that specifically concern violations involving child and youth victims. These include violations such as sexual interference, invitation to sexual touching and sexual exploitation, but exclude sexual violations not specific to children.
CC traffic violations causing death or bodily harm include dangerous operation of a motor vehicle, failure to stop and other Criminal Code traffic violations.
These crime statistics are based on crimes that are reported to the police. Since not all crimes are reported to the police, these figures underestimate actual crime. See A6 to A8 for self-reported rates based on General Social Survey on Canadians’ Safety surveys (victimization), an alternative method of measuring crime.
Excludes victims over 89 years of age.
| Type of crime | 2017 | 2018 | 2019 | 2020 | 2021 |
|---|---|---|---|---|---|
Assaults |
225,350 | 234,398 | 259,175 | 255,469 | 266,020 |
Other violent violations |
95,569 | 96,302 | 103,271 | 103,898 | 109,228 |
Sexual assault (levels 1, 2, 3) |
23,905 | 27,561 | 30,081 | 27,888 | 33,091 |
Sexual violations against children |
7,424 | 8,239 | 9,313 | 9,557 | 10,956 |
Criminal Code traffic violations causing death or bodily harm |
2,883 | 2,842 | 2,841 | 2,654 | 2,635 |
Violations causing death and attempted murder |
1,538 | 1,579 | 1,624 | 1,685 | 1,601 |
Total |
356,669 | 370,921 | 406,305 | 401,151 | 423,531 |
Source: Table 35-10-0049-01, Uniform Crime Reporting Survey, Canadian Centre for Justice and Community Safety Statistics, Statistics Canada.
Table A3 Notes
Sexual violations against children are a set of Criminal Code violations that specifically concern violations involving child and youth victims. These include violations such as sexual interference, invitation to sexual touching and sexual exploitation, but exclude sexual violations not specific to children.
CC traffic violations causing death or bodily harm include dangerous operation of a motor vehicle, failure to stop and other Criminal Code traffic violations.
These crime statistics are based on crimes that are reported to the police. Since not all crimes are reported to the police, these figures underestimate actual crime. See A6 to A8 for self-reported rates based on General Social Survey on Canadians’ Safety surveys (victimization), an alternative method of measuring crime.
Excludes victims over 89 years of age.
Police-reported violent victimization of sexual and non-sexual violent offences by age: 5-year trend
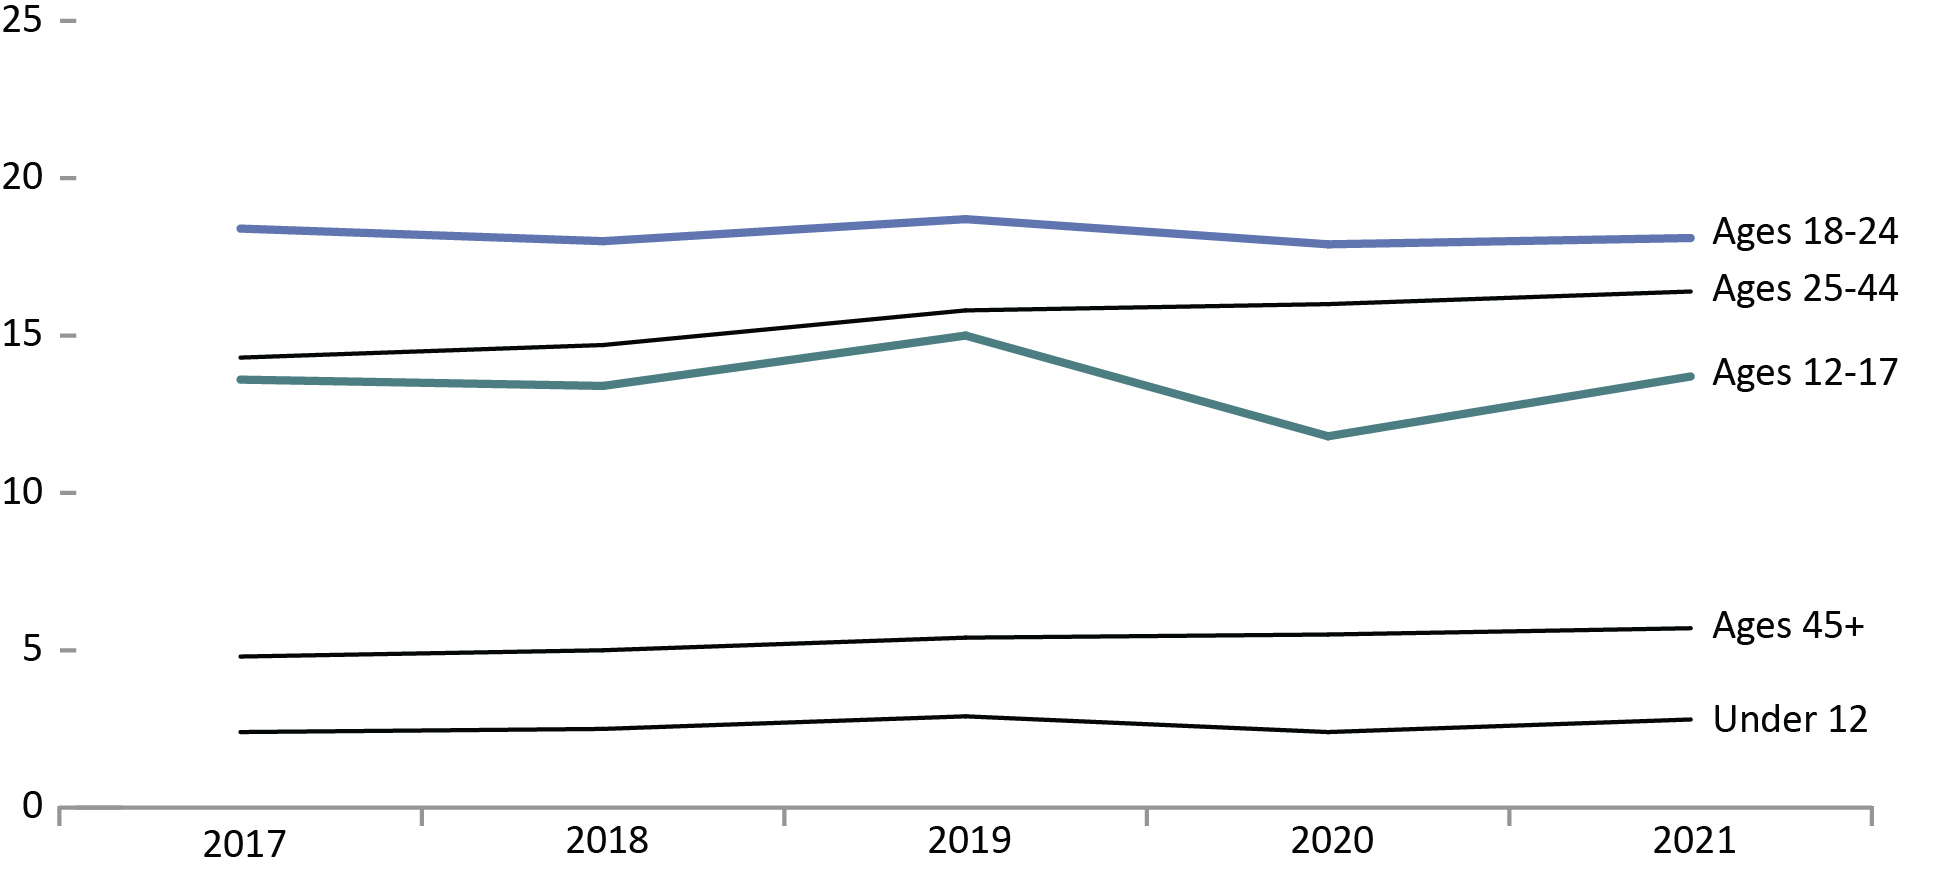
Image description
Line graph showing the police-reported victimization of non-sexual violent offences by age from calendar year 2017 to 2021. Those under 12 years of age and those 45 years of age and over reported the least victimizations, which rose slightly over the 5 year trend. For those 12 to 17 years of age, the trend fluctuated each year with the highest point in 2019, and the lowest in 2020. Ages 25 to 44 had the second highest reported victimizations, a number that rose steadily over time. Ages 18 to 24 reported even more victimizations to police than those aged 25 to 44. While there were fluctuations in the non-sexual violent crime victimizations reported by 18 to 24 year old victims to police, the trend was at its highest point in 2019 and lowest point in 2020. Full data are available immediately below.
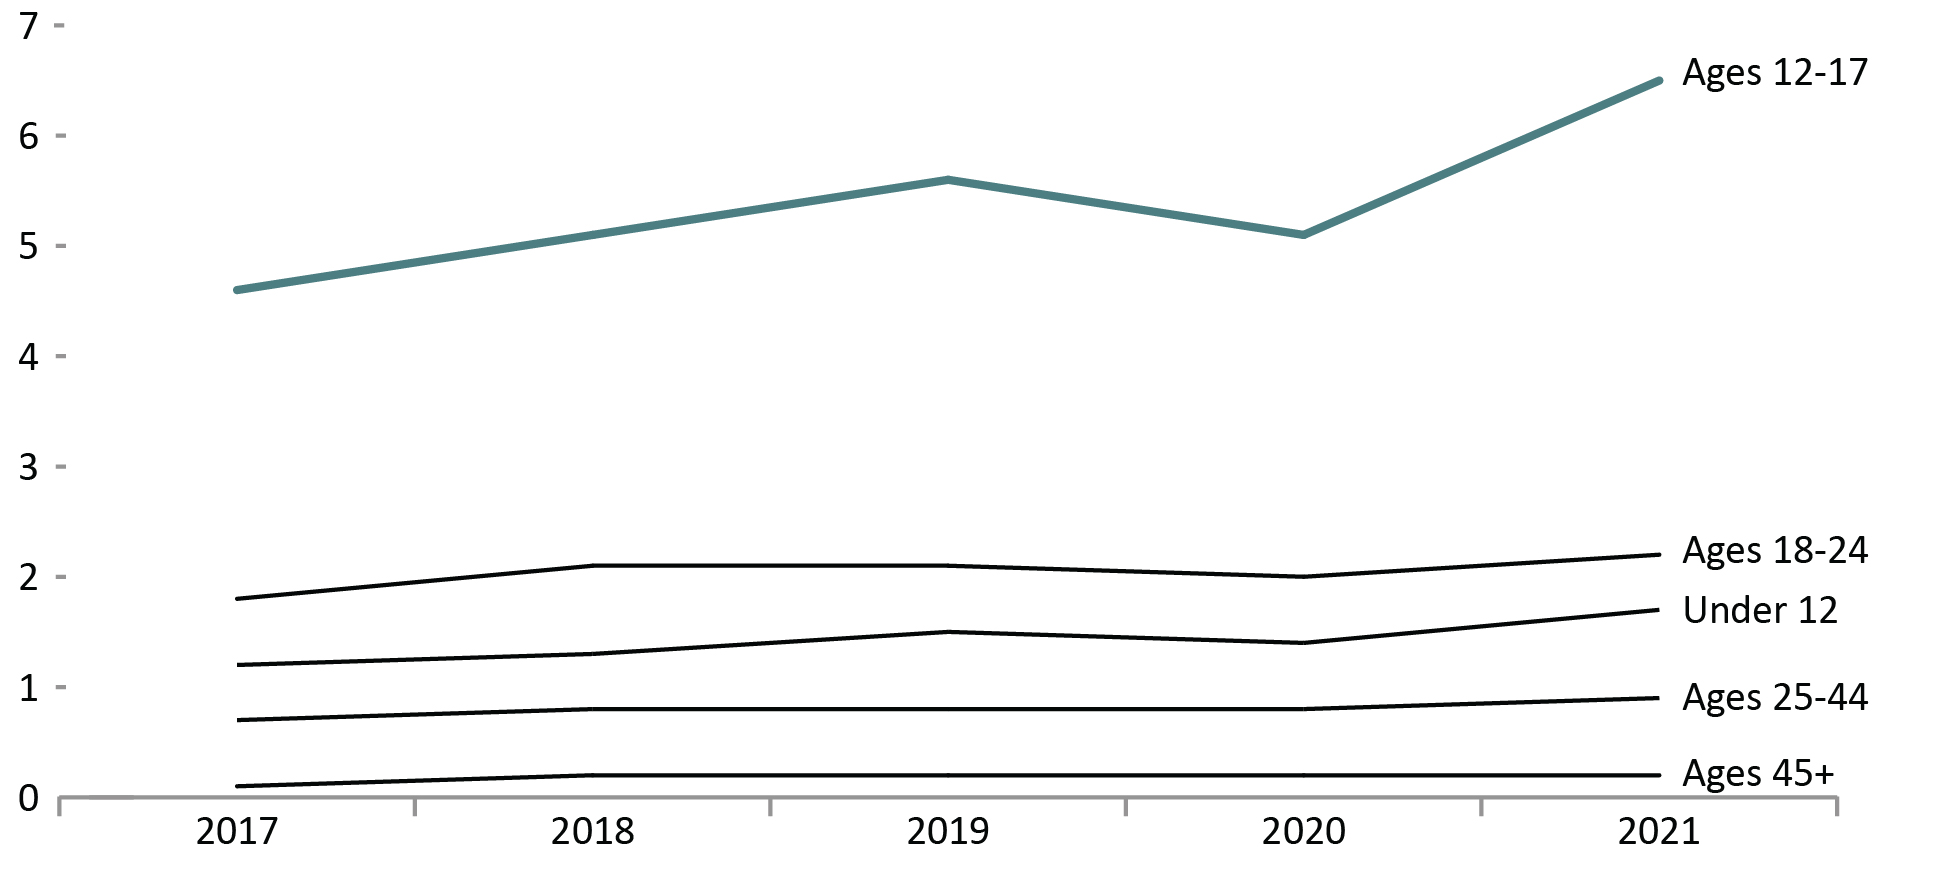
Image description
Line graph showing the police-reported victimization by age from calendar year 2017 to 2021 for violent sexual offences. Those 45 years of age and over, 25 to 44, under 12, and between 18 to 24 years of age, all had relatively consistent trends in reporting this crime type to police over time. For those aged 12 to 17, rates increased steadily from 2017 to 2019, dropped in 2020, then rose to their apex in 2021. Full data are available immediately below.
Source: Uniform Crime Reporting Survey, Canadian Centre for Justice and Community Safety Statistics, Statistics Canada.
- Adults aged 18-24 years had the highest rate of police-reported non-sexual violent victimization across the past 5 years (2017 to 2021).
- Youth aged 12-17 years consistently had the highest rate of police-reported sexual violent victimization in the past 5 years (2017 to 2021).
- The rate of police-reported sexual and non-sexual violent victimization was on an upward trend from 2017 to 2019 among all age groups. Rates then declined during the COVID-19 pandemic from 2019 to 2020, followed by an increase from 2020 to 2021.
- Youth aged 12-17 had the highest increase in both police-reported sexual and non-sexual violent victimization from 2020 to 2021 (26.8% and 15.9% respectively).
Figure A4 Notes
Non-sexual violent offences include 1) violations causing death and attempted murder, 2) assaults, 3) other violent violations (e.g., robbery; criminal harassment; indecent/harassing communications; uttering threats; kidnapping, forcible confinement, abduction or hostage taking; trafficking in persons and prostitution; violent firearm violations; extortion; and other violent violations), and traffic offences causing bodily harm.
Sexual violent offences include 1) sexual assaults, 2) sexual violations against children (e.g., child and youth victims). These include violations such as sexual interference, invitation to sexual touching and sexual exploitation.
Excludes victims over 89 years of age.
Figure A4a and A4b in the 2022 CCRSO reflect the same data as the 2021 CCRSO.
| Year | Under 12 | Age 12 - 17 | Ages 18 - 24 | Ages 25 - 44 | Ages 45 + | ||||||||||
|---|---|---|---|---|---|---|---|---|---|---|---|---|---|---|---|
| Total | Boys | Girls | Total | Boys | Girls | Total | Men | Women | Total | Men | Women | Total | Men | Women | |
| Victimization of non-sexual violent offences | |||||||||||||||
| 2017 | 2.4 | 2.8 | 2.0 | 13.6 | 14.3 | 12.9 | 18.4 | 16.7 | 20.3 | 14.3 | 13.6 | 15.1 | 4.8 | 5.6 | 4.1 |
| 2018 | 2.5 | 2.8 | 2.1 | 13.4 | 13.9 | 12.9 | 18.0 | 16.4 | 19.8 | 14.7 | 13.9 | 15.5 | 5.0 | 5.7 | 4.3 |
| 2019 | 2.9 | 3.3 | 2.4 | 15.0 | 15.6 | 14.3 | 18.7 | 17.3 | 20.3 | 15.8 | 14.9 | 16.7 | 5.4 | 6.2 | 4.6 |
| 2020 | 2.4 | 2.7 | 2.1 | 11.8 | 11.9 | 11.7 | 17.9 | 16.1 | 19.9 | 16.0 | 15.0 | 17.0 | 5.5 | 6.5 | 4.7 |
| 2021 | 2.8 | 3.1 | 2.5 | 13.7 | 13.7 | 13.7 | 18.1 | 16.3 | 20.1 | 16.4 | 15.2 | 17.6 | 5.7 | 6.6 | 4.9 |
| Victimization of sexual violent offences | |||||||||||||||
| 2017 | 1.2 | 0.6 | 1.8 | 4.6 | 0.9 | 8.5 | 1.8 | 0.3 | 3.5 | 0.7 | 0.1 | 1.2 | 0.1 | 0.0 | 0.3 |
| 2018 | 1.3 | 0.6 | 1.9 | 5.1 | 1.0 | 9.3 | 2.1 | 0.3 | 4.0 | 0.8 | 0.1 | 1.5 | 0.2 | 0.0 | 0.3 |
| 2019 | 1.5 | 0.7 | 2.2 | 5.6 | 1.1 | 10.3 | 2.1 | 0.3 | 4.1 | 0.8 | 0.1 | 1.6 | 0.2 | 0.0 | 0.3 |
| 2020 | 1.4 | 0.7 | 2.2 | 5.1 | 1.0 | 9.4 | 2.0 | 0.3 | 3.8 | 0.8 | 0.1 | 1.5 | 0.2 | 0.0 | 0.3 |
| 2021 | 1.7 | 0.7 | 2.7 | 6.5 | 1.2 | 12.0 | 2.2 | 0.3 | 4.2 | 0.9 | 0.2 | 1.7 | 0.2 | 0.0 | 0.3 |
Source: Uniform Crime Reporting Survey, Canadian Centre for Justice and Community Safety Statistics, Statistics Canada.
Table A4 Notes
Non-sexual violent offences include 1) violations causing death and attempted murder, 2) assaults, 3) other violent violations (e.g., robbery; criminal harassment; indecent/harassing communications; uttering threats; kidnapping, forcible confinement, abduction or hostage taking; trafficking in persons and prostitution; violent firearm violations; extortion; and other violent violations), and traffic offences causing bodily harm.
Sexual violent offences include 1) sexual assaults, 2) sexual violations against children (e.g., child and youth victims). These include violations such as sexual interference, invitation to sexual touching and sexual exploitation.
Excludes victims over 89 years of age.
Table A4 in the 2022 CCRSO reflect the same data as the 2021 CCRSO.
Police-reported violent crime by type and gender of victim
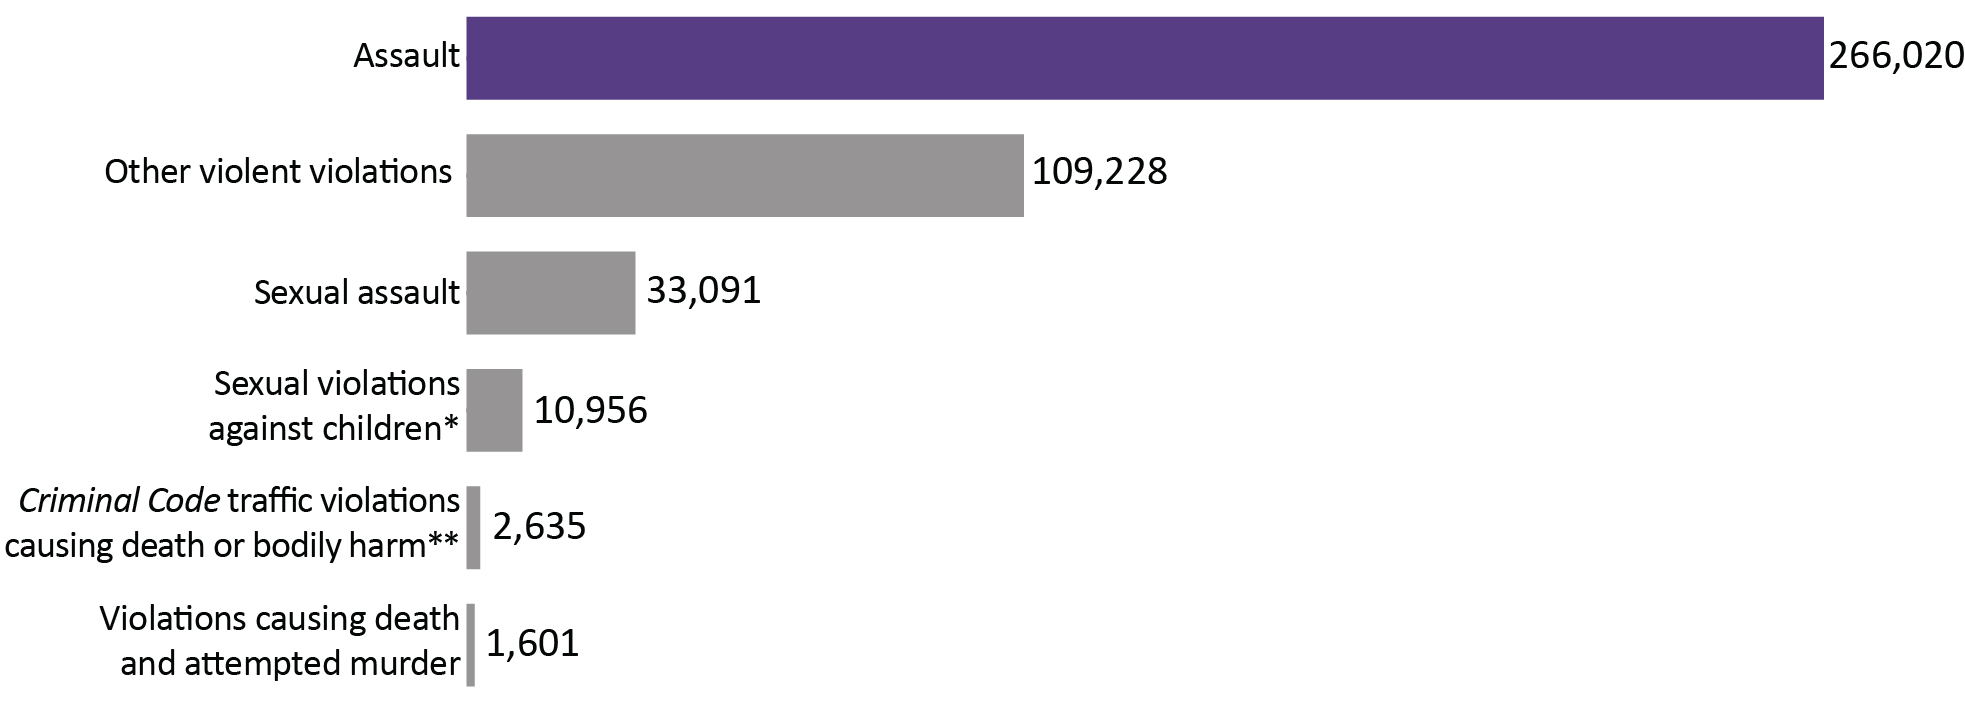
Image description
Bar graph showing the number of victims of police-reported violent crime by type in calendar year 2021. Assault was the most common crime that was reported to police with 266,020; followed by a category called “other violent violations” with 109,228 victims; sexual assault with 33,091 victims; sexual violations against children with 10,956 victims; Criminal Code traffic violations causing death or bodily harm with 2,635 victims; and finally, violations causing death and attempted murder with 1,601 victims. Full data are available immediately below.
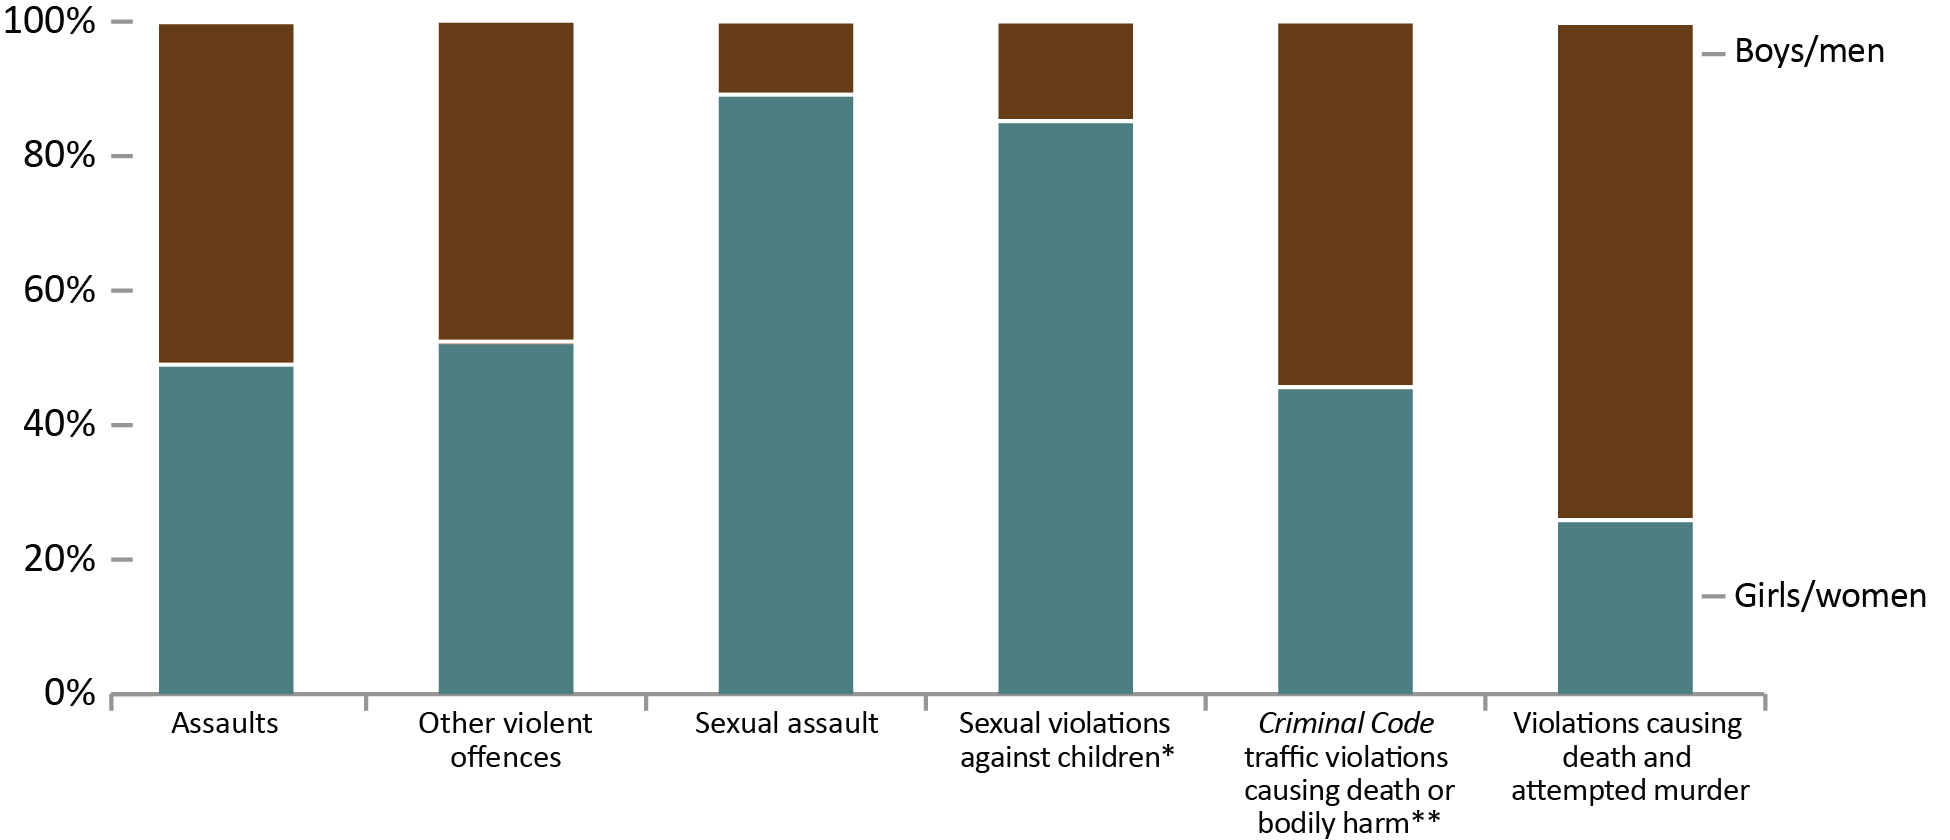
Image description
Bar graph showing the gender of the victims of violent crime whose victimization was reported to the police in calendar year 2021. Assaults, other violent offences, and criminal code traffic violations causing death or bodily harm were all relatively evenly represented by the gender of the victim. Sexual assault and sexual violations against children were mainly perpetrated upon victims that were women or girls (over 80 percent). Victims of violations causing death and attempted murder were primarily boys and men (over 70 percent). Full data are available immediately below.
Source: Table 35-10-0049-01, Uniform Crime Reporting Survey, Canadian Centre for Justice and Community Safety Statistics, Statistics Canada.
- Physical assaults accounted for nearly two-thirds (62.8%) of all police-reported violent crime.
- Girls/women accounted for slightly more than half (53.7%) of all victims of violent crime. Boys/men were more likely to be victims of violations causing death (73.9%) and girls/women were more likely to be victims of sexual assault (89.4%) and sexual violations against children* (84.9%).
Figure A5 Notes
Victims with gender unreported were omitted from Figure A5b. As such, proportions do not add up to 100.
*Sexual violations against children are a set of Criminal Code violations that specifically concern violations involving child and youth victims. These include violations such as sexual interference, invitation to sexual touching and sexual exploitation, but exclude sexual violations not specific to children.
**Criminal Code traffic violations causing death or bodily harm includes dangerous operation of a motor vehicle, failure to stop and other Criminal Code traffic violations.
Excludes victims over 89 years of age.
| Type of crime | Gender of victim | Total | ||||||
|---|---|---|---|---|---|---|---|---|
| Girls and women | Boys and men | Not reported | ||||||
| # | % | # | % | # | % | # | % | |
| Assaults | 130,267 | 49.0 | 134,713 | 50.6 | 1,040 | 0.4 | 266,020 | 62.8 |
| Other violent violations | 56,813 | 52.0 | 52,196 | 47.8 | 219 | 0.2 | 109,228 | 25.8 |
| Sexual assault | 29,591 | 89.4 | 3,398 | 10.3 | 102 | 0.3 | 33,091 | 7.8 |
| Sexual violations against childrenFootnote * | 9,306 | 84.9 | 1,619 | 14.8 | 31 | 0.3 | 10,956 | 2.6 |
| Criminal Code traffic violations causing death or bodily harmFootnote ** | 1,198 | 45.5 | 1,429 | 54.2 | 8 | 0.3 | 2,635 | 0.6 |
| Violations causing death and attempted murder | 410 | 25.6 | 1,183 | 73.9 | 8 | 0.5 | 1,601 | 0.4 |
| Total | 227 585 | 194 583 | 1 408 | 423 531 | ||||
Source: Table 35-10-0049-01, Uniform Crime Reporting Survey, Canadian Centre for Justice and Community Safety Statistics, Statistics Canada
Self-reported victimization rate
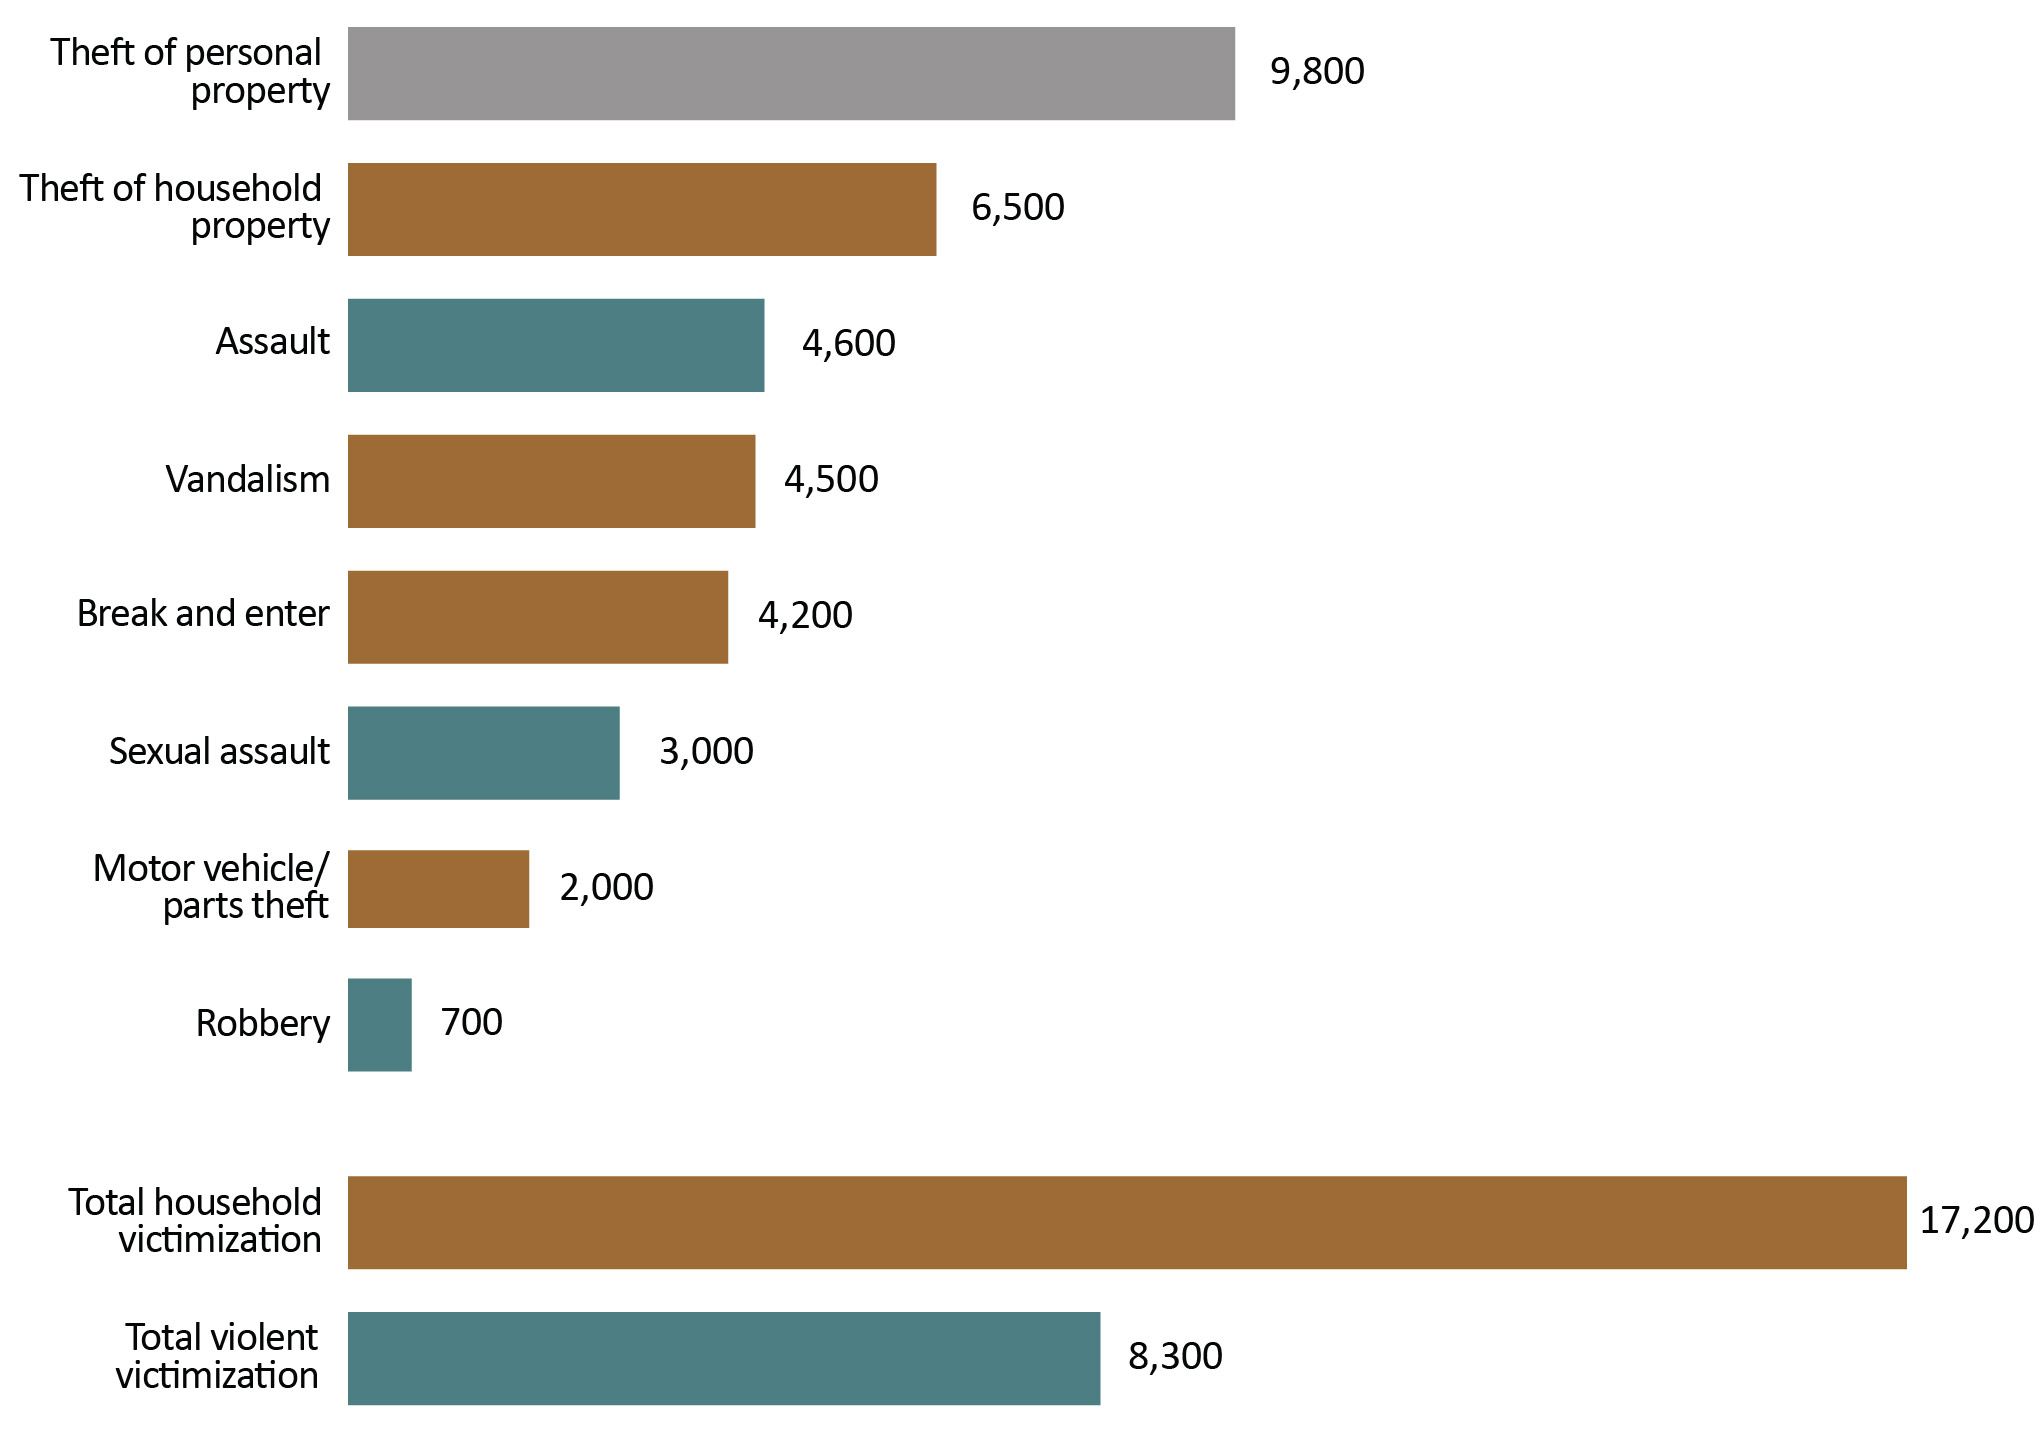
Image description
Bar graph showing the rate of victims of crime per 100,000 population that self-reported an experience of criminal victimization in calendar year 2019. Theft of personal property was the most frequent criminal victimization experienced by the public with 9,800 victims per 100,000 people; followed by theft of household property with 6,500 victims per 100,000 people; assault with 4,600 victims; vandalism with 4,500 victims; break and enter with 4,200 victims; sexual assault with 3,000 victims; motor vehicle or parts theft with 2,000 victims; and robbery with 700 victims. Finally, the composite rates for total household victimization with 17,200 victims and total violent victimization with 8,300 victims. Full data are available immediately below.
Source: General Social Survey (GSS) Canadians’ Safety, Statistics Canada.
- In 2019, theft of personal property was the most common self-reported crime followed by theft of household property.
- Assault was the third most common self-reported crime and the most common violent crime.
Figure A6 Notes
General Social Survey (GSS) Canadians’ Safety data are reported per 1,000 population, which are converted to per 100,000 in the CCRSO for ease of comparison with police reported rates.
Total household victimization includes the following categories contained in the General Social Survey: motor vehicle/parts theft, break and enter, vandalism, theft of household property.
Total violent victimization includes the following categories contained in the General Social Survey: physical assault, sexual assault, and robbery.
The GSS Canadians’ Safety is conducted every 5 years, and the most recent data available is from 2019. The GSS excludes those under age 15.
| Type of violent victimization | Rate |
|---|---|
Theft of personal property |
9,800 |
Theft of household property |
6,500 |
Physical assault |
4,600 |
Vandalism |
4,500 |
Break and enter |
4,200 |
Sexual assault |
3,000 |
Motor vehicle/parts theft |
2,000 |
Robbery |
700 |
Total household victimization |
17,200 |
Total violent victimization |
8,300 |
Source: General Social Survey (GSS) Canadians’ Safety, Statistics Canada.
Table A6 Notes
General Social Survey (GSS) Canadians’ Safety are reported per 1,000 population, which are converted to per 100,000 in the CCRSO for ease of comparison with police-reported rates.
Total household victimization includes the following categories asked in the General Social Survey: motor vehicle/parts theft, break and enter, vandalism, theft of household property.
Total violent victimization includes the following categories asked in the General Social Survey: physical assault, sexual assault, and robbery.
The GSS Canadians’ Safety is conducted every 5 years, and the most recent data available is from 2019. The GSS excludes those under age 15.
Self-reported violent victimization rate by type, gender, and age
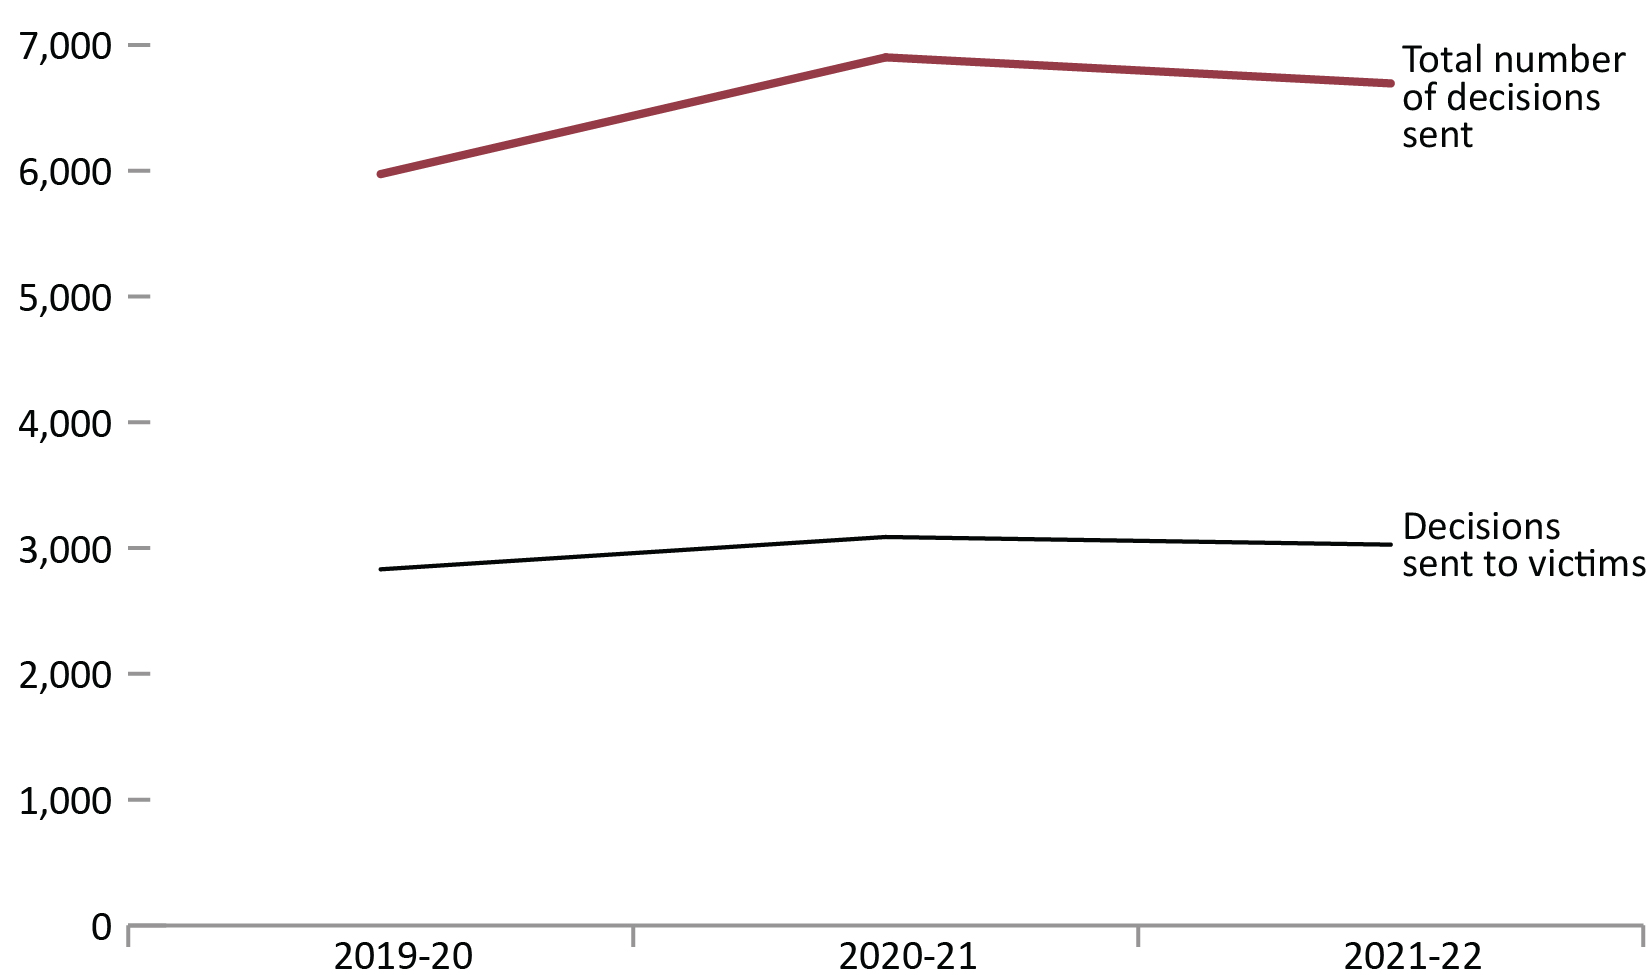
Image description
Bar graph showing the rate of violent victimizations that were self-reported by offence type and gender per 100,000 population in calendar year 2019. Of the total number of victims of self-reported violent crime, women accounted for 10,600 of victimizations and men accounted for 5,900. Of people being sexually assaulted, women accounted for 5,000 of victimizations and men accounted for 900. Experiences of being victimized by a robbery were similar, with both women and men being victimized by this offence at a rate of about 700 victimizations per 100,000 population. For the physical assault rate, women accounted for 4,900 of the self-reported victimizations and men accounted for 4,300. Full data are available immediately below.
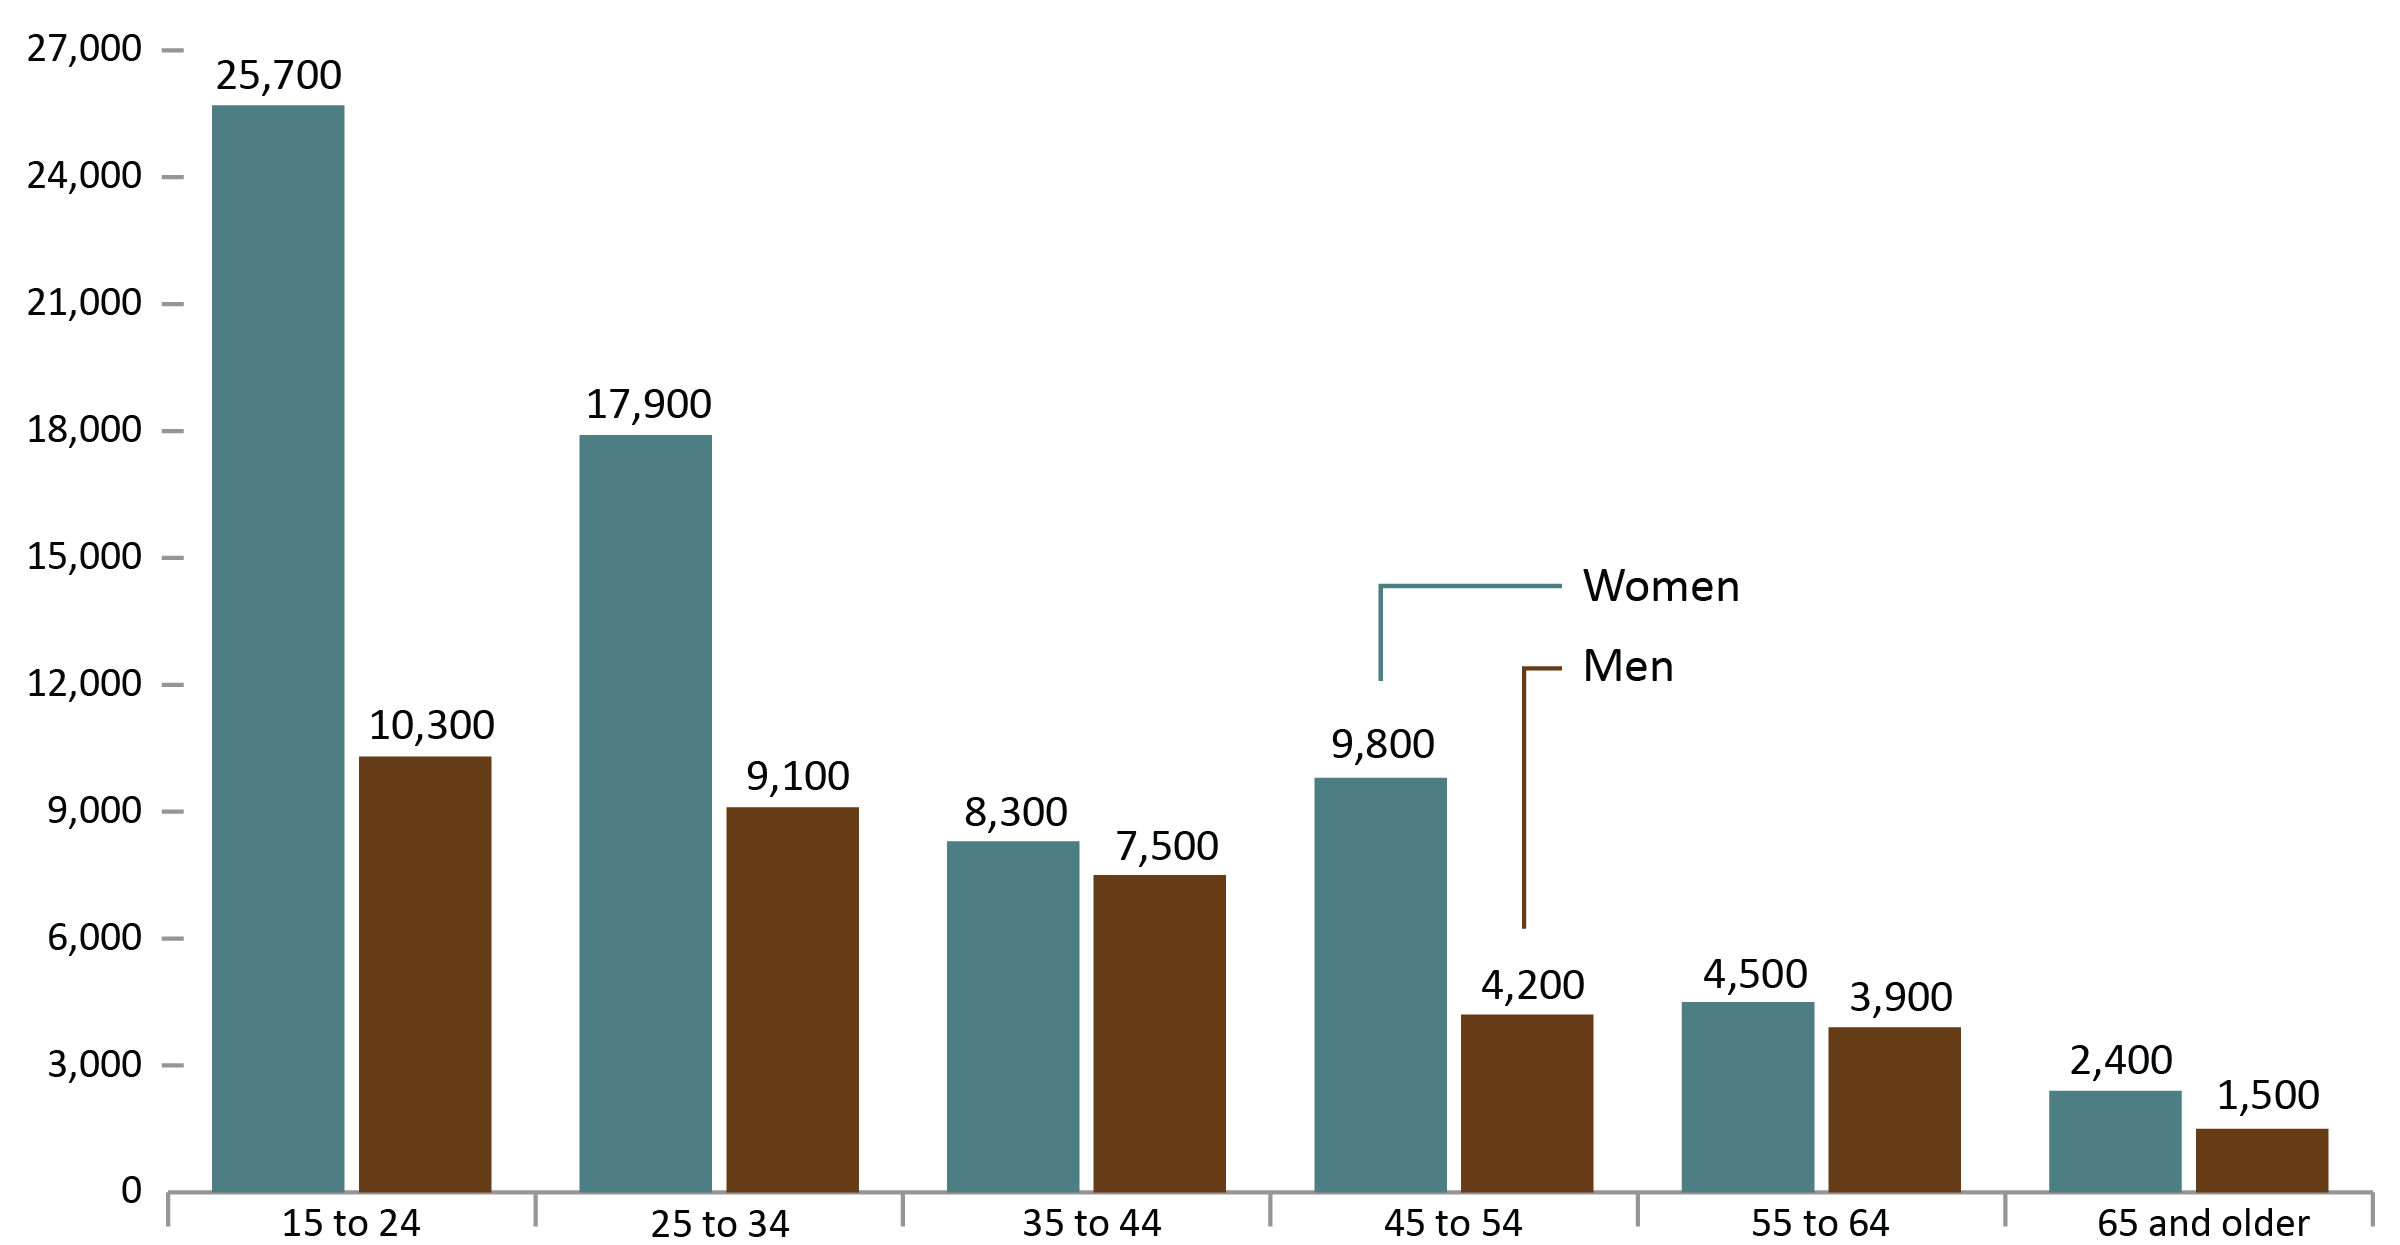
Image description
Bar graph showing the rate self-reported violent victimization rate by age and gender in calendar year 2019 per 100,000 population. Of the 15 to 24 age group, women accounted for 25,700 self-reported violent crimes and men accounted for 10,300. Of the 25 to 34 age group, women accounted for 17,900 self-reported violent crimes and men accounted for 9,100. Of the 35 to 44 age group, women accounted for 8,300 of violent crime victims and men accounted for 7,500. Of the 45 to 54 age group, women accounted for 9,800 of violent victimizations and men accounted for 4,200 of self-reported violent victims. Of the 55 to 64 age group, women accounted for 4,500 victims and men accounted for 3,900. Of the 65 and older age group, women accounted for 2,400 of self-reported violent crimes and men accounted for 1,500. Full data are available immediately below.
Source: General Social Survey (GSS), Statistics Canada.
- Women were more likely to experience violent victimization than men. When broken down into types of crime, the gender difference is largely due to the substantially higher number of women who report sexual assault.
- The gender difference in self-reported crime was greatest at ages 15 to 24 (with a difference of 15,400 per 100,000), followed by ages 25 to 34 (with a difference of 8,800 per 100,000).
Figure A7 Notes
General Social Survey (GSS) Canadians’ Safety data are reported per 1,000 population, which are converted to per 100,000 in the CCRSO for ease of comparison with police reported rates.
Total household victimization includes the following categories asked in the General Social Survey: motor vehicle/parts theft, break and enter, vandalism, theft of household property.
Total violent victimization includes the following categories asked in the General Social Survey: physical assault, sexual assault, and robbery.
The GSS Canadians’ Safety is conducted every 5 years, and the most recent data available is from 2019. The GSS excludes those under age 15
| Type of violent victimization | Women | Men |
|---|---|---|
Sexual assault |
5,000 | 900 |
Robbery |
700 | 700 |
Physical assault |
4,900 | 4,300 |
Total violent victimization |
10,600 | 5,900 |
| Age group | Women | Men |
|---|---|---|
15 to 24 |
25,700 | 10,300 |
25 to 34 |
17,900 | 9,100 |
35 to 44 |
8,300 | 7,500 |
45 to 54 |
9,800 | 4,200 |
55 to 64 |
4,500 | 3,900 |
65 and older |
2,400 | 1,500 |
Source: General Social Survey (GSS) Canadians’ Safety, Statistics Canada.
Table A7 Notes
General Social Survey (GSS) Canadians’ Safety are reported per 1,000 population, which are converted to per 100,000 in the CCRSO for ease of comparison with police-reported rates.
Total household victimization includes the following categories asked in the General Social Survey: motor vehicle/parts theft, break and enter, vandalism, theft of household property.
Total violent victimization includes the following categories asked in the General Social Survey: physical assault, sexual assault, and robbery.
The GSS Canadians’ Safety is conducted every 5 years, and the most recent data available is from 2019. The GSS excludes those under age 15.
Self-reported victimization reported to police by crime
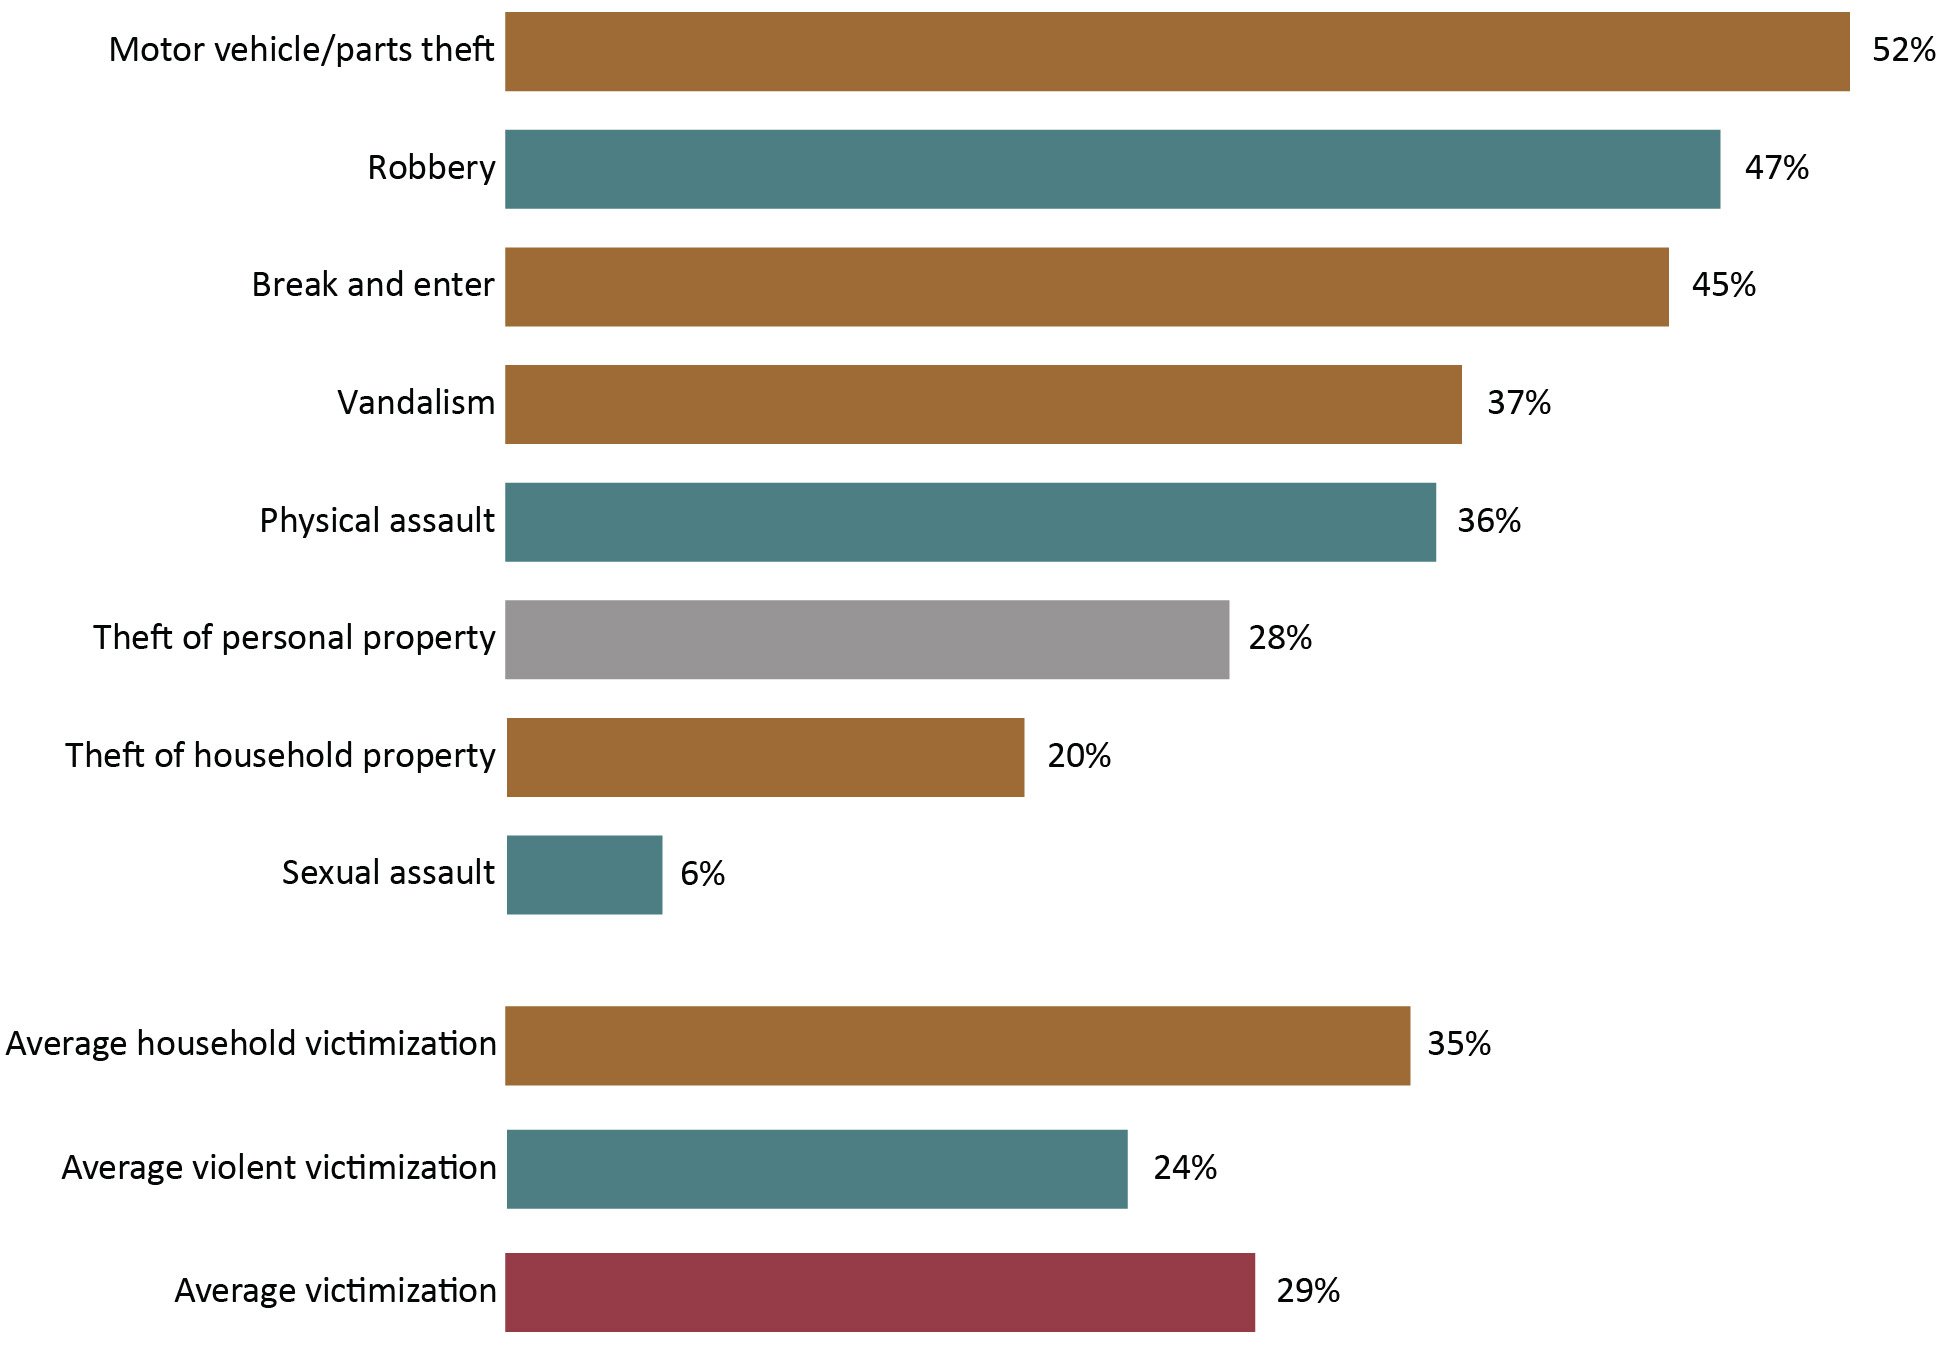
Image description
Bar graph showing the percentage of criminal victimizations that were reported to police in calendar year 2019. Motor vehicle or parts theft was the crime most frequently reported to the police at 52 percent of victimizations of this type being reported to the police; followed by robbery with 47 percent of all victimizations being reported to the police; break and enters offences were reported to the police about 45 percent of the time; vandalism 37 percent of the time; only 36 percent of the physical assaults that were experienced were reported to the police; theft of personal property was reported to the police 28 percent of the time; theft of household property offences were reported to the police in only about 1 in 5 instances; and, finally, of the offence types for which victimization data is available, sexual assaults were only reported to the police 6 percent of the time this offence occurred. Of average household victimizations, 35 percent were reported to the police; of average violent victimizations, 24 percent were reported to the police; and of total victimizations, 29 percent were reported to the police. Full data are available immediately below.
Source: General Social Survey (GSS) Canadians’ Safety, Statistics Canada.
- Motor vehicle/parts theft was most frequently reported to police with 52% of self-reported motor vehicle/parts theft reported to police. Sexual assault was the crime type least frequently reported to police, with only 6% of self-reported sexual assaults reported to police.
- Self-reported household victimization was more commonly reported to police than self-reported violent victimization.
Figure A8 Notes
General Social Survey (GSS) Canadians’ Safety are reported per 1,000 population, which are converted to per 100,000 in the CCRSO for ease of comparison with police-reported rates.
Total household victimization includes the following categories asked in the General Social Survey: motor vehicle/parts theft, break and enter, vandalism, theft of household property.
Total violent victimization includes the following categories asked in the General Social Survey: physical assault, sexual assault, and robbery.
The GSS Canadians’ Safety is conducted every 5 years, and the most recent data available is from 2019. The GSS excludes those under age 15.
| Type of victimization | Percent reported to police |
|---|---|
Motor vehicle/parts theft |
52 |
Robbery |
47 |
Break and enter |
45 |
Vandalism |
37 |
Physical assault |
36 |
Theft of personal property |
28 |
Theft of household property |
20 |
Sexual assault |
6 |
Total household victimization |
35 |
Total violent victimization |
24 |
Total victimization |
29 |
Source: General Social Survey (GSS) Canadians’ Safety, Statistics Canada.
Table A8 Notes
General Social Survey (GSS) Canadians’ Safety are reported per 1,000 population, which are converted to per 100,000 in the CCRSO for ease of comparison with police-reported rates.
Total household victimization includes the following categories asked in the General Social Survey: motor vehicle/parts theft, break and enter, vandalism, theft of household property.
Total violent victimization includes the following categories asked in the General Social Survey: physical assault, sexual assault, and robbery.
The GSS Canadians’ Safety is conducted every 5 years, and the most recent data available is from 2019. The GSS excludes those under age 15.
The rate of adults charged
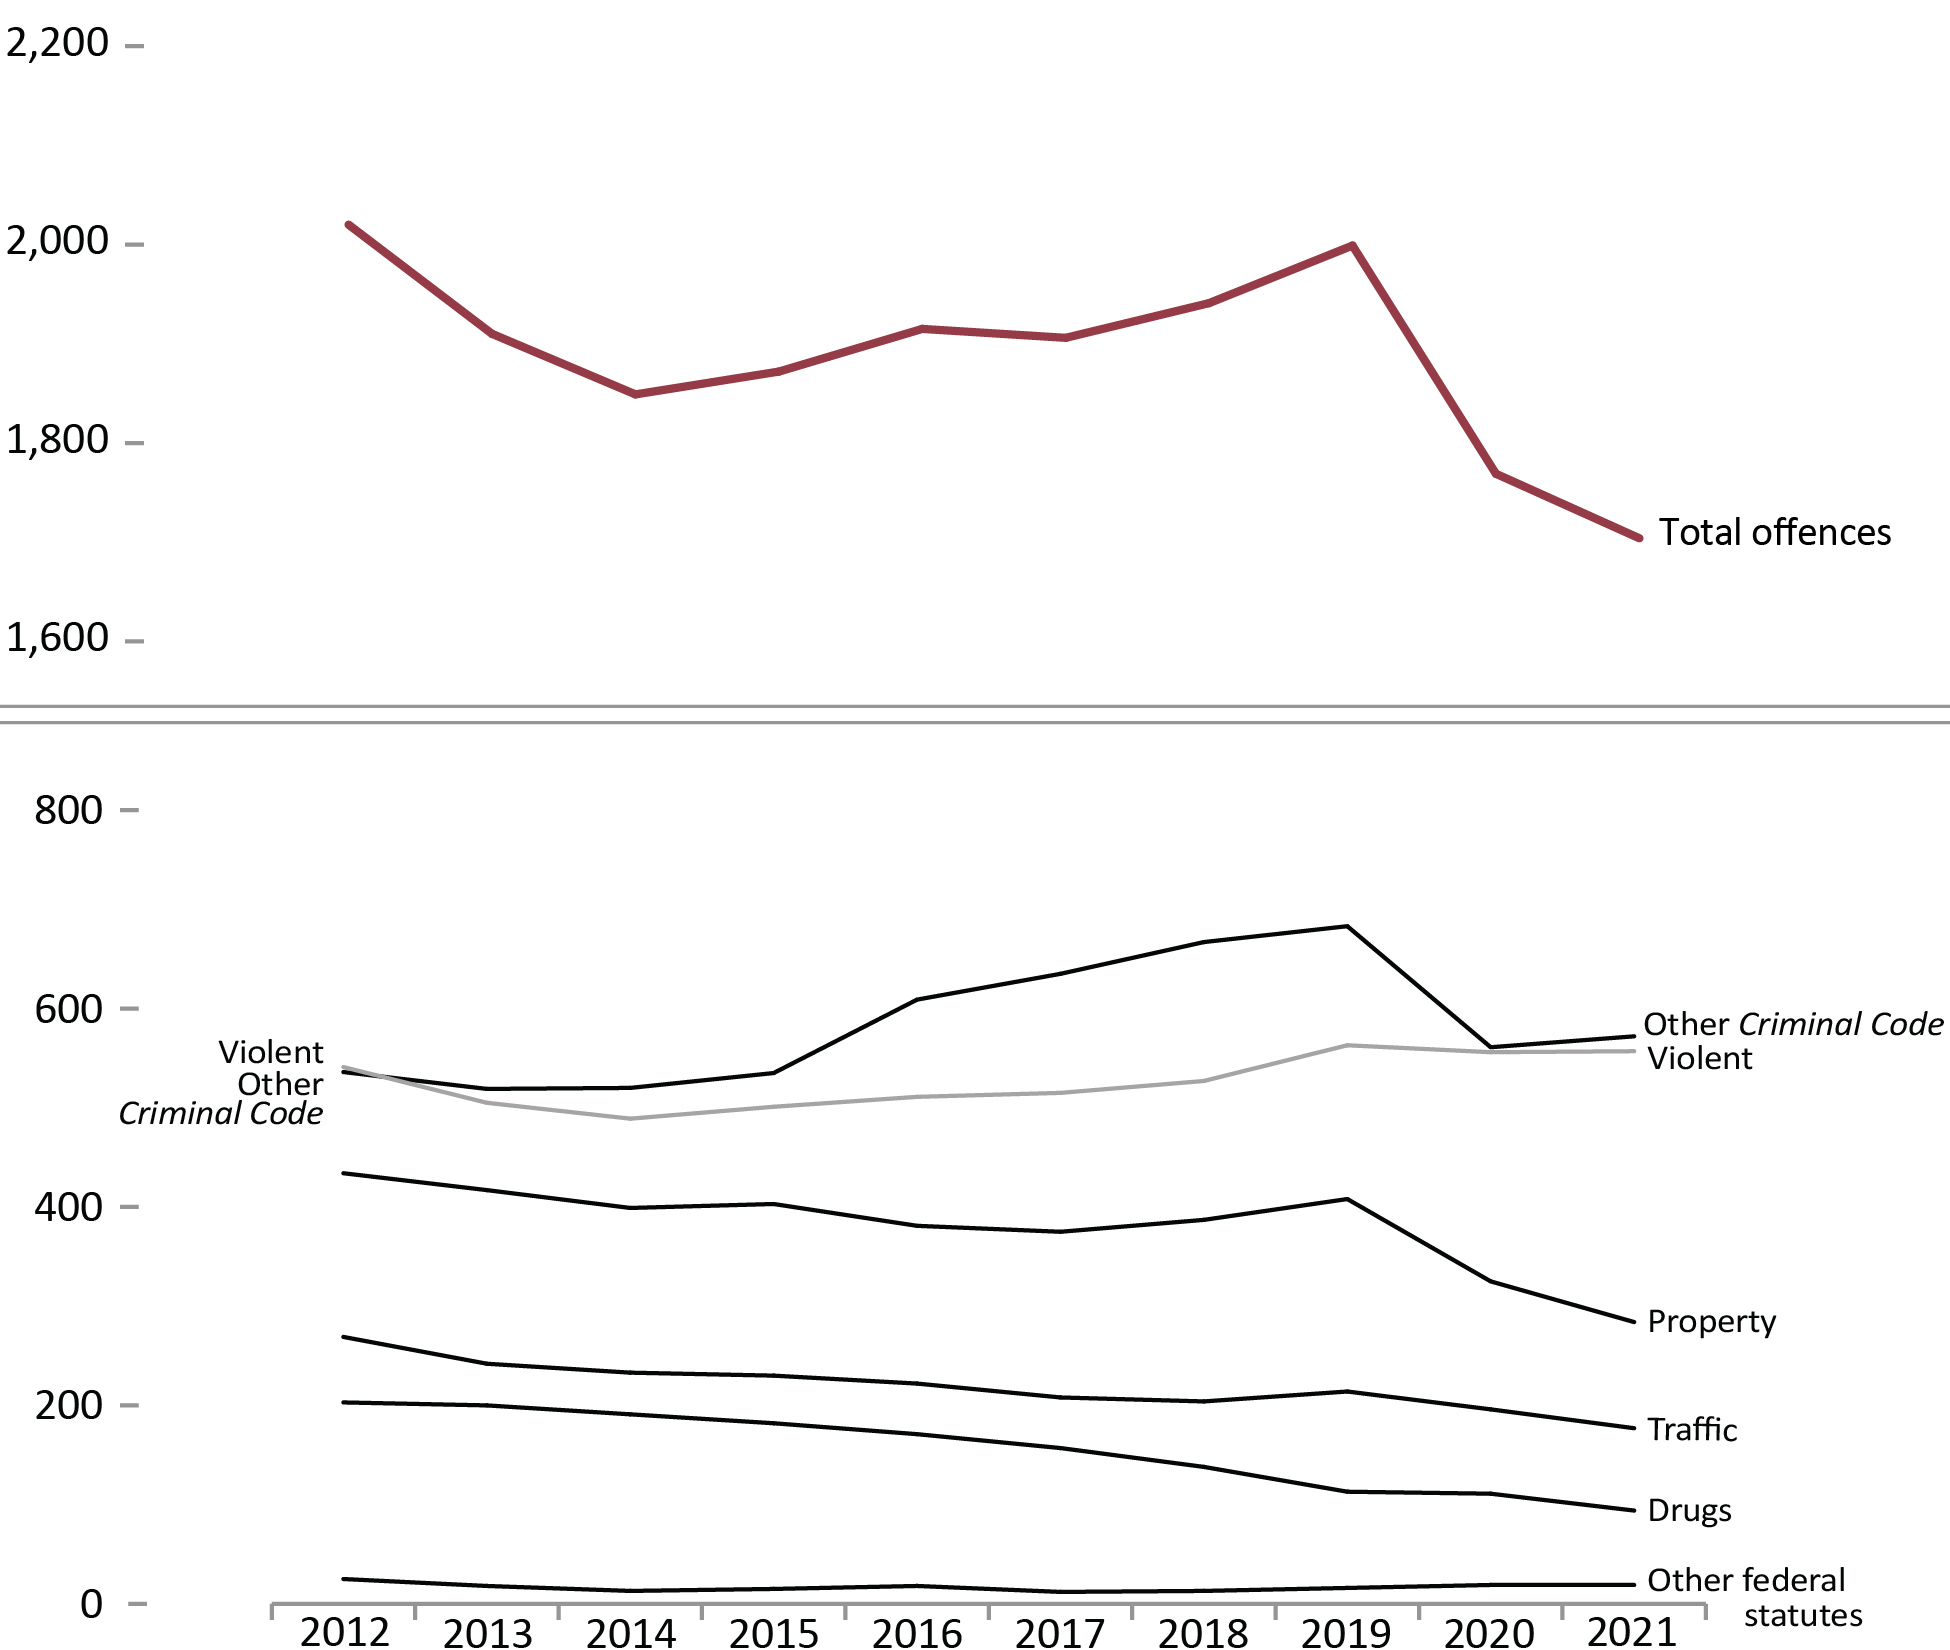
Image description
Line graph of the rate of adults charged with a Criminal Code offence by total offences and by types of offences per 100,000 population. Starting in calendar year 2012 there were just over 2,000 adults charged per 100,000 population. This rate steadily decreases until 2014 where it reaches a low of 1,849 adults charged per 100,000 population before steadily increasing until 2019 where the rate reaches a peak of 1,999 adults charged per 100,000 population. The rate decreases again in 2020 with a rate of 1,769 adults charged per 100,000 population and continues to drop in 2021 to a rate of 1,704 adults charged per 100,000 population.
From 2012 to 2019 other Criminal Code offences increased from 536 adults charged per 100,000 population to a peak of 683 per 100,000, then dropping to 561 per 100,000 population in the year 2020, and increasing again to 572 per 100,000 population in 2021. The rate of violent crimes decreased from 541 adults charged per 100,000 population in 2012 to 489 per 100,000 in 2014. Between 2015 and 2021, the rate of adults charged for violent crimes gradually increases from 501 per 100,000 population to a peak of 557 per 100,000 population. The rate of property offences steadily decreased from 434 adults charged per 100,000 population in 2012 to 284 per 100,000 population in 2021. This trend line is interrupted by a spike in the year 2019 where property offences reach 408 per 100,000 population before decreasing again. The rate of traffic charges steadily decreased from 269 adults charged per 100,000 in 2012 to 177 in 2020. The rate of drug charges saw the most steady decline over this period dropping from 203 adults charged per 100,000 in 2012 to 94 per 100,000 in 2021. Other federal statutes offences remained stable over this period at a rate lower than 25 per 100,000 Canadians. Full data are available immediately below.
Source: Table 35-10-0177-01, Incident-based crime statistics, by detailed violations, Canada, provinces, territories and Census Metropolitan Areas
- Overall, the rate of adults charged decreased 7.2% from 2017 to 2020. This was followed by a decline of 3.7% between 2020 to 2021. The 2021 rate was 15.6% lower than 2012 and 10.6% lower than 2017.
- The rate of adults charged with violent crimes increased 8.0% between 2017 to 2020 and then showed a 0.2% increase between 2020 and 2021. The 2021 rate is 2.8% higher than 2012 and 8.2% higher than 2017.
- The rate of adults charged with other Criminal Code offences increased by 4.7% between 2012 to 2020 and then increased by 2.0% between 2020 and 2021.
- The rate of adults charged with Other Federal Statutes decreased 25.7% from 2012 to 2020 and then remained stable from 2020 to 2021.
Figure A9 Notes
Other Criminal Code offences includes administration of justice violations, weapons/firearms violations, counterfeit, possession of, accessing, making or distribution of child pornography and prostitution.
Other federal statute offences refer to offences against Canadian federal statutes, such as Customs Act, Employment Insurance Act, Firearms Act, Food and Drugs Act (FDA), Income Tax Act, Controlled Drugs and Substances Act (CDSA) and Narcotic Control Act (NCA). This offence category excludes Criminal Code of Canada offences.
Violent crimes include homicide, attempted murder, assault, sexual offences, abduction, extortion, robbery, firearms, and other violent offences such as uttering threats and criminal harassment. Property crimes include break and enter, motor vehicle thefts, other thefts, possession of stolen property, fraud, mischief and arson.
| Year | Violent | Property | Traffic | Other CC | Drugs | Total other fed. stat. | Total charged |
|---|---|---|---|---|---|---|---|
| 1998 | 563 | 677 | 374 | 430 | 168 | 12 | 2,236 |
| 1999 | 590 | 632 | 371 | 396 | 185 | 18 | 2,203 |
| 2000 | 615 | 591 | 349 | 411 | 198 | 16 | 2,190 |
| 2001 | 641 | 584 | 349 | 451 | 202 | 18 | 2,256 |
| 2002 | 617 | 569 | 336 | 460 | 199 | 18 | 2,211 |
| 2003 | 598 | 573 | 326 | 476 | 172 | 15 | 2,168 |
| 2004 | 584 | 573 | 314 | 490 | 187 | 22 | 2,180 |
| 2005 | 589 | 550 | 299 | 479 | 185 | 22 | 2,131 |
| 2006 | 594 | 533 | 300 | 498 | 198 | 20 | 2,150 |
| 2007 | 577 | 499 | 298 | 521 | 208 | 20 | 2,132 |
| 2008 | 576 | 487 | 307 | 540 | 207 | 22 | 2,149 |
| 2009 | 585 | 490 | 311 | 532 | 201 | 20 | 2,152 |
| 2010 | 576 | 473 | 295 | 545 | 211 | 22 | 2,132 |
| 2011 | 548 | 441 | 271 | 527 | 213 | 23 | 2,034 |
| 2012 | 541 | 434 | 269 | 536 | 203 | 25 | 2,020 |
| 2013 | 505 | 417 | 242 | 519 | 200 | 18 | 1,910 |
| 2014 | 489 | 399 | 233 | 520 | 191 | 13 | 1,849 |
| 2015 | 501 | 403 | 230 | 535 | 182 | 15 | 1,872 |
| 2016 | 511 | 381 | 222 | 609 | 171 | 18 | 1,915 |
| 2017 | 515 | 375 | 208 | 635 | 157 | 12 | 1,906 |
| 2018 | 527 | 387 | 204 | 667 | 138 | 13 | 1,941 |
| 2019 | 563 | 408 | 214 | 683 | 113 | 16 | 1,999 |
| 2020 | 556 | 325 | 196 | 561 | 111 | 19 | 1,769 |
| 2021 | 557 | 284 | 177 | 572 | 94 | 19 | 1,704 |
Source: Table 35-10-0177-01, Incident-based crime statistics, by detailed violations, Canada, provinces, territories and Census Metropolitan Areas
Table A9 Notes
Other Criminal Code offences (Other CC) includes administration of justice offences, counterfeit, weapons/firearms violations, possession of, accessing, making or distribution of child pornography and prostitution.
Other federal statute offences refer to offences against Canadian federal statutes, such as Customs Act, Employment Insurance Act, Firearms Act, Food and Drugs Act (FDA), Income Tax Act, Controlled Drugs and Substances Act (CDSA) and Narcotic Control Act (NCA). This offence category excludes Criminal Code of Canada offences.
Violent crimes include homicide, attempted murder, assault, sexual offences, abduction, extortion, robbery, firearms, and other violent offences such as uttering threats and criminal harassment. Property crimes include break and enter, motor vehicle theft, other theft, possession of stolen property, fraud, mischief and arson.
Due to rounding, rates may not add up to totals.
Criminal Code and other Federal Statute charges among adults
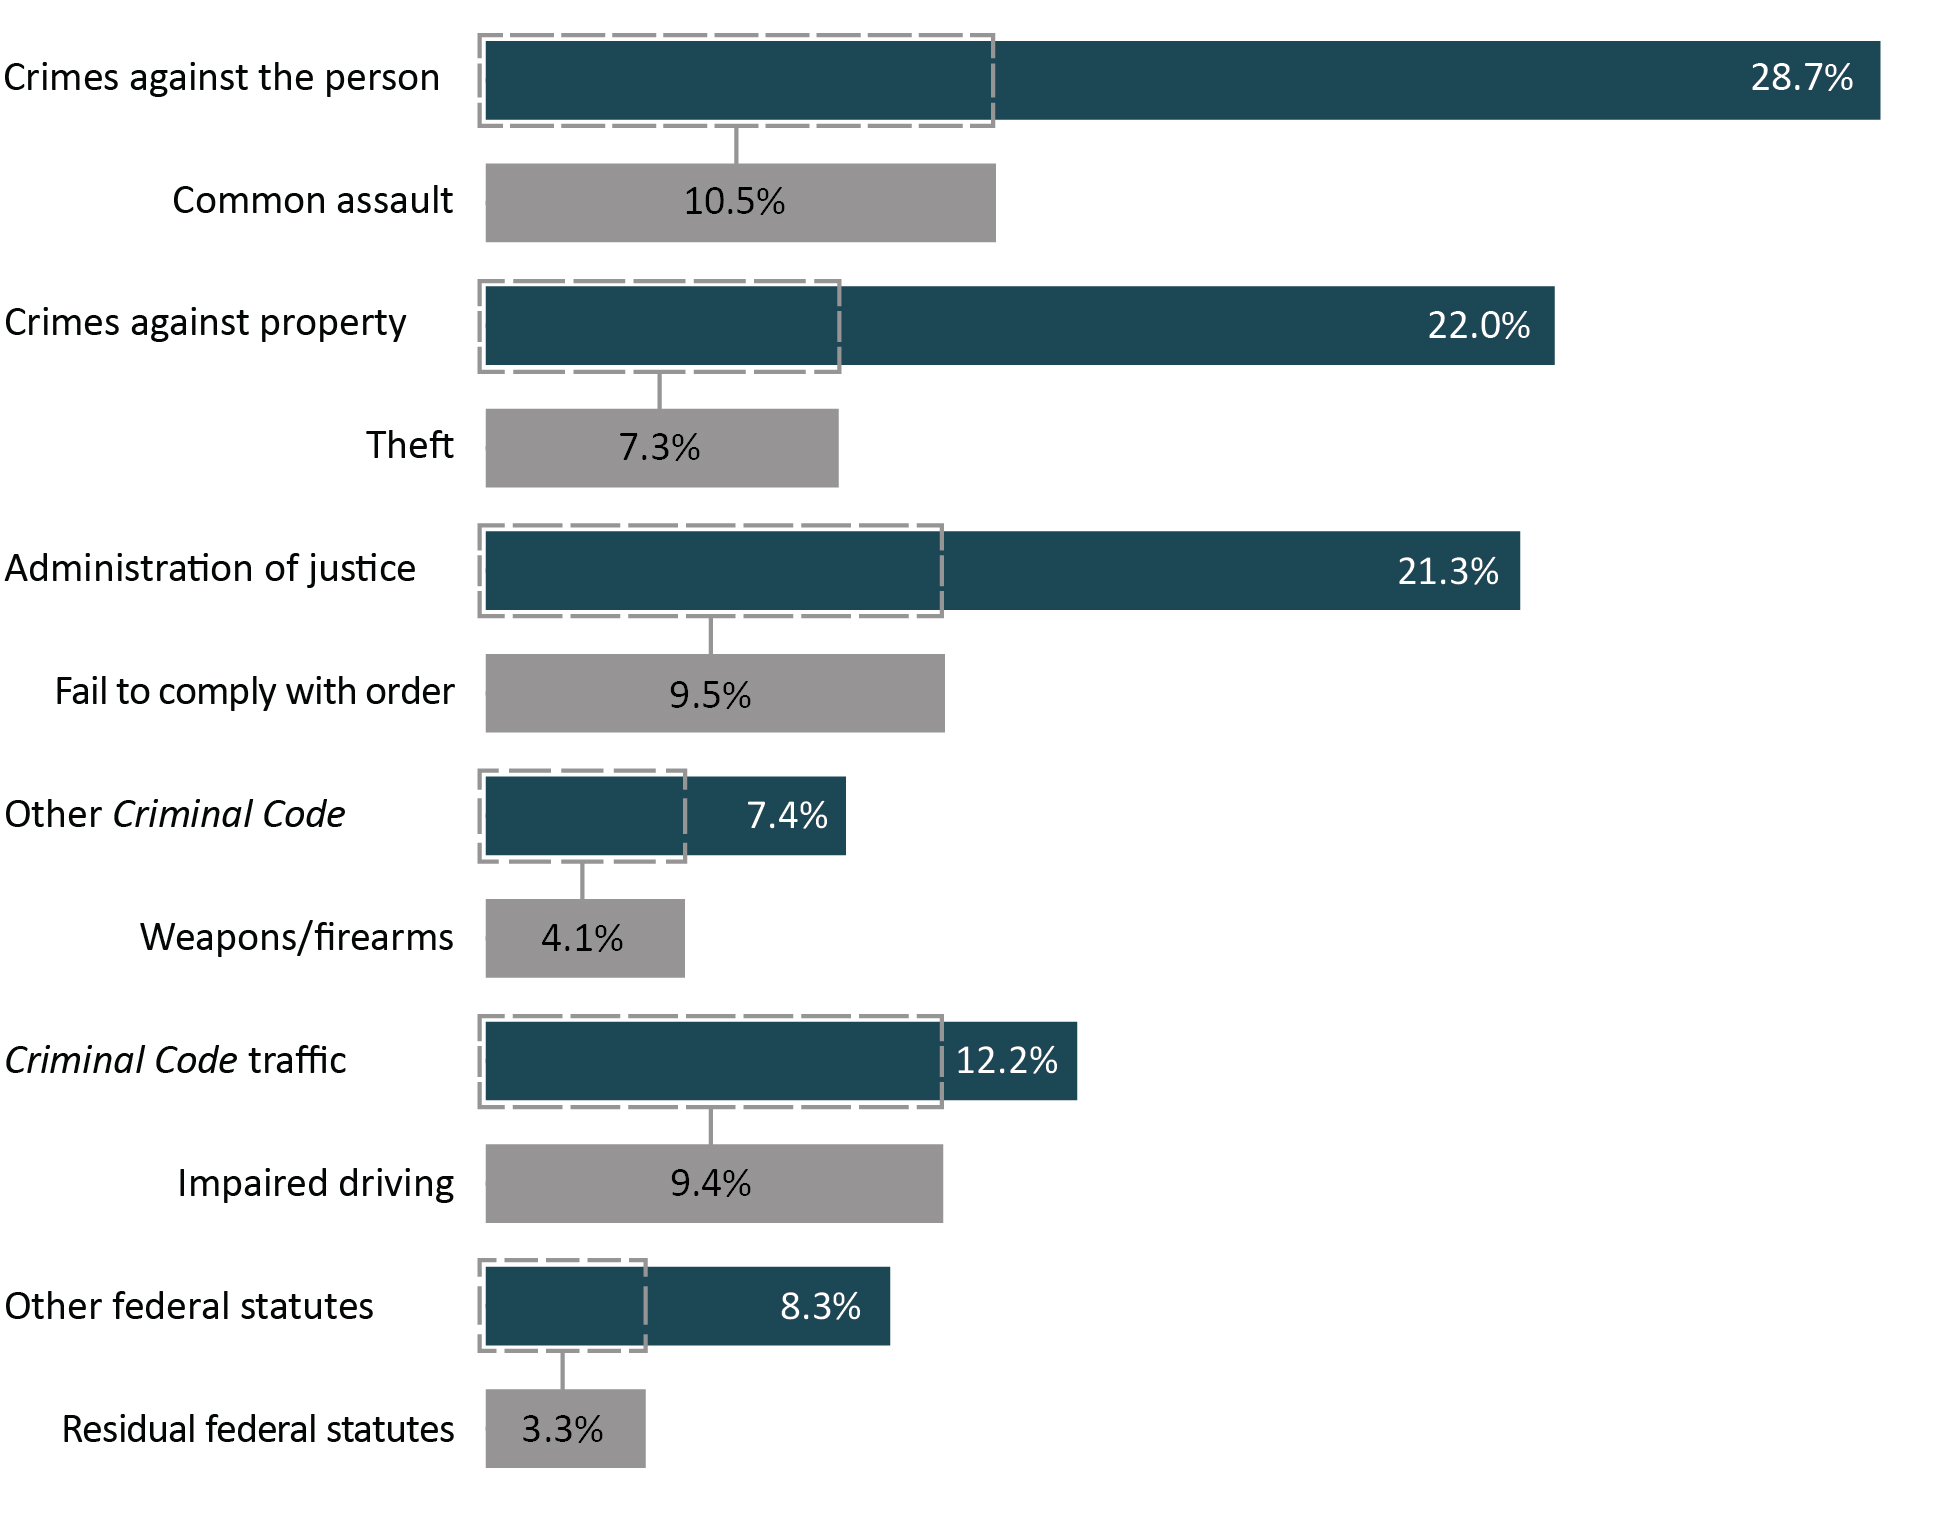
Image description
Bar graph showing Criminal Code and other Federal Statute charges among adults by type of charge in the 2020 to 2021 fiscal year. Crimes against the person accounted for 28.7 percent of charges, with common assault representing 10.5 percent of those charges. Crimes against property accounted for 22.0 percent of charges, with theft representing 7.3 percent of those charges. Administration of justice accounted for 21.3 percent of charges, with fail to comply with order representing 9.5 percent of those charges. Other Criminal Code accounted for 7.4 percent of charges, with weapons/firearms representing 4.1 percent of those charges. Criminal Code traffic accounted for 12.2 percent of charges, with impaired driving representing 9.4 percent of those charges. Finally, other federal statutes accounted for 8.3 percent of charges, with residual federal statutes representing 3.3 percent of those charges. Full data are available immediately below.
Source: Table 35-10-0027-01, Integrated Criminal Court Survey, Canadian Centre for Justice and Community Safety Statistics, Statistics Canada.
- Common assault (Level 1) (10.5%), impaired driving (9.4%) and theft (7.3%) were the most frequent cases in adult courts in 2020 to 21.
- Administration of justice cases (offences related to case proceedings such as failure to appear in court, failure to comply with a court order, breach of probation, and unlawfully at large) accounted for 21.3% of cases completed in adult criminal courts.
Figure A10 Notes
Administration of justice includes the offences failure to appear, breach of probation, and unlawfully at large.
Other Criminal Code offences (Other CC) includes administration of justice violations, weapons/firearms violations, counterfeit, possession of, accessing, making or distribution of child pornography and prostitution.
Other federal statute offences refer to offences against Canadian federal statutes, such as Customs Act, Employment Insurance Act, Firearms Act, Food and Drugs Act, Income Tax Act, Controlled Drugs and Substances Act (CDSA) and Narcotic Control Act (NCA). This offence category excludes Criminal Code of Canada offences.
The concept of a case has changed to more closely reflect court processing. Statistics from the Integrated Criminal Court Survey used in this report should not be compared to editions of the Corrections and Conditional Release Statistical Overview prior to 2007. A case is 1 or more charges against an accused person or corporation, processed by the courts at the same time, and where all of the charges in the case received a final disposition. Where a case has more than 1 charge, it is necessary to select a charge to represent the case. An offence is selected by applying 2 rules. First, the most serious decision rule is applied. In cases where 2 or more offences have the same decision, the most serious offence rule is applied. All charges are ranked according to an offence seriousness scale. Superior Court data are not reported to the Integrated Criminal Court Survey for Prince Edward Island, Quebec, Ontario, Manitoba and Saskatchewan. In addition, information from Quebec's municipal courts is not collected.
The Canadian Centre for Justice and Community Safety Statistics continues to make updates to the offence library used to classify offence data sent by the provinces and territories. These improvements have resulted in minor changes in the counts of charges and cases as well as the distributions by type of offence. Data presented have been revised to account for these updates.
Due to rounding, percentages may not add up to 100 percent.
The figure includes data from the most recent year available at the time of publication.
Reported year periods reflect fiscal years. A fiscal year runs from April 1 to March 31 of the following year.
| Type of charge | 2016-17 | 2017-18 | 2018-19 | 2019-20 | 2020-21 |
|---|---|---|---|---|---|
Crimes against the person |
85,474 | 89,169 | 82,798 | 85,762 | 66,920 |
Homicide and related |
364 | 376 | 334 | 330 | 302 |
Attempted murder |
203 | 202 | 214 | 184 | 162 |
Robbery |
3,575 | 3,535 | 3,091 | 3,246 | 2,524 |
Sexual assault |
3,109 | 3,277 | 3,325 | 3,603 | 2,640 |
Other sexual offences |
3,950 | 4,345 | 3,971 | 4,050 | 2,800 |
Major assault (levels 2 & 3) |
20,201 | 20,804 | 19,604 | 20,795 | 17,119 |
Common assault (level 1) |
31,672 | 35,112 | 32,247 | 32,387 | 24,480 |
Uttering threats |
15,260 | 13,912 | 12,966 | 13,813 | 10,960 |
Criminal harassment |
3,539 | 3,749 | 3,310 | 3,647 | 3,009 |
Other crimes against persons |
3,250 | 3,341 | 3,164 | 3,264 | 2,739 |
Crimes against property |
85,467 | 82,529 | 73,682 | 76,404 | 51,287 |
Theft |
36,137 | 32,710 | 28,292 | 29,481 | 16,923 |
Break and enter |
9,966 | 9,706 | 9,179 | 9,788 | 7,488 |
Fraud |
12,728 | 12,599 | 11,005 | 11,476 | 7,447 |
Mischief |
12,956 | 13,165 | 12,111 | 12,083 | 9,536 |
Possession of stolen property |
11,646 | 11,981 | 10,593 | 10,887 | 7,831 |
Other property crimes |
2,034 | 2,368 | 2,502 | 2,689 | 2,062 |
Administration of justice |
80,940 | 73,809 | 67,925 | 69,468 | 49,642 |
Fail to appear |
4,442 | 4,159 | 4,461 | 4,261 | 3,032 |
Breach of probation |
30,955 | 29,008 | 26,047 | 27,457 | 18,383 |
Unlawfully at large |
2,693 | 2,872 | 2,705 | 2,743 | 1,345 |
Fail to comply with order |
34,632 | 30,080 | 27,680 | 28,101 | 22,038 |
Other admin. justice |
8,218 | 7,690 | 7,032 | 6,906 | 4,844 |
Other Criminal Code |
20,112 | 23,448 | 22,006 | 22,073 | 17,292 |
Weapons/firearms |
10,961 | 11,322 | 10,704 | 11,070 | 9,475 |
Prostitution |
64 | 42 | 22 | 10 | 25 |
Disturbing the peace |
938 | 740 | 632 | 633 | 400 |
Residual Criminal Code |
8,149 | 11,344 | 10,648 | 10,360 | 7,392 |
Criminal Code traffic |
45,832 | 44,197 | 39,346 | 38,802 | 28,367 |
Impaired driving |
35,994 | 34,941 | 30,721 | 30,333 | 21,950 |
Other CC traffic |
9,838 | 9,256 | 8,625 | 8,469 | 6,417 |
Other federal statutes |
38,371 | 36,302 | 29,691 | 24,850 | 19,392 |
Drug possession |
10,675 | 8,592 | 6,531 | 4,905 | 5,596 |
Other drug offences |
8,506 | 8,139 | 7,429 | 6,780 | 5,763 |
Residual federal statutes |
18,179 | 18,695 | 14,975 | 12,495 | 7,653 |
Total offences |
356,170 | 349,454 | 315,448 | 311,940 | 232,900 |
Source: Table 35-10-0027-01, Integrated Criminal Court Survey, Canadian Centre for Justice and Community Safety Statistics, Statistics Canada.
Table A10 Notes
Administration of justice includes the offences failure to appear, breach of probation, and unlawfully at large.
Other Criminal Code offences (Other CC) includes administration of justice violations, weapons/firearms violations, counterfeit, possession of, accessing, making or distribution of child pornography and prostitution.
Other federal statute offences refer to offences against Canadian federal statutes, such as Customs Act, Employment Insurance Act, Firearms Act, Food and Drugs Act (FDA), Income Tax Act, Controlled Drugs and Substances Act (CDSA) and Narcotic Control Act (NCA). This offence category excludes Criminal Code of Canada offences.
The concept of a case has changed to more closely reflect court processing. Statistics from the Integrated Criminal Court Survey used in this report should not be compared to editions of the Corrections and Conditional Release Statistical Overview prior to 2007. A case is 1 or more charges against an accused person or corporation, processed by the courts at the same time, and where all of the charges in the case received a final disposition. Where a case has more than 1 charge, it is necessary to select a charge to represent the case. An offence is selected by applying 2 rules. First, the most serious decision rule is applied. In cases where 2 or more offences have the same decision, the most serious offence rule is applied. All charges are ranked according to an offence seriousness scale. Superior Court data are not reported to the Integrated Criminal Court Survey for Prince Edward Island, Quebec, Ontario, Manitoba and Saskatchewan. In addition, information from Quebec's municipal courts is not collected.
The Canadian Centre for Justice and Community Safety Statistics continues to make updates to the offence library used to classify offence data sent by the provinces and territories. These improvements have resulted in minor changes in the counts of charges and cases as well as the distributions by type of offence. Data presented have been revised to account for these updates.
Due to rounding, percentages may not add up to 100 percent.
The table includes data from the most recent year available at the time of publication.
Reported year periods reflect fiscal years. A fiscal year runs from April 1 to March 31 of the following year.
Decisions in adult criminal court
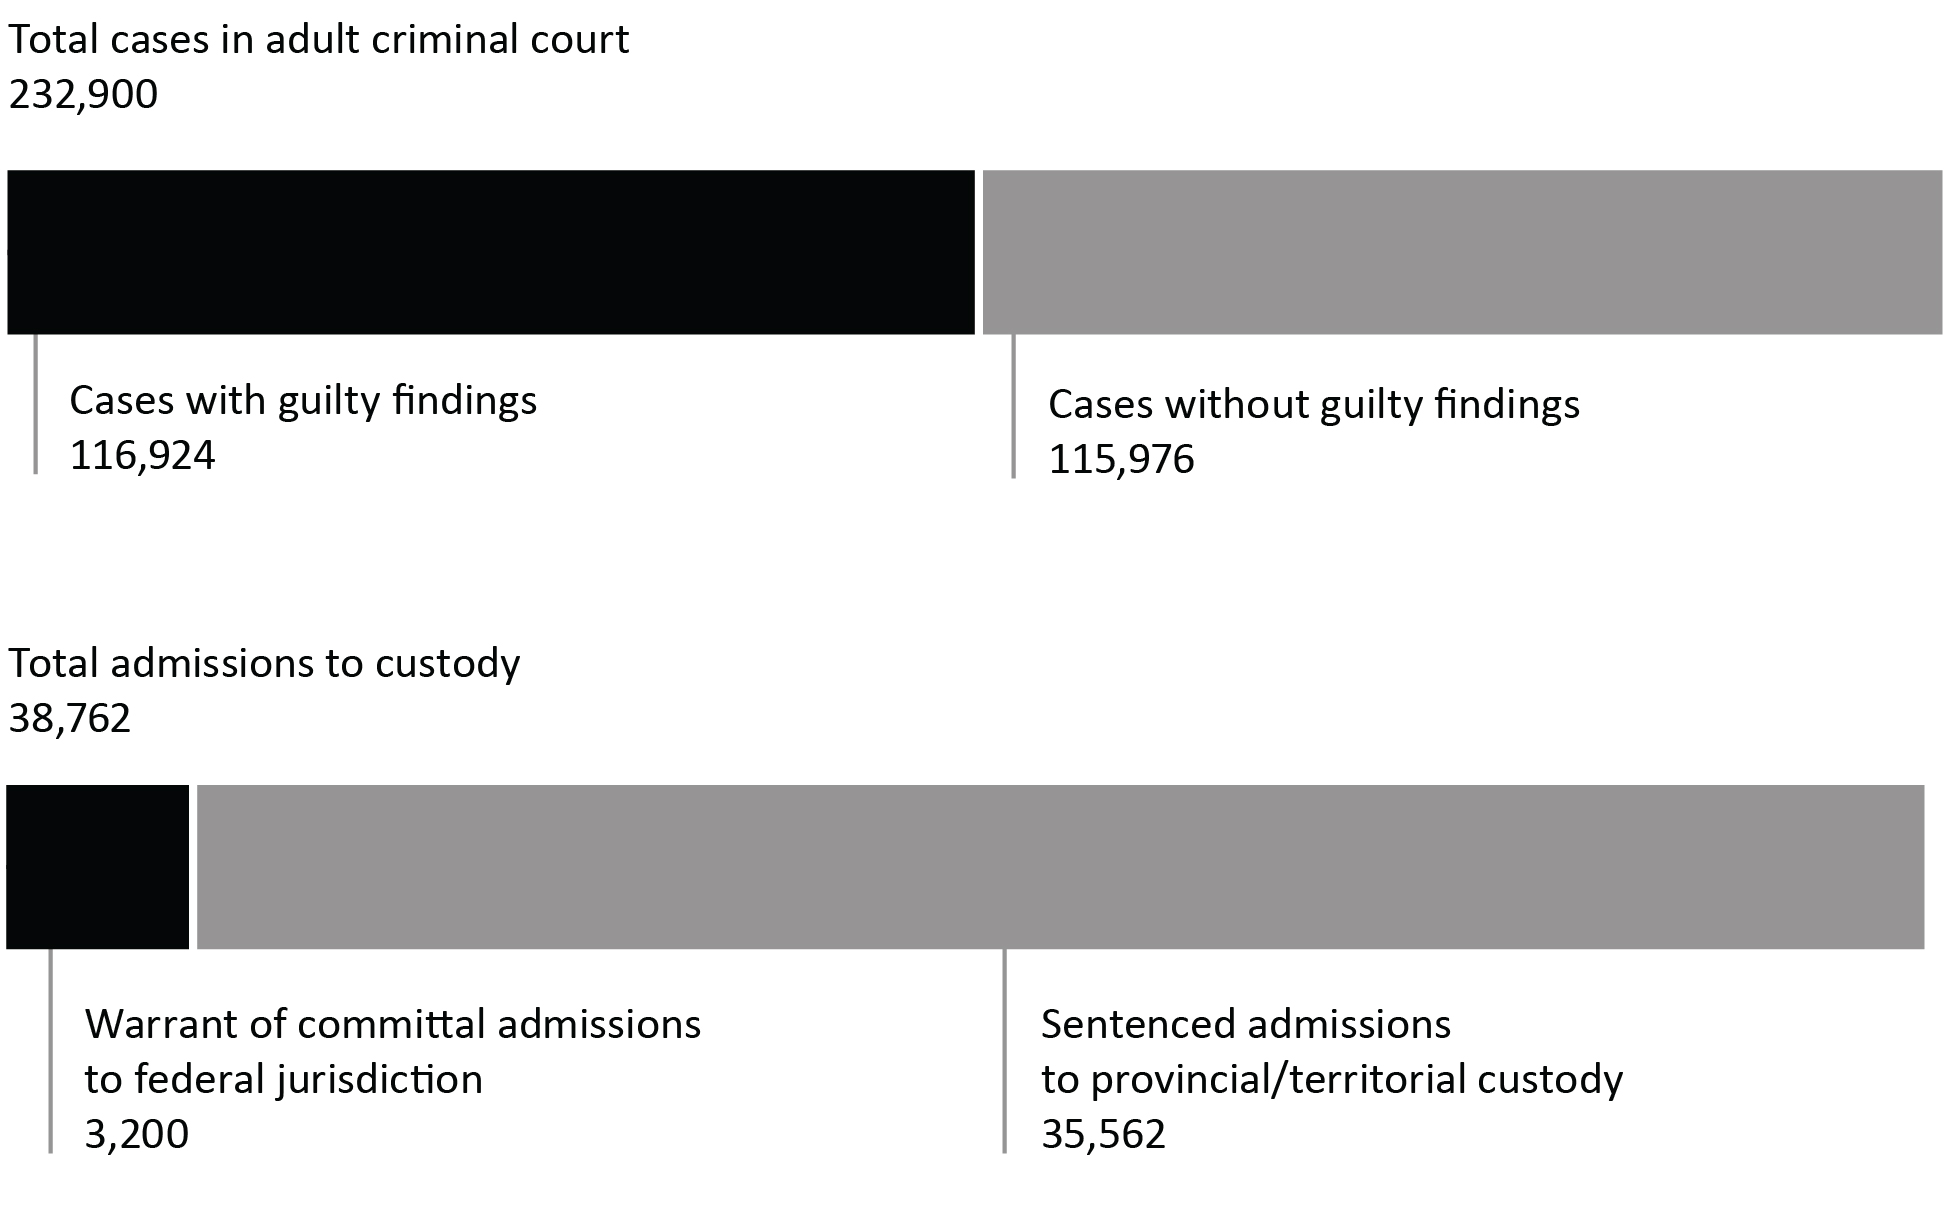
Image description
Bar illustration showing the number of cases in adult criminal court and admissions to custody in the 2020 to 2021 fiscal year. Of the total number of cases in adult criminal court, which was 232,900 cases, the number of cases with guilty findings accounted for 116,924 of cases and cases without guilting findings accounted for 115,967 of cases. Of the total admissions to custody, which was 38,762 cases, warrant of committal admissions to federal jurisdiction accounted for 3,200 of cases and sentenced admissions to provincial or territorial custody accounted for 35,562 of cases. Full data are available immediately below.
Sources: Table 35-10-0027-01, Integrated Criminal Court Survey, Canadian Centre for Justice and Community Safety Statistics, Statistics Canada; Table 35-10-0018-01, Adult Correctional Services, Canadian Centre for Justice and Community Safety Statistics, Statistics Canada; Correctional Service of Canada.
- During 2020-21, there were 3,200Footnote * warrant of committal admissions to a federal institution or Healing Lodge.
- In 2020-21, there were 116,924 cases with guilty findings in adult criminal court.
- In 2020-21, there were 35,562 sentenced admissions to provincial/territorial custody, compared to 3,200 warrant of committal admissions to a federal institution or Healing Lodge.
- Between 2017-18 and 2020-21, the total number of cases in adult criminal court decreased 33.4%. In the same time period, the total number of sentenced admissions to provincial/territorial custody decreased 56.0%.
| 2017-18 | 2018-19 | 2019-20 | 2020-21 | 2021-22 | |
|---|---|---|---|---|---|
| Total case decisionsFootnote * in adult criminal courtFootnote 1 | 349,454 | 315,448 | 317,359 | 232,900 | Not availableFootnote ** |
| Cases with guilty findings in adult criminal courtFootnote 1 | 217,433 | 193,889 | 192,926 | 116,924 | Not availableFootnote ** |
| Total cases without guilty findings in criminal courtFootnote 1 | 132,021 | 121,559 | 124,433 | 115,976 | Not availableFootnote ** |
AcquittedFootnote 1 |
12,637 | 11,340 | 9,805 | 7,124 | Not availableFootnote ** |
Stayed or withdrawnFootnote 1 |
115,291 | 106,200 | 110,894 | 106,050 | Not availableFootnote ** |
Other decisionsFootnote 1 |
4,093 | 4,019 | 3,734 | 2,802 | Not availableFootnote ** |
| Sentenced admissions to provincial/territorial custodyFootnote 2 | 80,759 | 72,312 | 64,948 | 35,562 | Not availableFootnote ** |
| Warrant of committal-admission to FED (CSC)Footnote 3 | 4,998 | 5,006 | 4,641 | 3,200 | 3,887 |
Length of adult custodial sentences
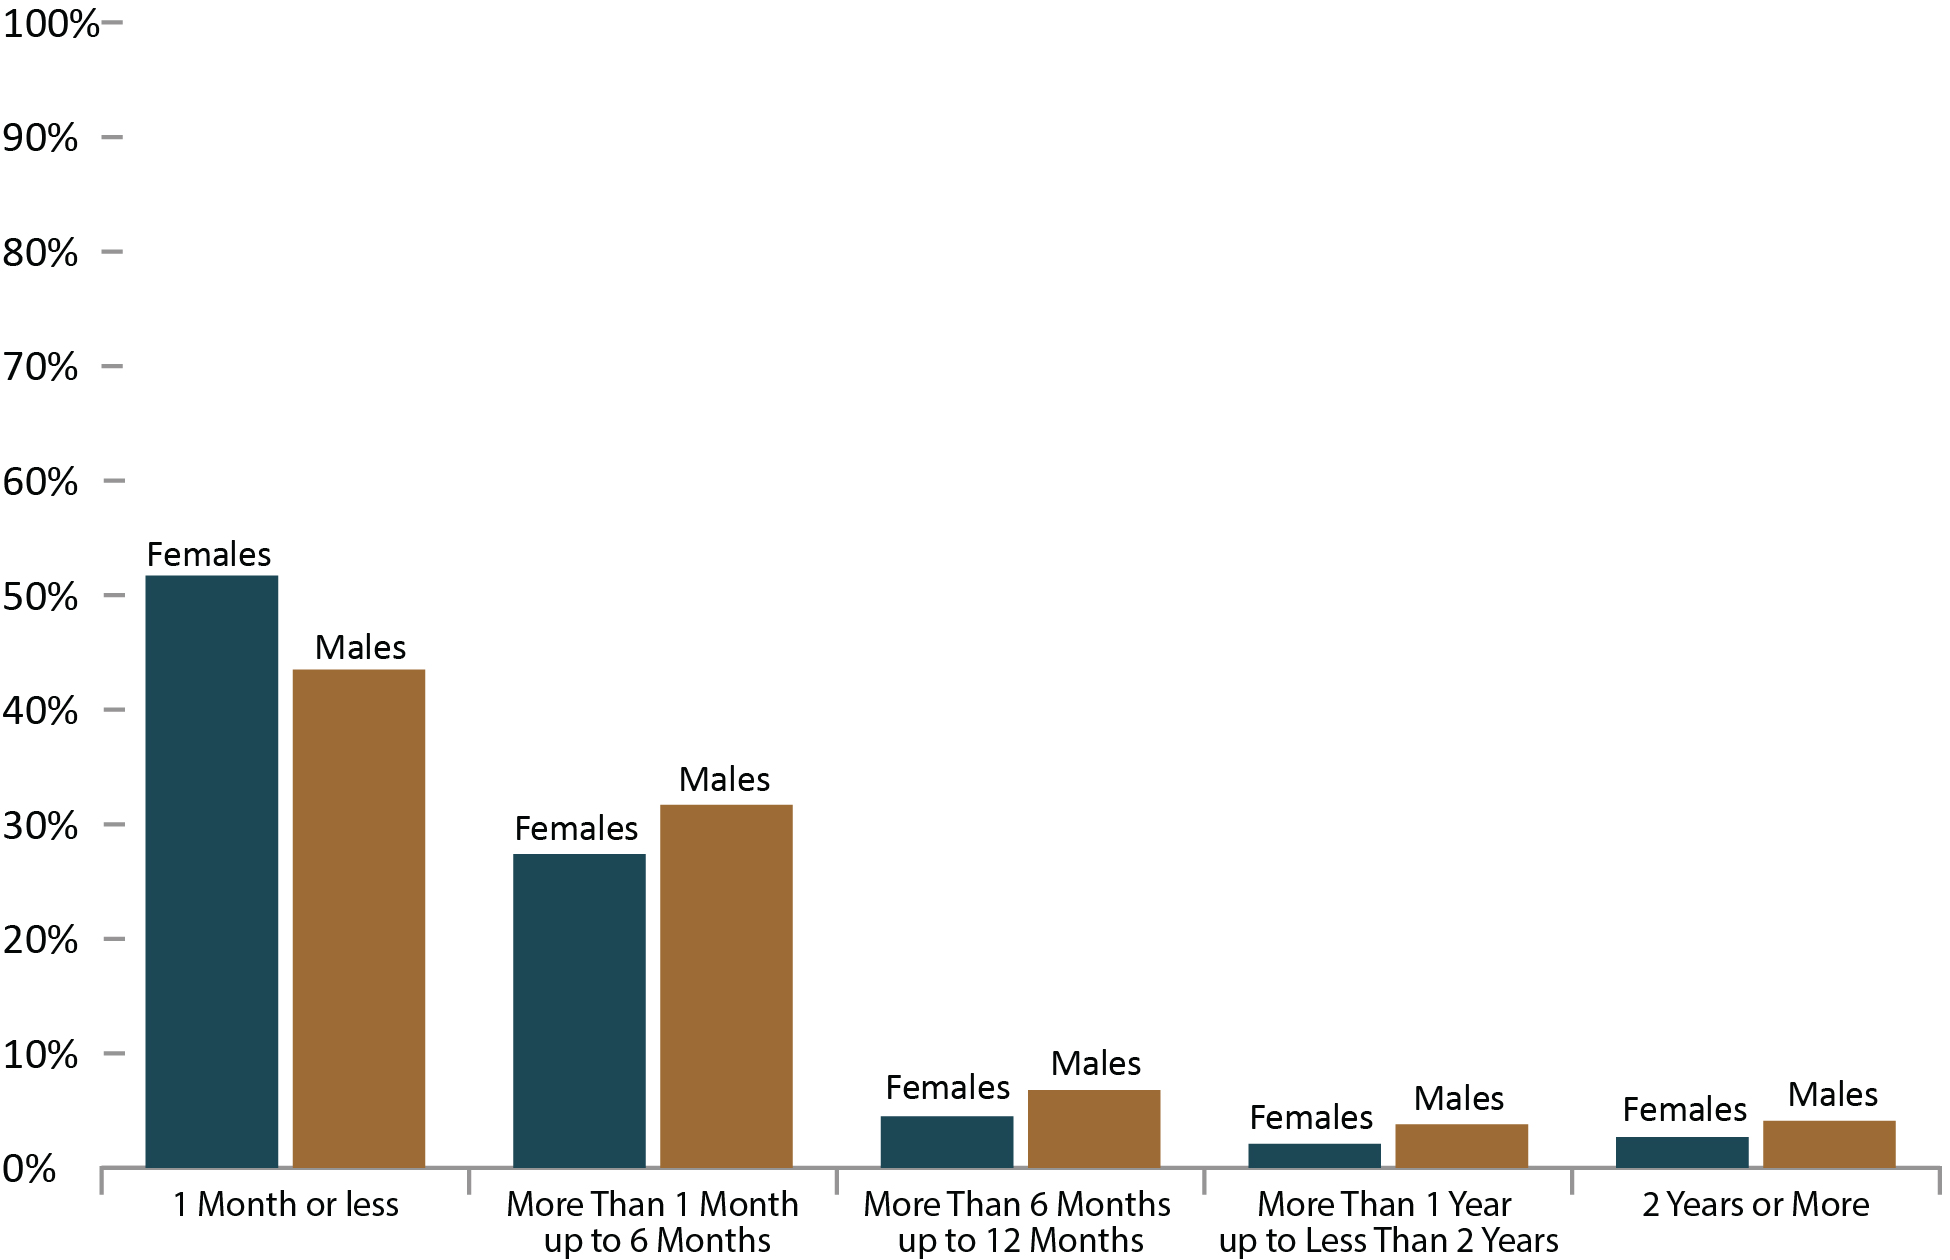
Image description
Bar graph showing the length of adult prison sentences ordered by the court by gender in the 2020 to 2021 fiscal year. Females accounted for slightly more of sentences of 1 month or less (51.7 percent) than males (43.5 percent). Males accounted for more sentences across all other sentence lengths than females, including: 1 month to 6 months; 6 months to 12 months; 1 year to 2 years; and 2 years or more. Full data are available immediately below.
Source: Table 35-10-0032-01, Integrated Criminal Court Survey, Canadian Centre for Justice and Community Safety Statistics, Statistics Canada.
- Just under half (41.3%) of all custodial sentences imposed by adult criminal courts were 1 month or less.
- Prison sentences for males tended to be longer than for females.
- 51.7% of females and 43.5% of males who were incarcerated following a guiltyFootnote * finding received a sentence of 1 month or less, and 79.1% of females and 75.2% of males received a sentence of 6 months or less.
| Length of prison sentence | 2016-17 | 2017-18 | 2018-19 | 2019-20 | 2020-21 |
|---|---|---|---|---|---|
| % | % | % | % | % | |
| 1 month or less | |||||
Females |
63.7 | 62.8 | 59.5 | 54.9 | 51.7 |
Males |
52.0 | 50.3 | 49.4 | 46.6 | 43.5 |
Total |
49.4 | 47.8 | 46.9 | 44.6 | 41.3 |
| More than 1 month up to 6 months | |||||
Females |
22.0 | 22.2 | 23.8 | 26.0 | 27.4 |
Males |
29.9 | 30.1 | 29.9 | 31.0 | 31.7 |
Total |
27.2 | 27.2 | 27.3 | 28.4 | 29.0 |
| More than 6 months up to 12 months | |||||
Females |
3.3 | 3.6 | 3.3 | 3.9 | 4.5 |
Males |
5.2 | 5.4 | 5.4 | 5.9 | 6.8 |
Total |
4.7 | 4.9 | 4.9 | 5.3 | 6.1 |
| More than 1 year up to less than 2 years | |||||
Females |
1.7 | 1.7 | 1.8 | 1.9 | 2.1 |
Males |
3.0 | 3.2 | 3.2 | 3.4 | 3.8 |
Total |
2.8 | 2.8 | 2.9 | 3.0 | 3.4 |
| 2 years or More | |||||
Females |
2.1 | 1.9 | 2.1 | 1.9 | 2.7 |
Males |
3.4 | 3.6 | 3.7 | 3.6 | 4.1 |
Total |
3.0 | 3.1 | 3.3 | 3.2 | 3.7 |
| Length unknown | |||||
Females |
7.2 | 7.8 | 9.6 | 11.4 | 11.7 |
Males |
6.5 | 7.4 | 8.3 | 9.6 | 10.0 |
Total |
12.9 | 14.1 | 14.8 | 15.5 | 16.5 |
Source: Table 35-10-0032-01, Integrated Criminal Court Survey, Canadian Centre for Justice and Community Safety Statistics, Statistics Canada.
Table A12 Notes
Total includes the following categories: Males, Females, Company, and Sex Unknown.
Length unknown includes indeterminate custody sentences. In some provinces/territories, particularly British Columbia, Saskatchewan, Quebec and New Brunswick, the unknown category may include guilty cases with custody where the custodial sentence ordered has already been served and the time remaining is equal to zero.
The concept of a case has changed to more closely reflect court processing. Statistics from the Integrated Criminal Court Survey used in this report should not be compared to editions of the Corrections and Conditional Release Statistical Overview prior to 2007.
Superior Court data are not reported to the Integrated Criminal Court Survey for Prince Edward Island, Quebec, Ontario, Manitoba and Saskatchewan. In addition, information from Quebec's municipal courts is not collected.
The Canadian Centre for Justice and Community Safety Statistics continues to make updates to the offence library used to classify offence data sent by the provinces and territories. These improvements have resulted in minor changes in the counts of charges and cases as well as the distributions by type of offence. Data presented have been revised to account for these updates.
Due to rounding, totals may not add up to 100 percent.
The table includes data from the most recent year available at the time of publication.
Reported year periods reflect fiscal years. A fiscal year runs from April 1 to March 31 of the following year.
The rate of youth charged
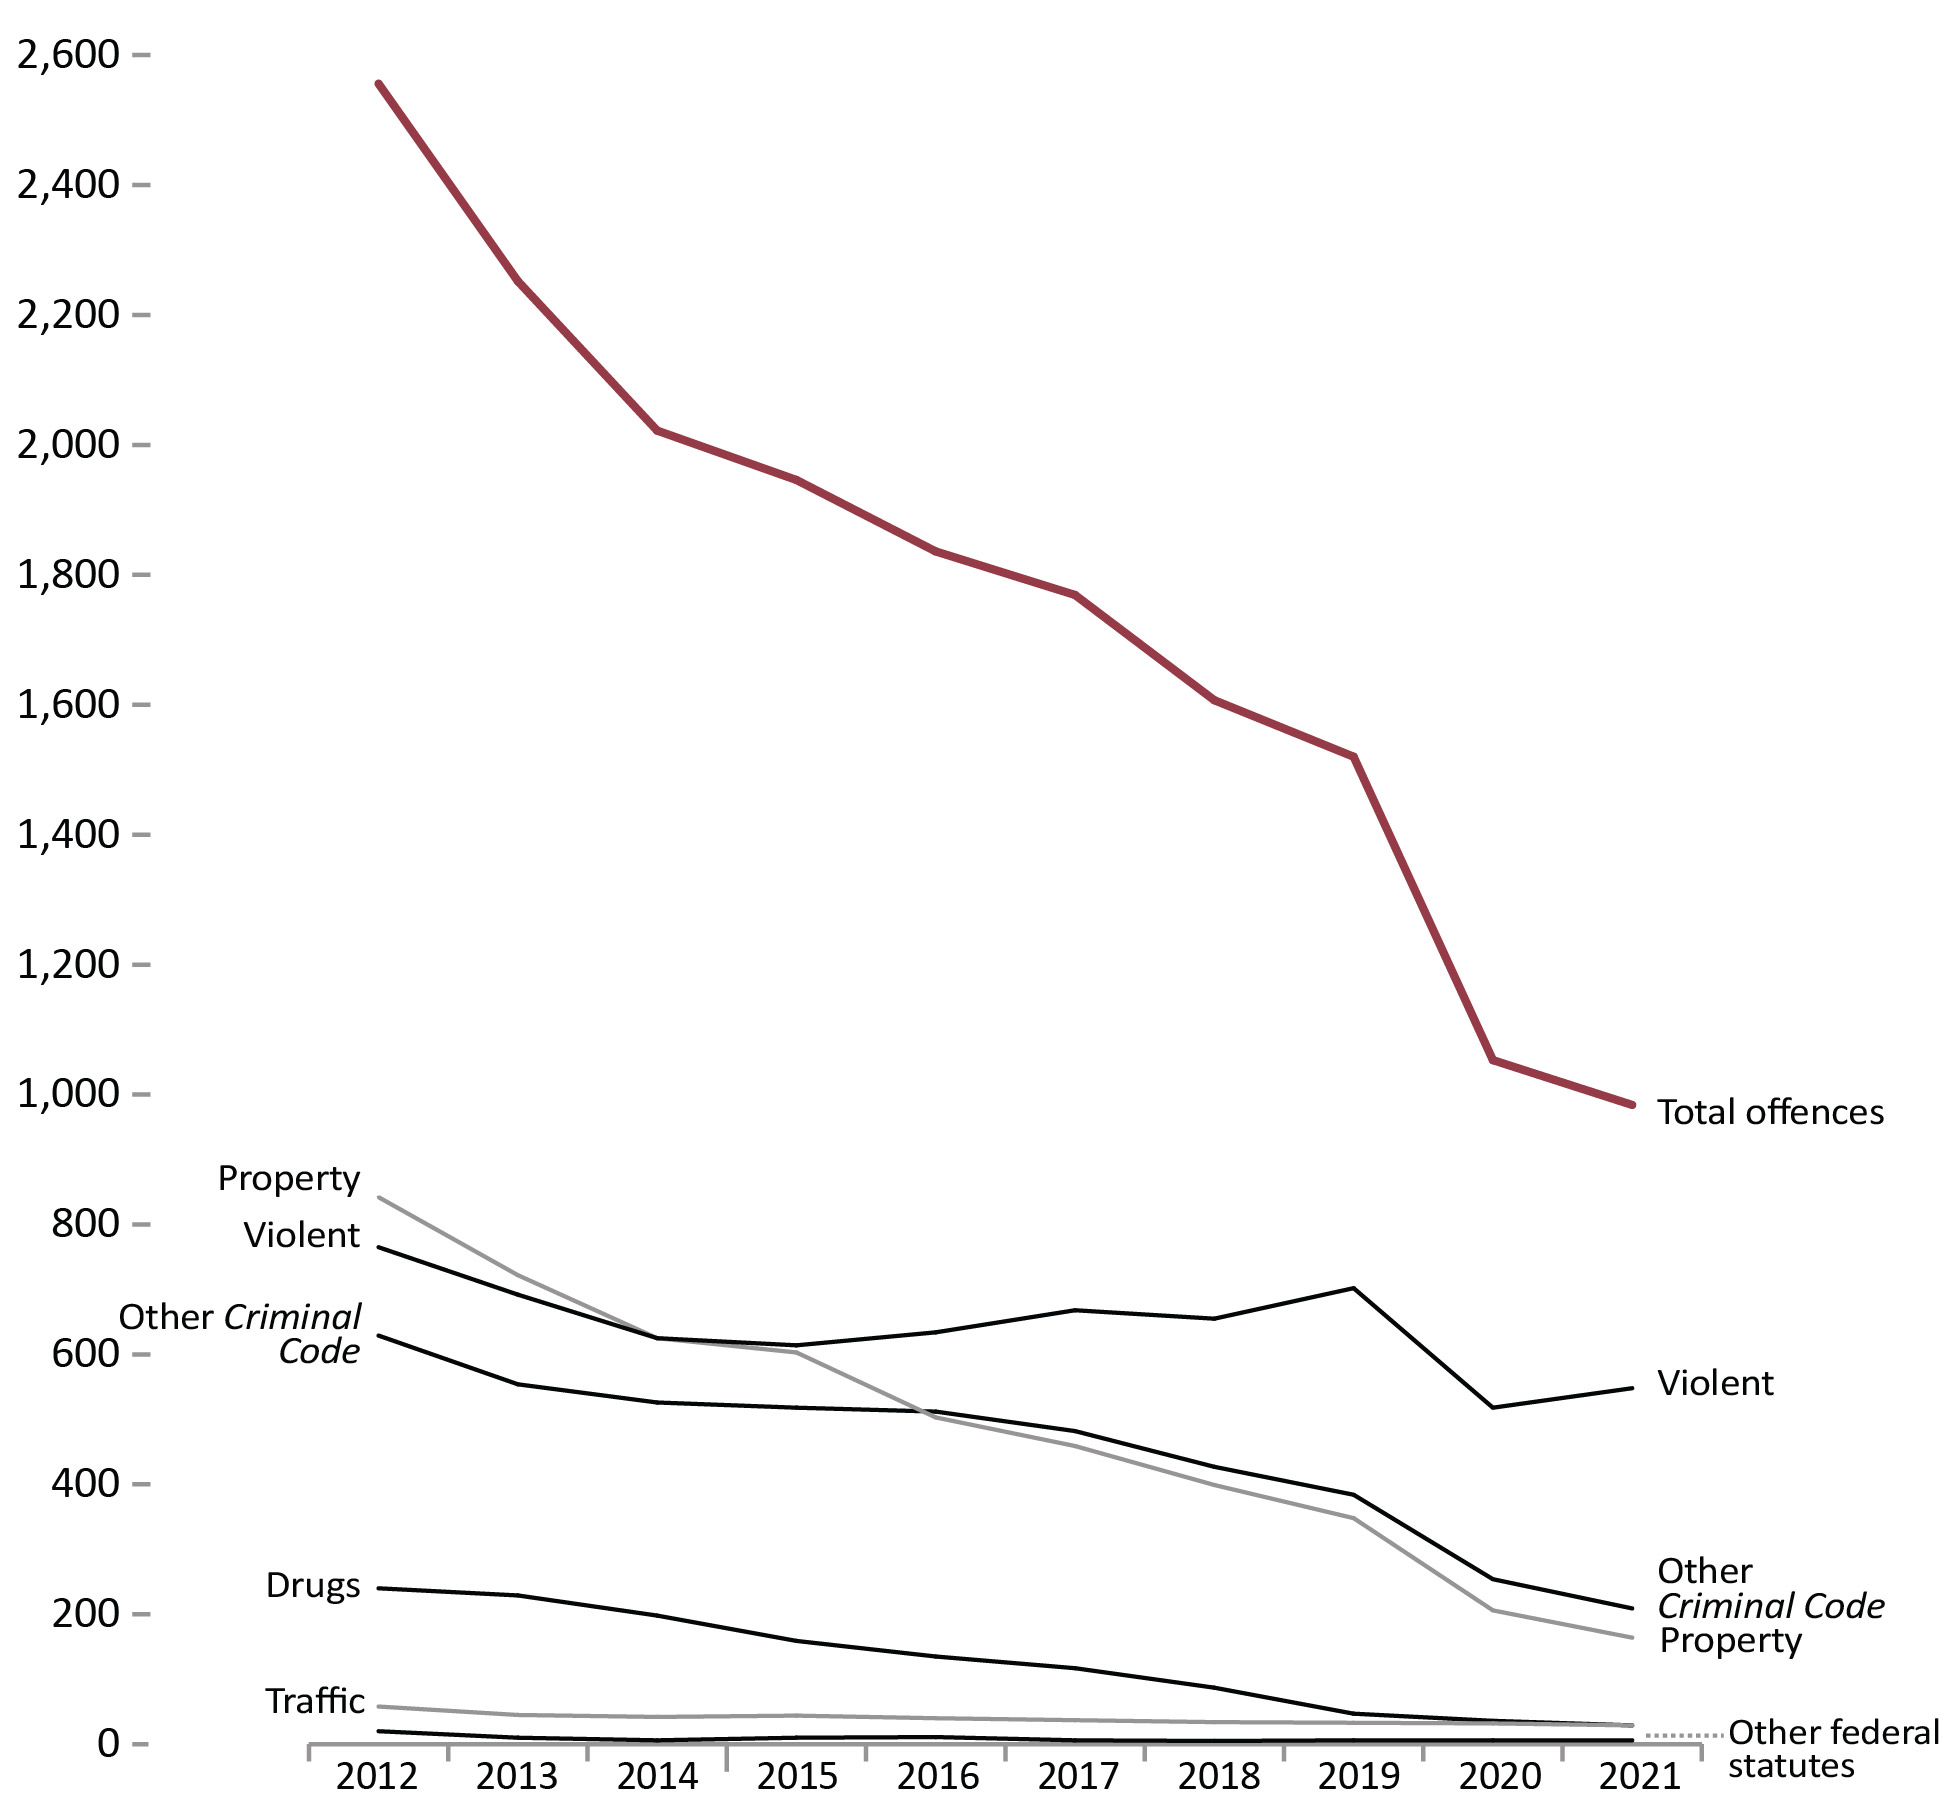
Image description
Line graph of the rate of youth charged with a criminal offence, by total offences, and by offence type, from calendar year 2012 to 2021. The rate of youth charged sharply decreased from 2,556 youth charged per 100,000 population in 2012 to 984 per 100,000 in 2021. The rates of youth charged in specific crime categories did not see such a sharp decline. All rates except that for violent crime and traffic offences steadily declined between 2012 and 2021. The rate of violent crime decreased from 765 youth charged per 100,000 in 2012 to a low of 614 per 100,000 in 2015, then it steadily increased to a peak of 702 per 100,00 in 2019, dropped again to 518 per 100,000 in 2020, before rising again to 548 per 100,000 in 2021. The rate of youth charged with traffic offences decreased steadily with only slight fluctuations from 58 per 100,000 in 2012 to 29 per 100,000 in 2021. From 2012 to 2021, the rate of youth charged with property offences went from around 842 youth charged per 100,000 population to close 164 per 100,000; other Criminal Code offences went from around 629 per 100,000 to 209 per 100,000; drug offences went from 240 per 100,000 to 29 per 100,000; total other federal statute offences declined from 20 per 100,000 to 6 per 100,000. Full data are available immediately below.
Source: Table 35-10-0177-01, Uniform Crime Reporting Survey, Canadian Centre for Justice and Community Safety Statistics, Statistics Canada.
- Since 2012, the rate of youth charged decreased by 61.5%. There was a decline of 6.5% between 2020 to 2021.
- Between 2017 to 2020 there was a 22.5% decrease in the rate of youth charged with a violent crime followed by a 5.7% increase between 2020 to 2021. The rate of youth charged with a violent crime is 18.0% lower in 2021 than in 2017.
- Between 2017 to 2020, there was a decrease in all crime categories, with the exception of other federal statutes, which remained the same. The largest decline was a 68.7% decline in charges for drug offences. The decline in youth charged across all crime categories continued between 2020 to 2021, with the exception of violent crime, which increased by 5.7%. The largest decline was a 20.5% decline in charges for property crime between 2020 to 2021.
Figure A13 Notes
Other Criminal Code offences (Other CC) includes administration of justice violations, weapons/firearms violations, counterfeit, possession of, accessing, making or distribution of child pornography and prostitution.
For criminal justice purposes, youth are defined under Canadian law as persons aged 12 to 17.
Rates are based on 100,000 youth population (12 to 17 years old).
Violent crimes include homicide, attempted murder, assault, sexual offences, abduction, extortion, robbery, firearms, and other violent offences such as uttering threats and criminal harassment. Property crimes include break and enter, motor vehicle theft, other theft, possession of stolen property, fraud, mischief and arson.
| Year | Violent | Property | Traffic | Other CC | Drugs | Total other fed. stat. | Total charged |
|---|---|---|---|---|---|---|---|
| 1998 | 994 | 2,500 | - | 870 | 226 | 4 | 4,595 |
| 1999 | 1,060 | 2,237 | - | 728 | 266 | 2 | 4,293 |
| 2000 | 1,136 | 2,177 | - | 760 | 317 | 4 | 4,393 |
| 2001 | 1,157 | 2,119 | - | 840 | 343 | 6 | 4,466 |
| 2002 | 1,102 | 2,009 | - | 793 | 337 | 6 | 4,247 |
| 2003 | 953 | 1,570 | - | 726 | 208 | 5 | 3,464 |
| 2004 | 918 | 1,395 | - | 691 | 230 | 5 | 3,240 |
| 2005 | 924 | 1,276 | - | 660 | 214 | 10 | 3,084 |
| 2006 | 917 | 1,216 | - | 680 | 240 | 16 | 3,068 |
| 2007 | 943 | 1,211 | 75 | 732 | 260 | 17 | 3,239 |
| 2008 | 909 | 1,130 | 74 | 730 | 267 | 19 | 3,130 |
| 2009 | 888 | 1,143 | 68 | 698 | 238 | 30 | 3,065 |
| 2010 | 860 | 1,035 | 62 | 669 | 255 | 31 | 2,912 |
| 2011 | 806 | 904 | 58 | 636 | 263 | 31 | 2,697 |
| 2012 | 765 | 842 | 58 | 629 | 240 | 20 | 2,556 |
| 2013 | 692 | 722 | 45 | 554 | 229 | 10 | 2,252 |
| 2014 | 625 | 625 | 42 | 526 | 198 | 6 | 2,022 |
| 2015 | 614 | 603 | 44 | 518 | 159 | 10 | 1,946 |
| 2016 | 634 | 503 | 40 | 512 | 135 | 11 | 1,836 |
| 2017 | 668 | 459 | 37 | 482 | 117 | 6 | 1,769 |
| 2018 | 655 | 399 | 34 | 427 | 87 | 5 | 1,607 |
| 2019 | 702 | 348 | 33 | 384 | 47 | 6 | 1,520 |
| 2020 | 518 | 206 | 32 | 254 | 36 | 6 | 1,053 |
| 2021 | 548 | 164 | 29 | 209 | 29 | 6 | 984 |
Source: Table 35-10-0177-01, Incident-based crime statistics, by detailed violations, Canada, provinces, territories and Census Metropolitan Areas
Table A13 Notes
Other Criminal Code offences (Other CC) includes administration of justice violations, weapons/firearms violations, counterfeit, possession of, accessing, making or distribution of child pornography and prostitution.
For criminal justice purposes, youth are defined under Canadian law as persons age 12 to 17.
Rates are based on 100,000 youth population (12 to 17 years old). Violent crimes include homicide, attempted murder, assault, sexual offences, abduction, extortion, robbery, firearms, and other violent offences such as uttering threats and criminal harassment. Property crimes include break and enter, motor vehicle theft, other theft, possession of stolen property, fraud, mischief and arson.
Criminal Code and other Federal Statute charges among youth
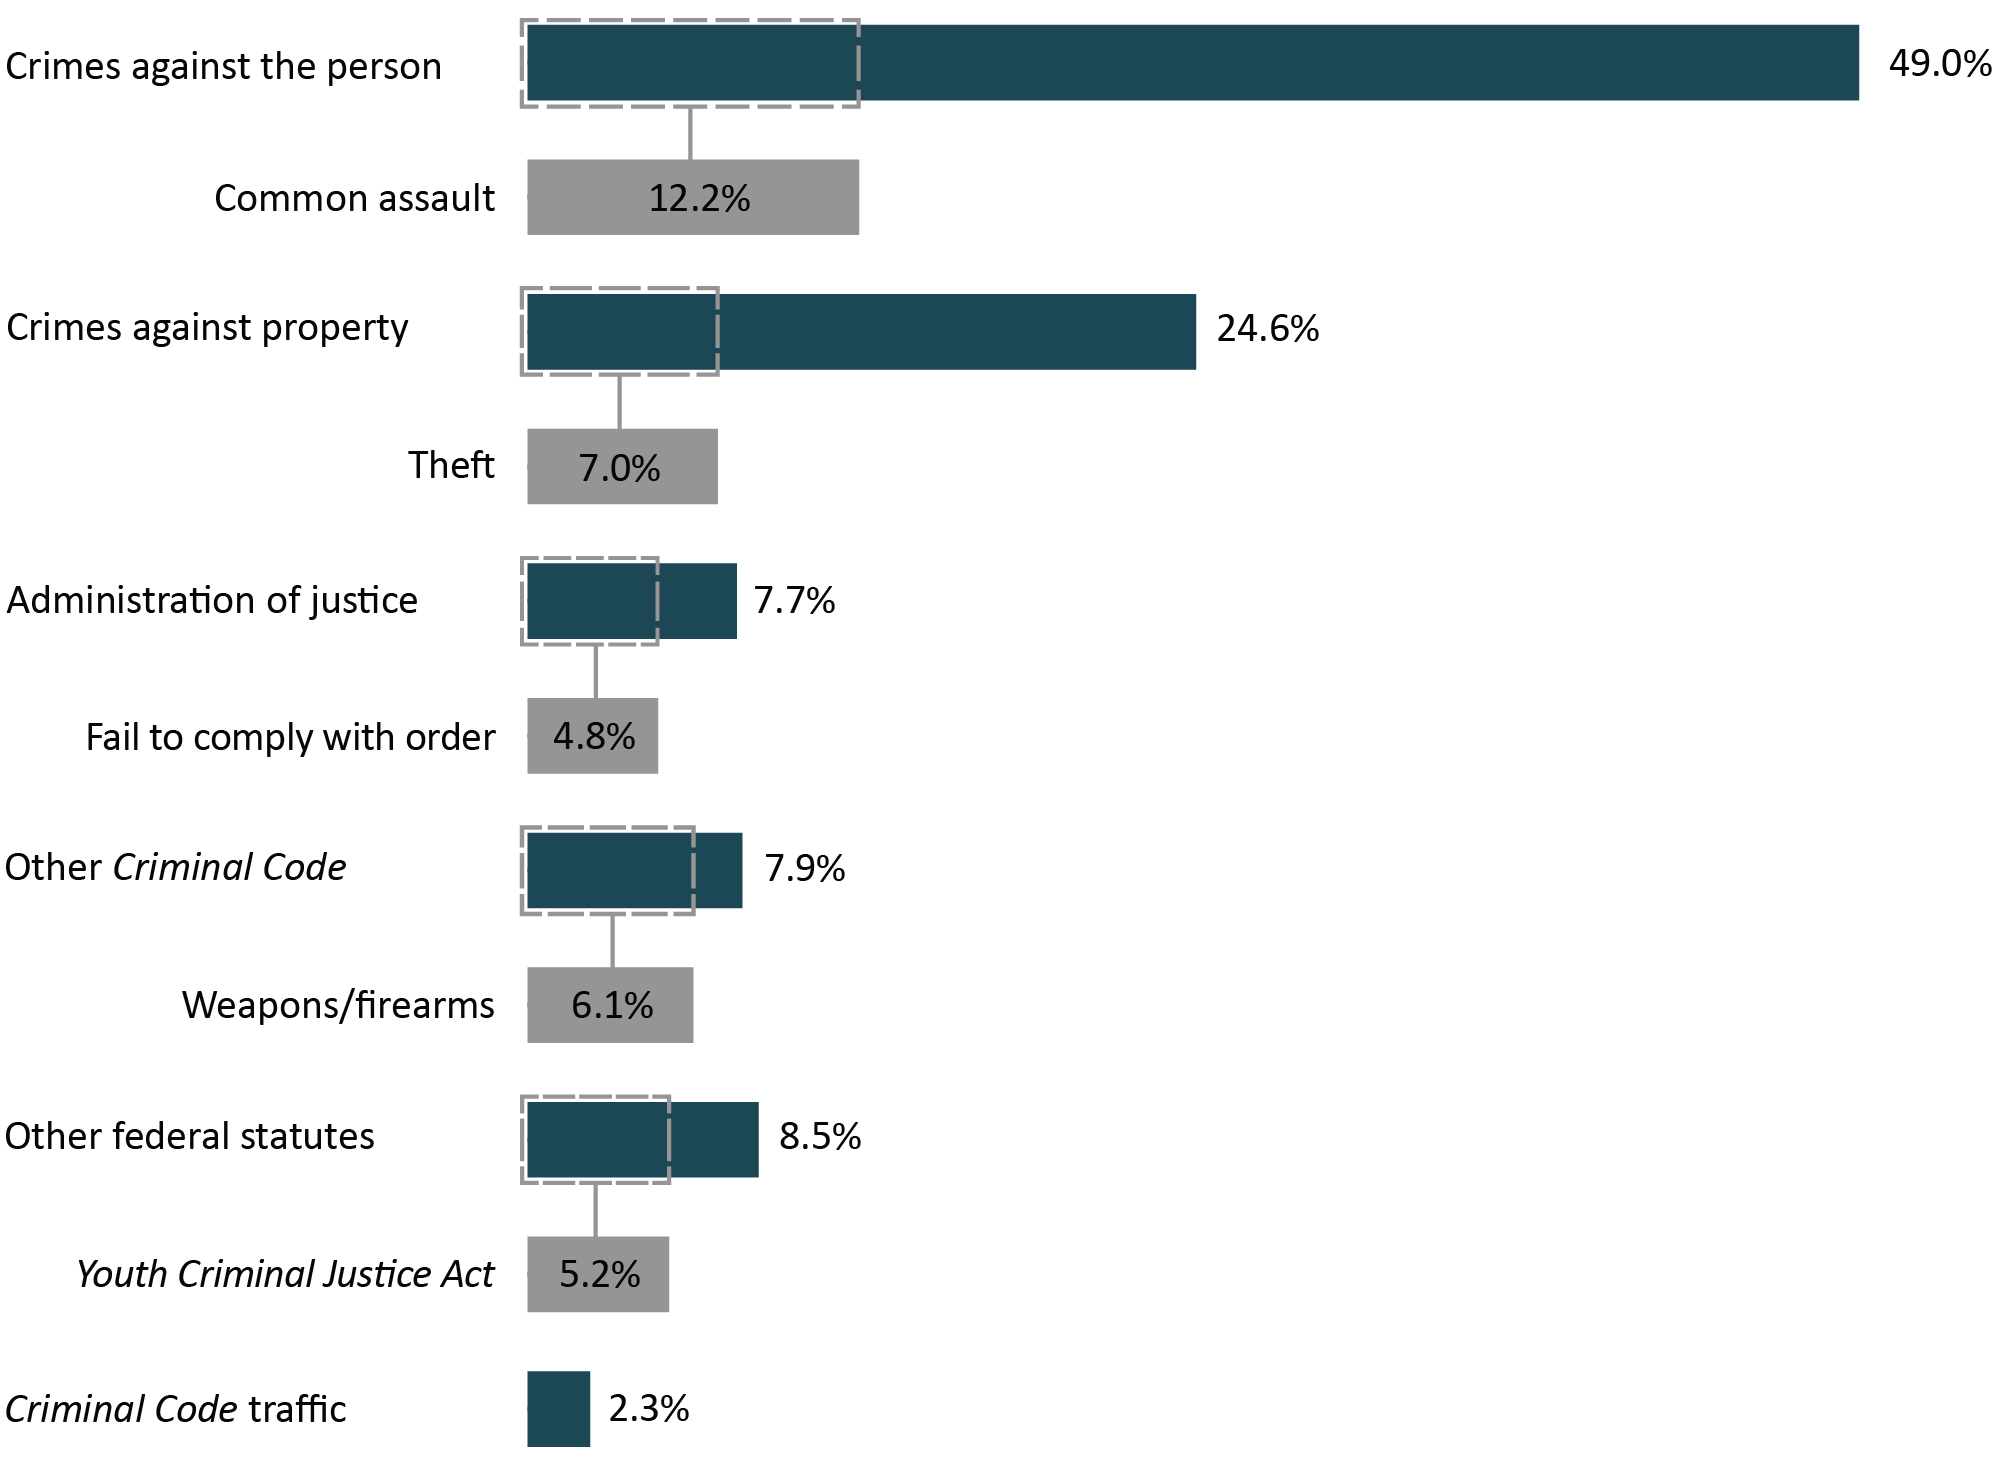
Image description
Bar graph showing the proportion of all Criminal Code and other federal statute charges among youth, highlighting the most common offence in the offence category, for the 2019 to 20 fiscal year. Crimes against the person represented 49.0 percent of total charges against youthful offenders, with common assault accounting for 12.2 percent of those charges. Crimes against property represented 24.6 percent of total charges, with theft accounting for 7.0 percent of those charges. Administration of justice represented 7.7 percent of total charges, with fail to comply with order accounting for 4.8 percent of those charges. Other Criminal Code represented 7.9 percent of total charges, with weapons or firearms accounting for 6.1 percent of those charges. Other federal statutes represented 8.5 percent of total charges, with Youth Criminal Justice Act accounting for 5.2 percent of those charges. Finally, Criminal Code traffic represented 2.3 percent of total charges. Full data are available immediately below.
Source: Table 35-10-0038-01, Integrated Criminal Court Survey, Canadian Centre for Justice and Community Safety Statistics, Statistics Canada.
- Common assault was the most frequent case in youth court (12.2%), followed by theft (7.0%).
- Administration of justice cases (offences related to case proceedings such as failure to appear in court, failure to comply with a court order, breach of probation, and unlawfully at large) accounted for 7.7% of cases completed in youth criminal courts.
Figure A14 Notes
Administration of justice includes the offences failure to appear, breach of probation, and unlawfully at large.
Other Criminal Code offences (Other CC) includes administration of justice violations, weapons/firearms violations, counterfeit, possession of, accessing, making or distribution of child pornography and prostitution.
Other federal statute offences refer to offences against Canadian federal statutes, such as Customs Act, Employment Insurance Act, Firearms Act, Food and Drugs Act (FDA), Income Tax Act, Controlled Drugs and Substances Act (CDSA) and Narcotic Control Act (NCA). This offence category excludes Criminal Code of Canada offences.
Youth Criminal Justice Act offences include failure to comply with a disposition or undertaking, contempt against youth court, assisting a youth to leave a place of custody and harbouring a youth unlawfully at large. Also included are similar offences under the Young Offenders Act, which preceded the Youth Criminal Justice Act.
The concept of a case has changed to more closely reflect court processing. Statistics from the Integrated Criminal Court Survey used in this report should not be compared to editions of the Corrections and Conditional Release Statistical Overview prior to 2007. A case is 1 or more charges against an accused person or corporation, processed by the courts at the same time, and where all of the charges in the case received a final disposition. Where a case has more than 1 charge, it is necessary to select a charge to represent the case. An offence is selected by applying 2 rules. First, the most serious decision rule is applied. In cases where 2 or more offences have the same decision, the most serious offence rule is applied. All charges are ranked according to an offence seriousness scale.
The Canadian Centre for Justice and Community Safety Statistics continues to make updates to the offence library used to classify offence data sent by the provinces and territories. These improvements have resulted in minor changes in the counts of charges and cases as well as the distributions by type of offence. Data presented have been revised to account for these updates.
The figure includes data from the most recent year available at the time of publication.
Reported year periods reflect fiscal years. A fiscal year runs from April 1 to March 31 of the following year.
| 2016-17 | 2017-18 | 2018-19 | 2019-20 | 2020-21 | |
|---|---|---|---|---|---|
| Crimes against the person | 9,930 | 10,586 | 10,183 | 10,380 | 7,228 |
Common assault |
2,642 | 2,923 | 2,651 | 2,824 | 1,798 |
Major assault |
2,149 | 2,154 | 2,076 | 2,174 | 1,546 |
Sexual assault/other sexual offences |
1,536 | 1,701 | 1,854 | 1,780 | 1,467 |
Robbery |
1,516 | 1,650 | 1,524 | 1,502 | 1,065 |
Homicide and attempted murder |
54 | 43 | 49 | 42 | 36 |
Other crimes against the person |
2,021 | 2,115 | 2,029 | 1,993 | 1,302 |
| Crimes against property | 9,627 | 8,609 | 7,211 | 6,126 | 3,624 |
Theft |
3,280 | 2,822 | 2,397 | 1,966 | 1,027 |
Break and enter |
2,193 | 1,854 | 1,502 | 1,155 | 750 |
Mischief |
1,819 | 1,676 | 1,460 | 1,289 | 890 |
Possession of stolen property |
1,621 | 1,490 | 1,183 | 1,081 | 526 |
Fraud |
423 | 405 | 385 | 386 | 258 |
Other crimes against property |
291 | 362 | 284 | 249 | 173 |
| Administration of justice | 3,112 | 2,528 | 2,155 | 1,785 | 1,135 |
Failure to comply with order |
2,066 | 1,590 | 1,370 | 1,078 | 715 |
Other administration of justice |
1,046 | 938 | 785 | 707 | 420 |
| Other Criminal Code | 1,876 | 1,875 | 1,650 | 1,717 | 1,166 |
Weapons/firearms |
1,408 | 1,433 | 1,293 | 1,368 | 901 |
Residual Criminal Code |
416 | 406 | 331 | 315 | 240 |
Disturbing the peace |
50 | 33 | 26 | 33 | 23 |
Prostitution |
2 | 3 | 0 | 1 | 2 |
| Criminal Code traffic | 554 | 490 | 426 | 364 | 346 |
| Other federal statutes | 4,609 | 3,831 | 3,031 | 2,077 | 1,255 |
Drug possession |
1,129 | 930 | 703 | 259 | 144 |
Other drug offences |
653 | 540 | 461 | 334 | 236 |
Youth Criminal Justice Act |
2,701 | 2,317 | 1,837 | 1,387 | 766 |
Residual federal statutes |
126 | 44 | 30 | 97 | 109 |
| Total | 29,708 | 27,919 | 24,656 | 22,449 | 14,754 |
Source: Table 35-10-0038-01, Integrated Criminal Court Survey, Canadian Centre for Justice and Community Safety Statistics, Statistics Canada.
Table A14 Notes
Administration of justice includes the offences failure to appear, breach of probation, and unlawfully at large.
Other Criminal Code offences (Other CC) includes administration of justice violations, weapons/firearms violations, counterfeit, possession of, accessing, making or distribution of child pornography and prostitution.
Other federal statute offences refer to offences against Canadian federal statutes, such as Customs Act, Employment Insurance Act, Firearms Act, Food and Drugs Act (FDA), Income Tax Act, Controlled Drugs and Substances Act (CDSA) and Narcotic Control Act (NCA). This offence category excludes Criminal Code of Canada offences.
Youth Criminal Justice Act offences include failure to comply with a disposition or undertaking, contempt against youth court, assisting a youth to leave a place of custody and harbouring a youth unlawfully at large. Also included are similar offences under the Young Offenders Act, which preceded the Youth Criminal Justice Act.
The concept of a case has changed to more closely reflect court processing. Statistics from the Integrated Criminal Court Survey used in this report should not be compared to editions of the Corrections and Conditional Release Statistical Overview prior to 2007. A case is 1 or more charges against an accused person or corporation, processed by the courts at the same time, and where all of the charges in the case received a final disposition. Where a case has more than 1 charge, it is necessary to select a charge to represent the case. An offence is selected by applying 2 rules. First, the most serious decision rule is applied. In cases where 2 or more offences have the same decision, the most serious offence rule is applied. All charges are ranked according to an offence seriousness scale.
The Canadian Centre for Justice and Community Safety Statistics continues to make updates to the offence library used to classify offence data sent by the provinces and territories. These improvements have resulted in minor changes in the counts of charges and cases as well as the distributions by type of offence. Data presented have been revised to account for these updates.
The table includes data from the most recent year available at the time of publication.
Reported year periods reflect fiscal years. A fiscal year runs from April 1 to March 31 of the following year.
Youth criminal court sentences: 5-year trend
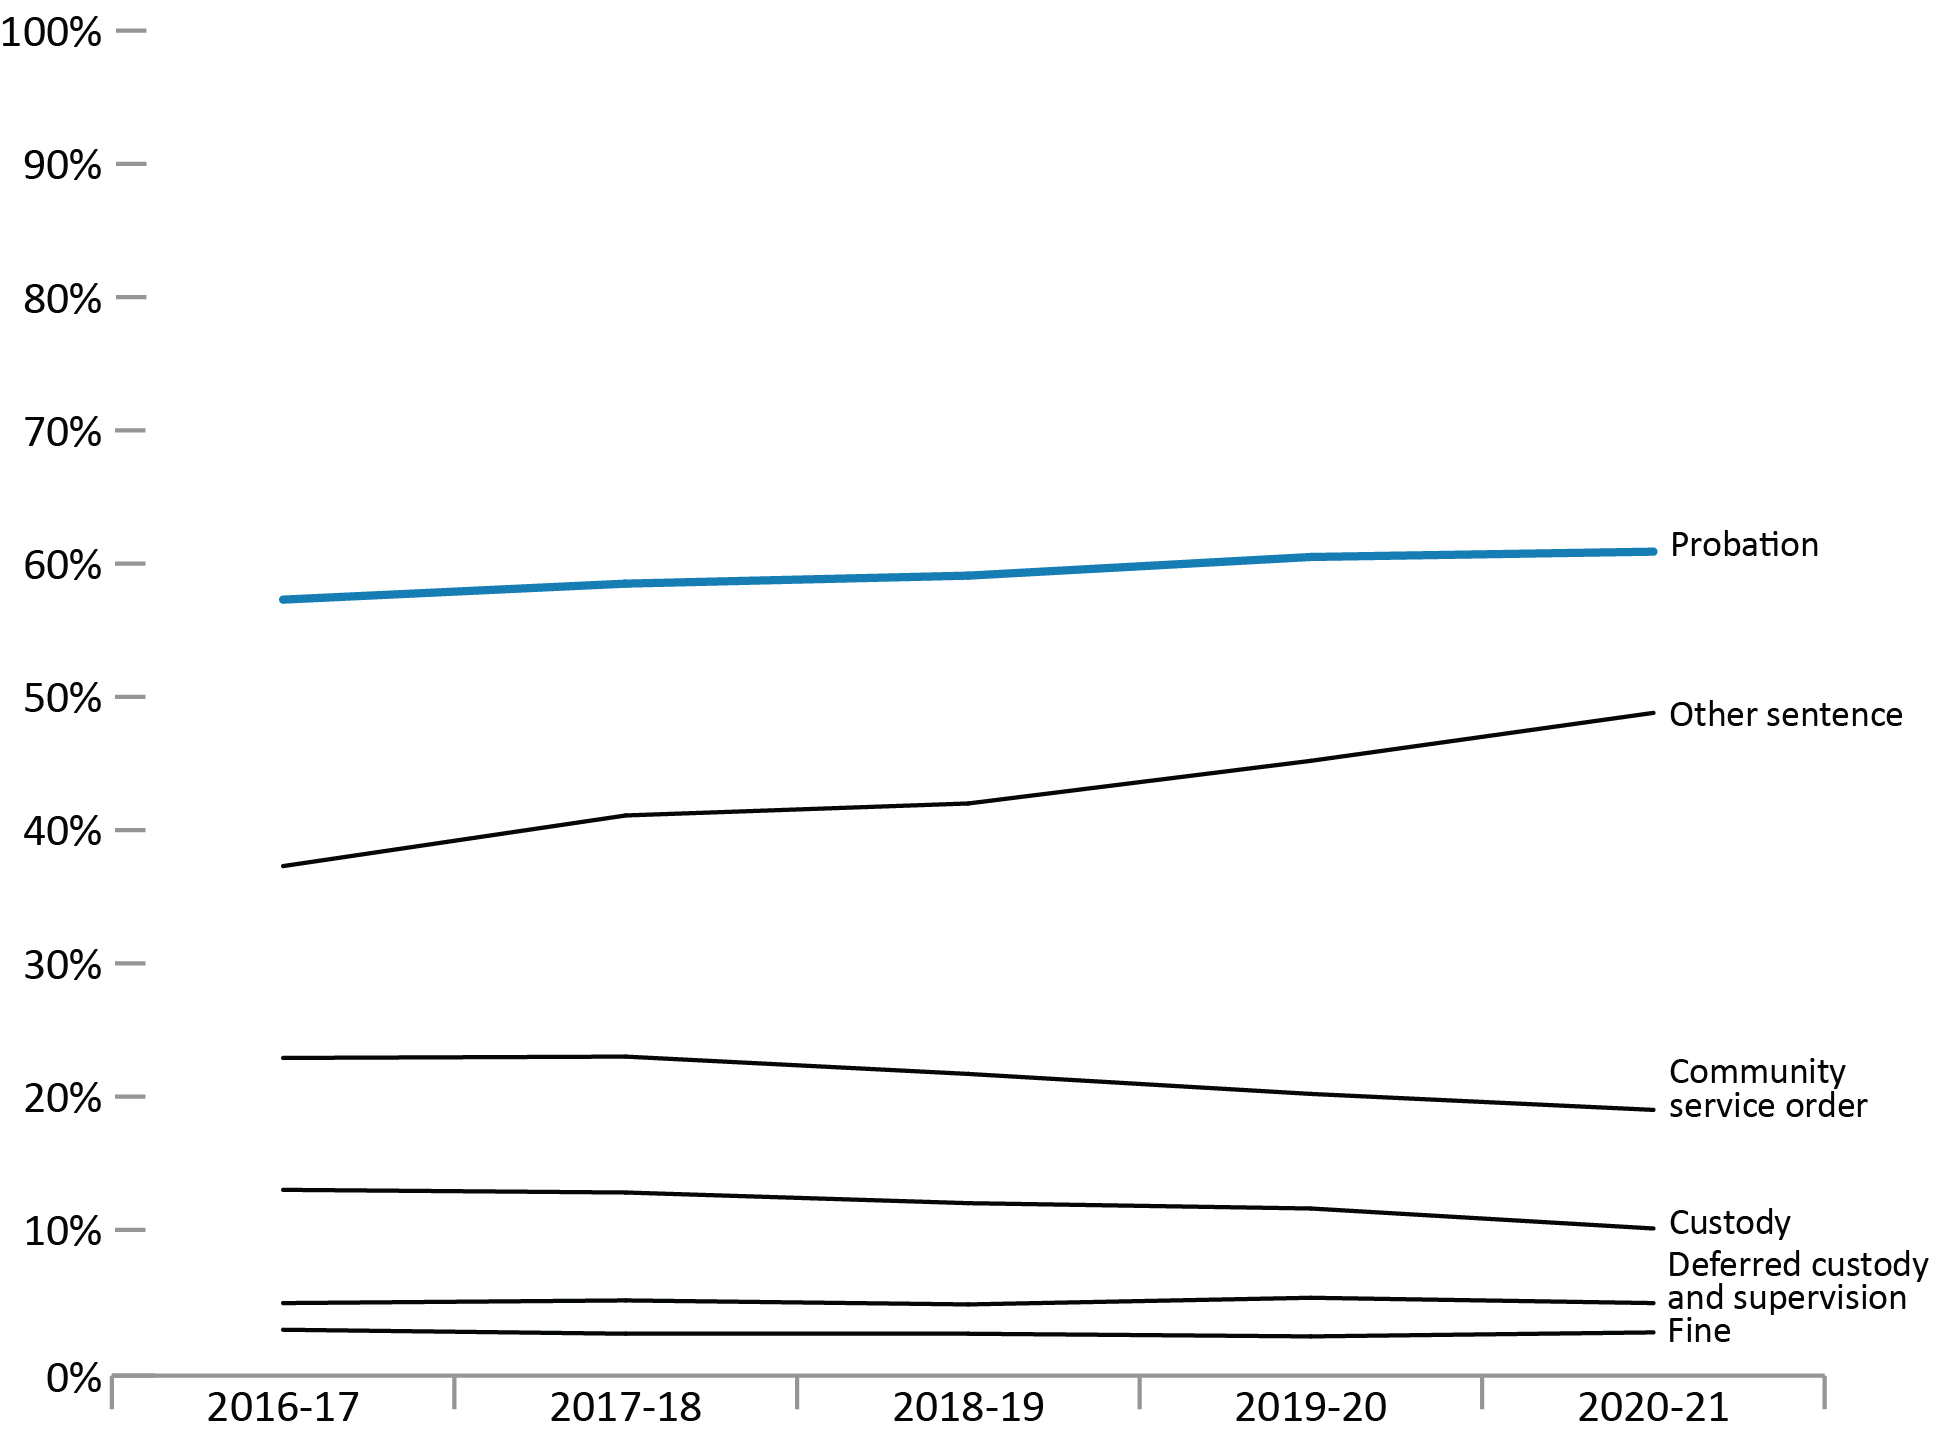
Image description
Line graph showing the percentage of sentence types received in youth criminal court from fiscal year 2016 to 2017 until fiscal year 2020 to 2021. Deferred custody and supervision sentences as well as fine sentences remained stable over the five year period, with deferred custody and supervision sentences fluctuating slightly from 4.4 to 4.9 percent and fine sentences from 2.9 to 2.0 percent. Custody sentences represented 15.5 percent of sentences in fiscal year 2016 to 2017, gradually decreasing to 11.6 percent of sentences in fiscal year 2020 to 2021. Community service order sentences began at 22.4 percent in fiscal year 2016 to 2017, fluctuating slightly each year until a proportion of 20.2 percent in fiscal year 2020 to 2021. Other sentences began at 36.7 percent in fiscal year 2016 to 2017 and gradually increased to a peak of 45.2 percent in fiscal year 2020 to 2021. Probation sentences represented the highest proportion of sentence types received in youth criminal court over the five year period; increasing steadily from 56.3 percent in fiscal year 2016 to 2017 to 60.5 percent in fiscal year 2020 to 2021. Full data are available immediately below.
Source: Table 35-10-0041-01, Integrated Criminal Court Survey, Canadian Centre for Justice and Community Safety Statistics, Statistics Canada.
- Probation has consistently been the most common sentence in youth criminal court. In 2020-21, 60.9% of youth found guilty were sentenced to probation.
- Custody sentences have been declining in the past 5 years (from 2016-17 to 2020-21) with this decline more pronounced among females than males. In 2020-21, 10.1% of all guilty cases resulted in the youth being sentenced to custody. Among females, 4.3% of guilty cases resulted in custody sentences and among males, 10.9% of guilty cases resulted in a custody sentence.
Figure A15 Notes
Other sentence includes absolute discharge, restitution, prohibition, seizure, forfeiture, compensation, pay purchaser, essays, apologies, counselling programs and conditional discharge, conditional sentence, intensive support and supervision, attendance at non-residential program(s) and reprimand. This category also includes intensive support and supervision, attendance at non-residential program(s) and reprimand where sentencing data under the Youth Criminal Justice Act are not available.
Cases can have more than 1 sentence. Therefore, sanctions are not mutually exclusive and will not add to 100%. For all sentencing tables, data are for cases with a guilty finding only. Sentencing information is not available for a small proportion of guilty cases (i.e., approximately 3%, overall). For all sentencing tables, data are for cases with a guilty finding only and for which sentencing information is reported.
The concept of a case has changed to more closely reflect court processing. Statistics from the Integrated Criminal Court Survey used in this report should not be compared to editions of the Corrections and Conditional Release Statistical Overview prior to 2007.
The figure includes data from the most recent year available at the time of publication.
Reported year periods reflect fiscal years. A fiscal year runs from April 1 to March 31 of the following year.
| Type of sentence | Sex | Fiscal year | ||||
|---|---|---|---|---|---|---|
| 2016-17 | 2017-18 | 2018-19 | 2019-20 | 2020-21 | ||
| % | % | % | % | % | ||
| Probation | Female | 54.1 | 54.7 | 51.7 | 53.2 | 53.7 |
| Male | 58.8 | 59.9 | 60.5 | 60.6 | 62.1 | |
| Total | 56.3 | 57.3 | 58.5 | 59.1 | 60.5 | |
| Custody | Female | 11.9 | 7.5 | 8.9 | 6.3 | 4.7 |
| Male | 16.5 | 13.7 | 13.5 | 13.4 | 12.8 | |
| Total | 15.5 | 13.0 | 12.8 | 12.0 | 11.6 | |
| Community service order | Female | 20.9 | 21.9 | 21.6 | 21.4 | 19.0 |
| Male | 24.4 | 24.9 | 24.2 | 22.7 | 21.7 | |
| Total | 22.4 | 22.9 | 23.0 | 21.7 | 20.2 | |
| Fine | Female | 2.9 | 2.4 | 2.0 | 2.3 | 1.6 |
| Male | 2.9 | 2.5 | 2.3 | 2.1 | 1.9 | |
| Total | 2.9 | 2.5 | 2.2 | 2.2 | 2.0 | |
| Deferred custody and supervision | Female | 3.9 | 3.3 | 3.4 | 3.1 | 3.7 |
| Male | 4.7 | 4.8 | 5.3 | 4.9 | 5.3 | |
| Total | 4.4 | 4.5 | 4.7 | 4.4 | 4.9 | |
| Other sentence | Female | 37.7 | 38.5 | 41.7 | 41.6 | 43.8 |
| Male | 39.8 | 40.6 | 42.4 | 43.0 | 46.5 | |
| Total | 36.7 | 37.3 | 41.1 | 42.0 | 45.2 | |
Source: Table 35-10-0041-01, Integrated Criminal Court Survey, Canadian Centre for Justice and Community Safety Statistics, Statistics Canada.
Table A15 Notes
Other sentence includes absolute discharge, restitution, prohibition, seizure, forfeiture, compensation, pay purchaser, essays, apologies, counselling programs and conditional discharge, conditional sentence, intensive support and supervision, attendance at non-residential program(s) and reprimand. This category also includes intensive support and supervision, attendance at non-residential program(s) and reprimand where sentencing data under the Youth Criminal Justice Act are not available.
Cases can have more than 1 sentence. Therefore, sanctions are not mutually exclusive and will not add to 100%. For all sentencing tables, data are for cases with a guilty finding only. Sentencing information is not available for a small proportion of guilty cases (i.e., approximately 3%, overall). For all sentencing tables, data are for cases with a guilty finding only and for which sentencing information is reported.
The concept of a case has changed to more closely reflect court processing. Statistics from the Integrated Criminal Court Survey used in this report should not be compared to editions of the Corrections and Conditional Release Statistical Overview prior to 2007.
The table includes data from the most recent year available at the time of publication.
Reported year periods reflect fiscal years. A fiscal year runs from April 1 to March 31 of the following year.
Youth criminal court sentences for most serious sentence: 5-year trend
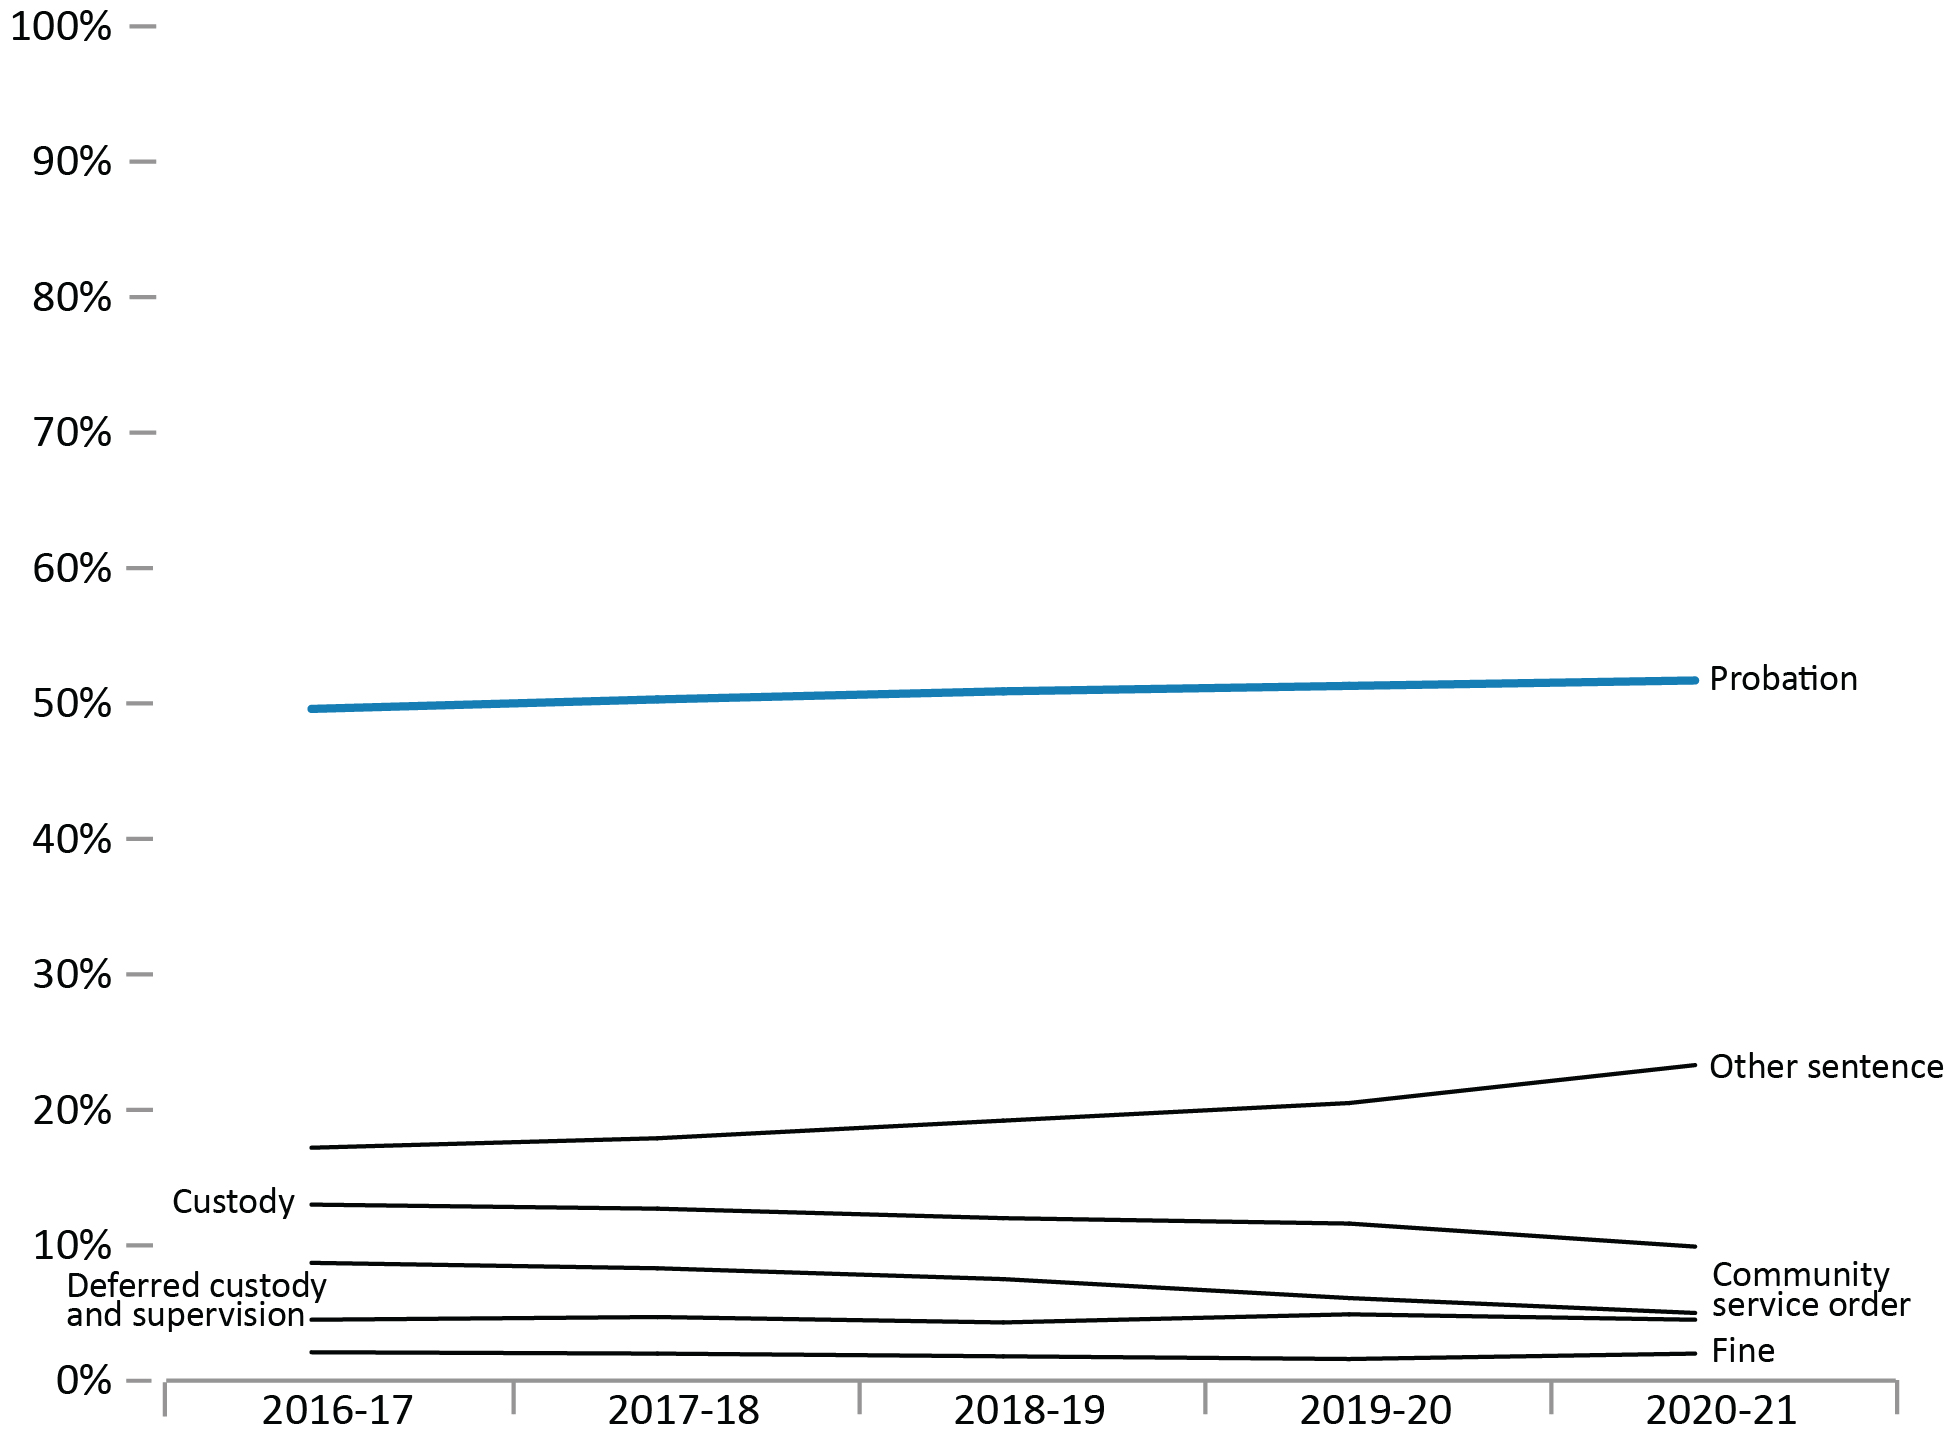
Image description
Line graph showing the percentage of youth criminal court sentences for most serious sentence from fiscal year 2016 to 2017 until fiscal year 2020 to 2021. Deferred custody and supervision sentences as well as fine sentences remained stable over the five year period, with deferred custody and supervision sentences fluctuating slightly between 4.5 and 4.9 percent and fine sentences between 1.6 and 2.1 percent. Community service order sentences began at 8.7 percent in fiscal year 2016 to 2017, steadily decreasing to 5.0 percent in fiscal year 2020 to 2021. Custody sentences represented 13.0 percent of sentences in fiscal year 2016 to 2017, steadily decreasing to 9.9 percent of sentences in fiscal year 2020 to 2021. Other sentences began at 17.2 percent in fiscal year 2016 to 2017 and steadily increased to a peak of 23.3 percent in fiscal year 2020 to 2021. Probation sentences represented the highest proportion of sentence types received in youth criminal court over the five year period; increasing gradually from 49.6 percent in fiscal year 2016 to 2017 to 51.7 percent in fiscal year 2020 to 2021. Full data are available immediately below.
Source: Table 35-10-0042-01, Integrated Criminal Court Survey, Canadian Centre for Justice and Community Safety Statistics, Statistics Canada.
- In 2020-21, 51.7% of youth found guilty were given probation as the most serious sentence. This rate has remained relatively stable since the implementation of the Youth Criminal Justice Act in April 2003.
- Of the Youth Criminal Justice Act sentences, deferred custody and supervision orders were the least frequent sentences (4.5%).
| Type of sentence | Sex | Fiscal year | ||||
|---|---|---|---|---|---|---|
| 2016-17 | 2017-18 | 2018-19 | 2019-20 | 2020-21 | ||
| % | % | % | % | % | ||
| Probation | Female | 50.1 | 47.8 | 49.2 | 49.0 | 47.2 |
| Male | 50.4 | 50.9 | 51.1 | 51.6 | 53.2 | |
| Total | 49.6 | 50.3 | 50.9 | 51.3 | 51.7 | |
| Custody | Female | 7.5 | 8.9 | 6.3 | 4.7 | 4.3 |
| Male | 13.6 | 13.5 | 13.3 | 12.7 | 10.7 | |
| Total | 13.0 | 12.7 | 12.0 | 11.6 | 9.9 | |
| Community service order | Female | 9.2 | 9.2 | 8.4 | 7.6 | 7.0 |
| Male | 8.1 | 7.3 | 6.4 | 5.3 | 4.7 | |
| Total | 8.7 | 8.3 | 7.5 | 6.1 | 5.0 | |
| Deferred custody and supervision | Female | 3.3 | 3.4 | 3.1 | 3.7 | 3.4 |
| Male | 4.8 | 5.2 | 4.8 | 5.3 | 4.7 | |
| Total | 4.5 | 4.7 | 4.3 | 4.9 | 4.5 | |
| Fine | Female | 2.2 | 2.0 | 2.1 | 1.3 | 2.0 |
| Male | 2.1 | 2.0 | 1.7 | 1.7 | 1.9 | |
| Total | 2.1 | 2.0 | 1.8 | 1.6 | 2.0 | |
| Other sentence | Female | 20.8 | 22.8 | 24.4 | 27.4 | 31.2 |
| Male | 16.1 | 17.3 | 18.7 | 19.7 | 21.5 | |
| Total | 17.2 | 17.9 | 19.2 | 20.5 | 23.3 | |
Source: Table 35-10-0042-01, Integrated Criminal Court Survey, Canadian Centre for Justice and Community Safety Statistics, Statistics Canada.
International incarceration rates
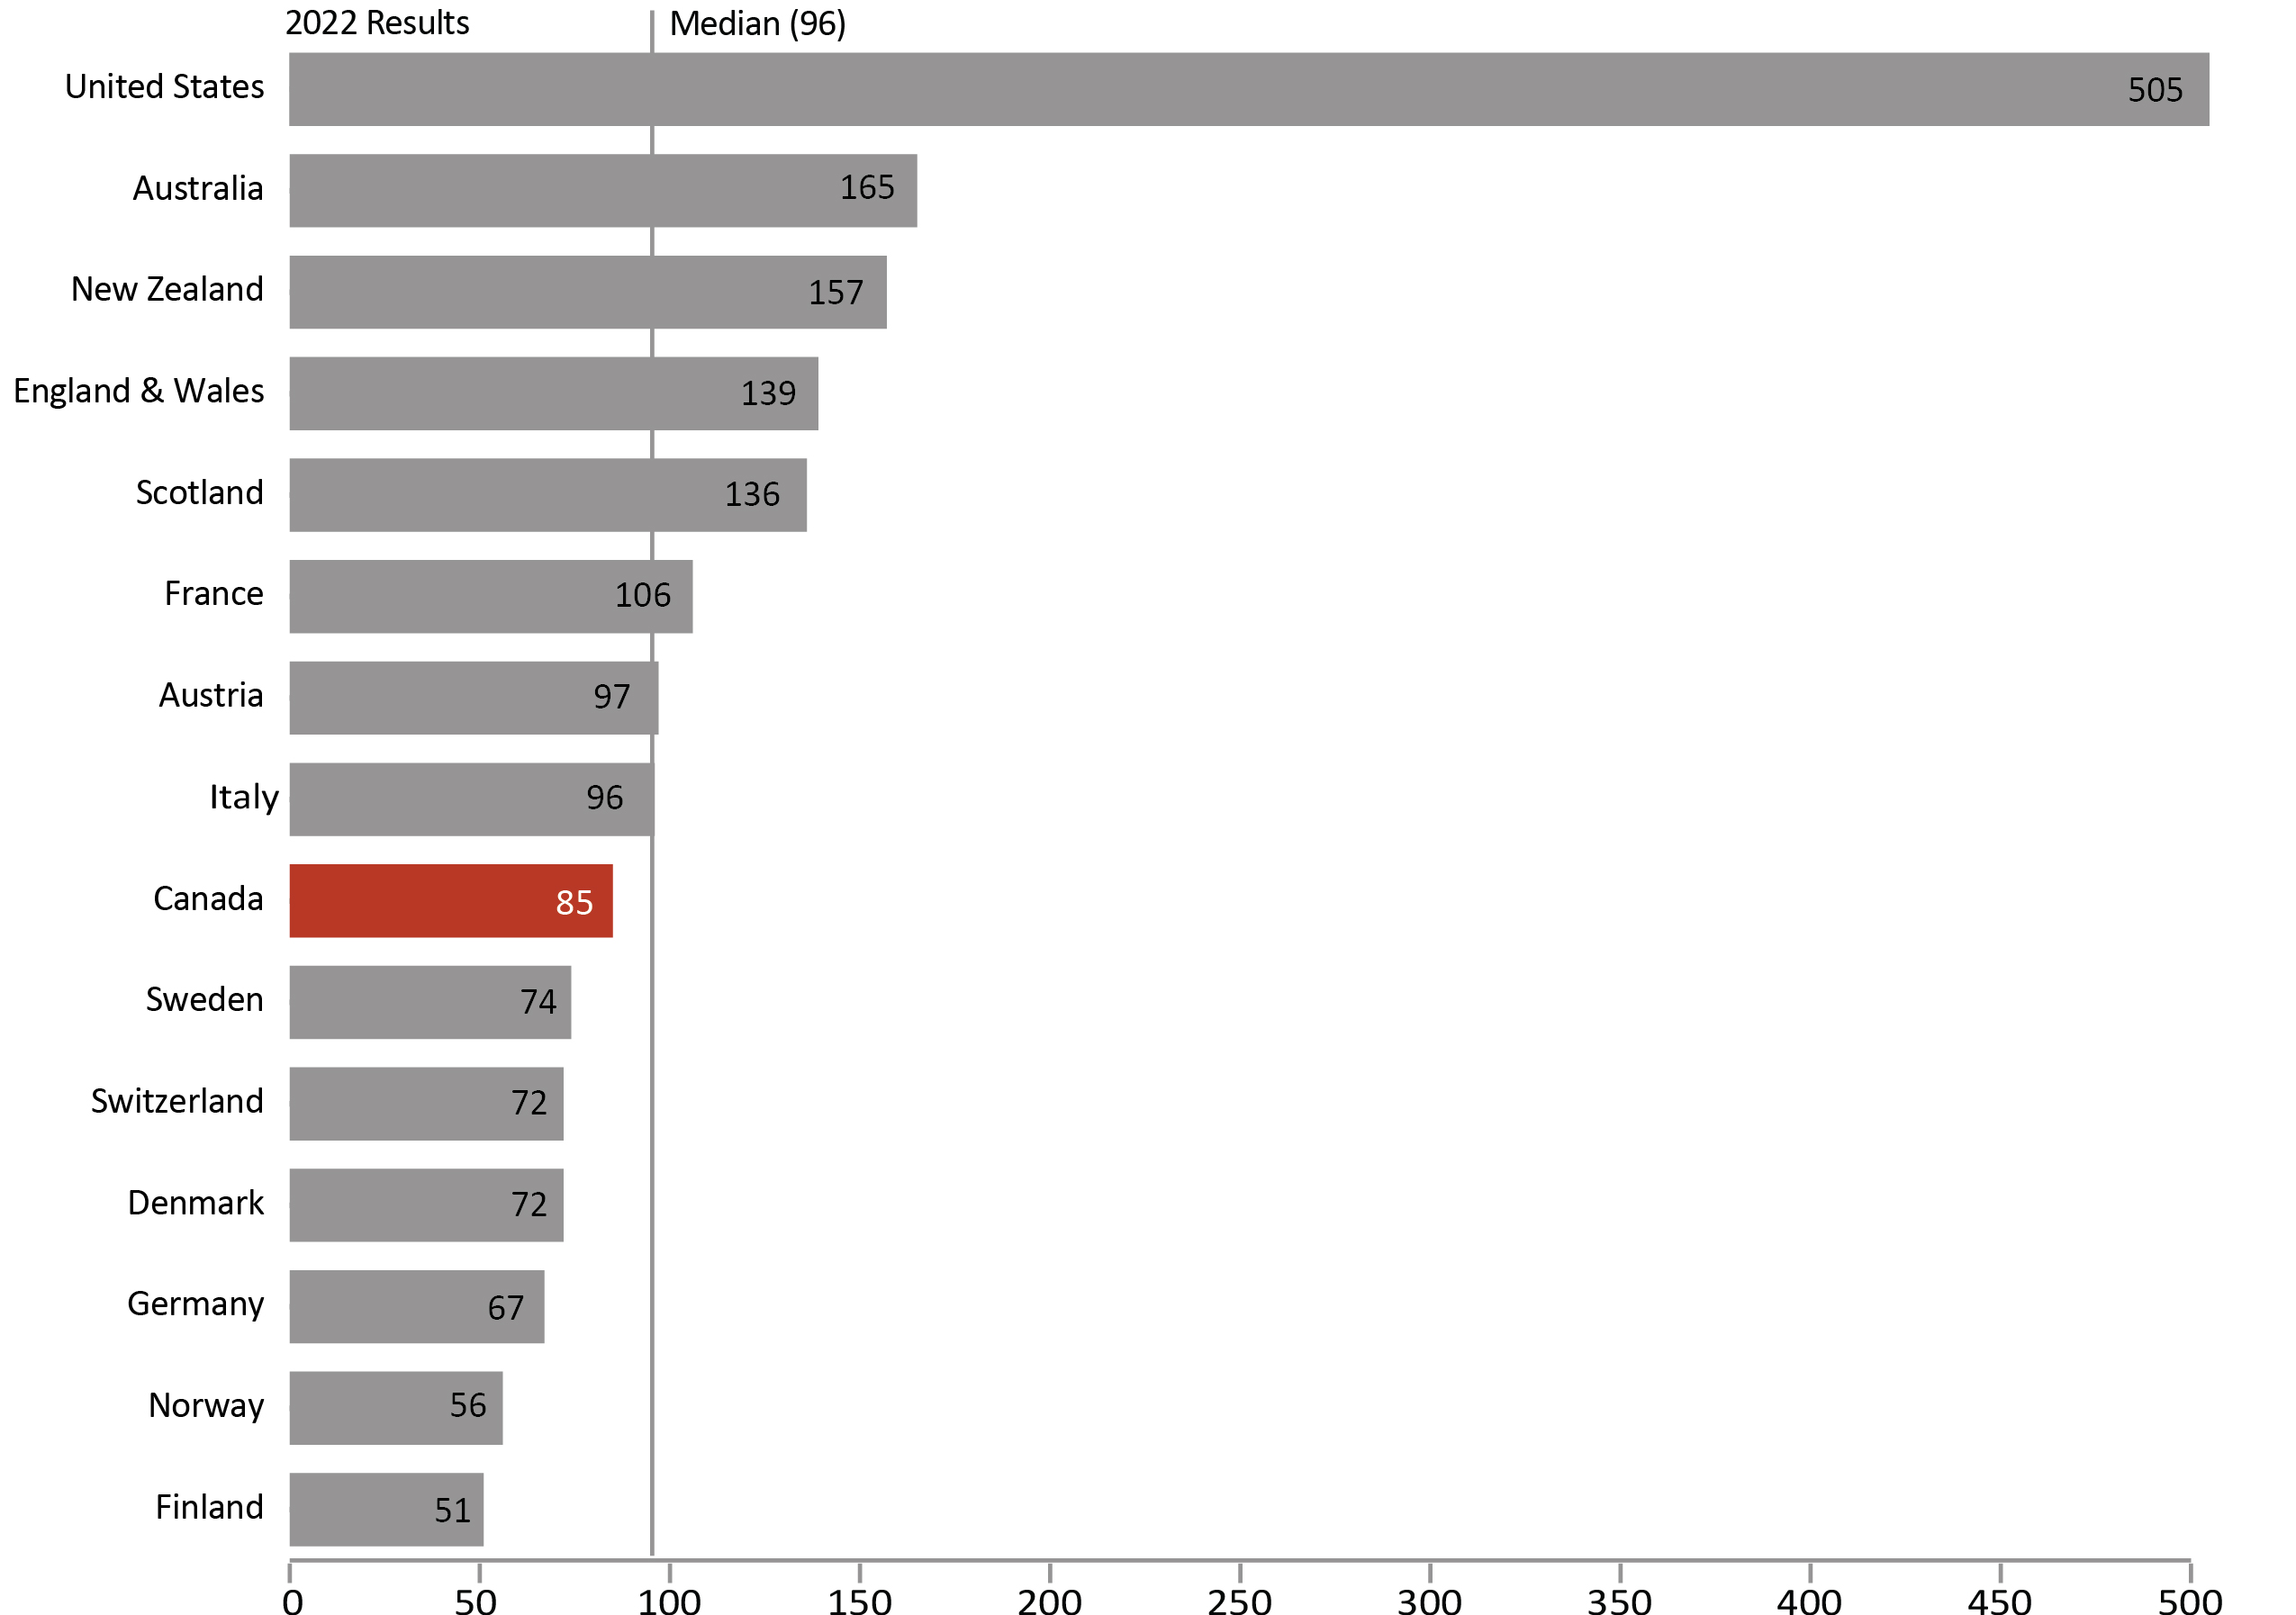
Image description
Bar graph showing the incarceration rates of 15 countries, per 100,000 population, for the calendar year 2022. Compared to the median prison population rate of 96 per 100,000, countries with prison population rates above the median include, the United States with 505 people being incarcerated per 100,000 population; Australia with 165; New Zealand with 157; England and Wales with 139; Scotland with 136; France with 106; Austria with 97, and Italy at the median rate of 96. Countries below the median prison population rate per 100,000 include, Canada with 85; Sweden with 74; Switzerland and Denmark with 72; Germany with 67; Norway with 56; and Finland with 51. Full data are available immediately below.
Source: World Prison Brief, Institute for Crime & Justice Policy Research (ICPR) (www.prisonstudies.org/highest-to-lowest/prison-population-total).
- In 2022, Canada's incarceration rate was 85 per 100,000. When ranked from highest to lowest, Canada's prison population rate was ranked 164 of 223 countries. Canada's incarceration rate is lower than the median of Western and European countries, and much lower than the United States where the most recent incarceration rate was 505 per 100,000.
- Finland’s incarceration rate was 51 per 100,000, the lowest incarceration rate among western European countries.
Figure A17 Notes
The median is the middle value where half the values fall below the median and the other half above. The median is the preferred way to measure the average when there is an extreme outlier in the data.
The incarceration rate presented here is a measure of the number of people (i.e., adults and youth) in custody per 100,000 people in the general population. Incarceration rates from the World Prison Brief hosted by the Institute for Crime & Justice Policy Research (ICPR) are based on the most recently available data at the time the list was compiled. The data was retrieved online on March 17th, 2023 from http://www.prisonstudies.org which contains the most up-to-date information available. Additionally, different practices and variations in measurement in different countries limit the comparability of these figures.
| 2013 | 2014 | 2015 | 2016 | 2017 | 2018 | 2019 | 2020 | 2021 | 2022 | |
|---|---|---|---|---|---|---|---|---|---|---|
| United States | 716 | 707 | 698 | 693 | 666 | 655 | 655 | 639 | 629 | 505 |
| Australia | 130 | 143 | 151 | 152 | 168 | 172 | 170 | 160 | 165 | 165 |
| New Zealand | 192 | 190 | 190 | 203 | 214 | 214 | 201 | 188 | 150 | 157 |
| England & Wales | 148 | 149 | 148 | 147 | 146 | 140 | 140 | 131 | 132 | 139 |
| Scotland | 147 | 144 | 144 | 142 | 138 | 143 | 149 | 136 | 138 | 136 |
| France | 101 | 102 | 100 | 103 | 103 | 100 | 105 | 90 | 103 | 106 |
| Austria | 98 | 99 | 95 | 93 | 94 | 98 | 98 | 95 | 90 | 97 |
| Italy | 106 | 88 | 86 | 90 | 95 | 98 | 101 | 89 | 92 | 96 |
| Canada | 118 | 118 | 106 | 114 | 114 | 114 | 107 | 104 | 104 | 85 |
| Sweden | 67 | 57 | 60 | 53 | 57 | 59 | 61 | 68 | 73 | 74 |
| Switzerland | 82 | 87 | 84 | 83 | 82 | 81 | 81 | 80 | 73 | 72 |
| Denmark | 73 | 67 | 61 | 58 | 59 | 63 | 63 | 68 | 72 | 72 |
| Germany | 79 | 81 | 78 | 78 | 77 | 75 | 77 | 69 | 71 | 67 |
| Norway | 72 | 75 | 71 | 74 | 74 | 63 | 60 | 49 | 57 | 56 |
| Finland | 58 | 55 | 57 | 55 | 57 | 51 | 53 | 53 | 50 | 51 |
Source: World Prison Brief, Institute for Crime & Justice Policy Research (ICPR) (www.prisonstudies.org/highest-to-lowest/prison-population-total).
Table A17 Notes
Table A17 and A18 display the same data.
The incarceration rate presented here is a measure of the number of people (i.e., adults and youth) in custody per 100,000 people in the general population. Incarceration rates from the World Prison Brief hosted by the Institute for Crime & Justice Policy Research (ICPR) are based on the most recently available data at the time the list was compiled. The data was retrieved online on March 17th, 2023 from http://www.prisonstudies.org which contains the most up-to-date information available. Additionally, different practices and variations in measurement in different countries limit the comparability of these figures.
International incarceration rates: 10-year trend
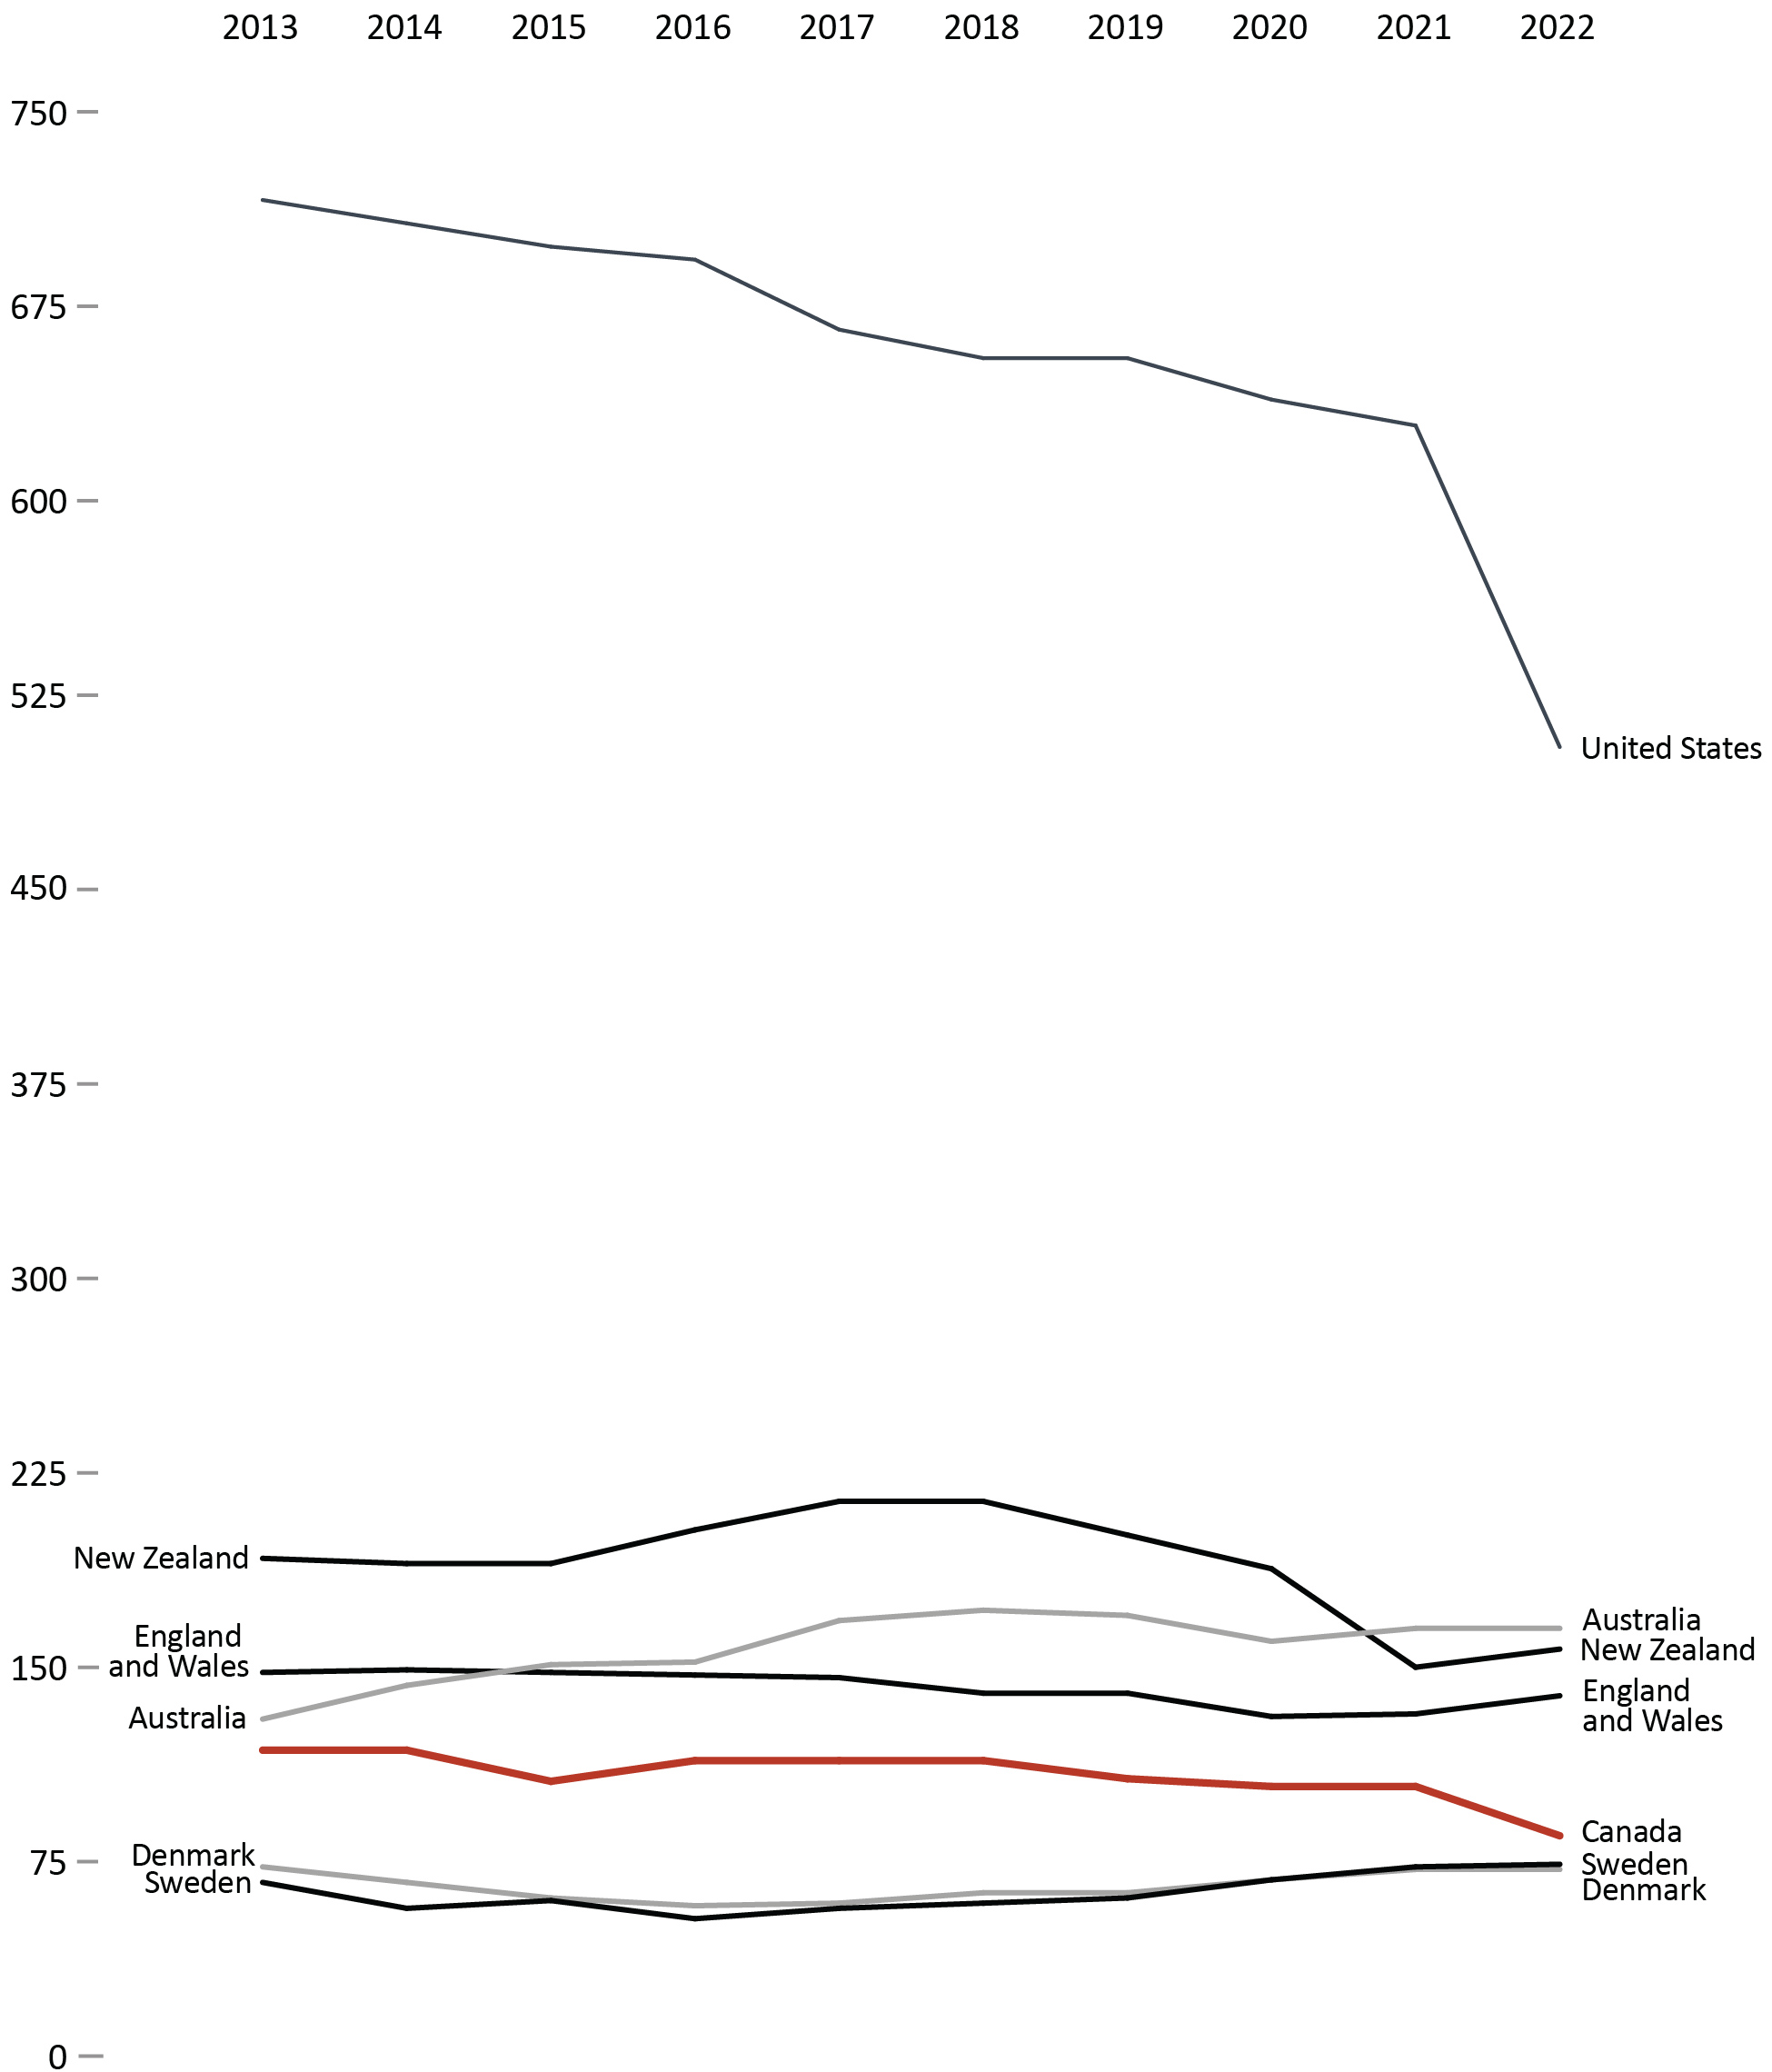
Image description
Line graph showing the incarceration rate across 7 countries, per 100,000 population, from calendar year 2013 to 2022. Sweden and Denmark had the lowest prison population rates: Sweden decreased from 67 in 2013 to 53 in 2016, then gradually increased to a peak of 74 in 2022; and Denmark decreased from a peak of 73 per 100,000 population in 2013 to 58 in 2016, then gradually increased back up to 72 in 2022. Canada had the next lowest overall rate, peaking in 2013 and 2014 at 118 per 100,000 population, then oscillating downwards to a low of 85 in 2022. Followed by the rate in England and Wales, which steadily decreased from 149 in 2014 to 139 in 2022. New Zealand had the third highest rate, decreasing from 192 in 2013 to 190 in 2014 and 2015, then increasing to a peak of 214 in 2017 and 2018, and decreasing again to 147 in 2022. Australia had the second highest incarceration rate, increasing steadily from 130 in 2013 to 172 in 2018, then gradually decreasing to 165 in 2022. Finally, the United States had, by far, the highest incarceration rate of the countries examined, at 716 in 2013 then gradually decreasing to 505 in 2022. Full data are available immediately below.
Source: World Prison Brief, Institute for Crime & Justice Policy Research (ICPR) (www.prisonstudies.org/highest-to-lowest/prison-population-total).
- From 2013 to 2020, incarceration rates declined in most Western and European countries. A notable exception is Australia, where there was a 23.1% increase in the incarceration rate.
- From 2020 to 2022, incarceration rates increased in most Western and European countries. Notable exceptions include the United States and Canada, which showed a 21.0% and 18.3% respective decrease in incarceration rates.
- In the past 10 years (from 2013 to 2022), Canada’s incarceration rate declined 28.0%.
Figure A18 Notes
The incarceration rate presented here is a measure of the number of people (i.e., adults and youth) in custody per 100,000 people in the general population. Incarceration rates from the World Prison Brief hosted by the Institute for Crime & Justice Policy Research (ICPR) are based on the most recently available data at the time the list was compiled. The data was retrieved online on March 17th, 2023, from http://www.prisonstudies.org which contains the most up to-date information available. Different practices and variations in measurement in different countries limit the comparability of these figures.
| 2013 | 2014 | 2015 | 2016 | 2017 | 2018 | 2019 | 2020 | 2021 | 2022 | |
|---|---|---|---|---|---|---|---|---|---|---|
| United States | 716 | 707 | 698 | 693 | 666 | 655 | 655 | 639 | 629 | 505 |
| Australia | 130 | 143 | 151 | 152 | 168 | 172 | 170 | 160 | 165 | 165 |
| New Zealand | 192 | 190 | 190 | 203 | 214 | 214 | 201 | 188 | 150 | 157 |
| England & Wales | 148 | 149 | 148 | 147 | 146 | 140 | 140 | 131 | 132 | 139 |
| Scotland | 147 | 144 | 144 | 142 | 138 | 143 | 149 | 136 | 138 | 136 |
| France | 101 | 102 | 100 | 103 | 103 | 100 | 105 | 90 | 103 | 106 |
| Austria | 98 | 99 | 95 | 93 | 94 | 98 | 98 | 95 | 90 | 97 |
| Italy | 106 | 88 | 86 | 90 | 95 | 98 | 101 | 89 | 92 | 96 |
| Canada | 118 | 118 | 106 | 114 | 114 | 114 | 107 | 104 | 104 | 85 |
| Sweden | 67 | 57 | 60 | 53 | 57 | 59 | 61 | 68 | 73 | 74 |
| Switzerland | 82 | 87 | 84 | 83 | 82 | 81 | 81 | 80 | 73 | 72 |
| Denmark | 73 | 67 | 61 | 58 | 59 | 63 | 63 | 68 | 72 | 72 |
| Germany | 79 | 81 | 78 | 78 | 77 | 75 | 77 | 69 | 71 | 67 |
| Norway | 72 | 75 | 71 | 74 | 74 | 63 | 60 | 49 | 57 | 56 |
| Finland | 58 | 55 | 57 | 55 | 57 | 51 | 53 | 53 | 50 | 51 |
Source: World Prison Brief, Institute for Crime & Justice Policy Research (ICPR) (www.prisonstudies.org/highest-to-lowest/prison-population-total).
Table A18 Notes
Table A17 and A18 display the same data.
The incarceration rate presented here is a measure of the number of people (i.e., adults and youth) in custody per 100,000 people in the general population. Incarceration rates from the World Prison Brief are based on the most recently available data at the time the list was compiled. For 2022, the data was retrieved online on March 17th, 2023 at www.prisonstudies.org which contains the most up to date information available. Additionally, different practices and variations in measurement in different countries limit the comparability of these figures.
Section B: Corrections Administration
Corrections costs federally and provincially/territorially
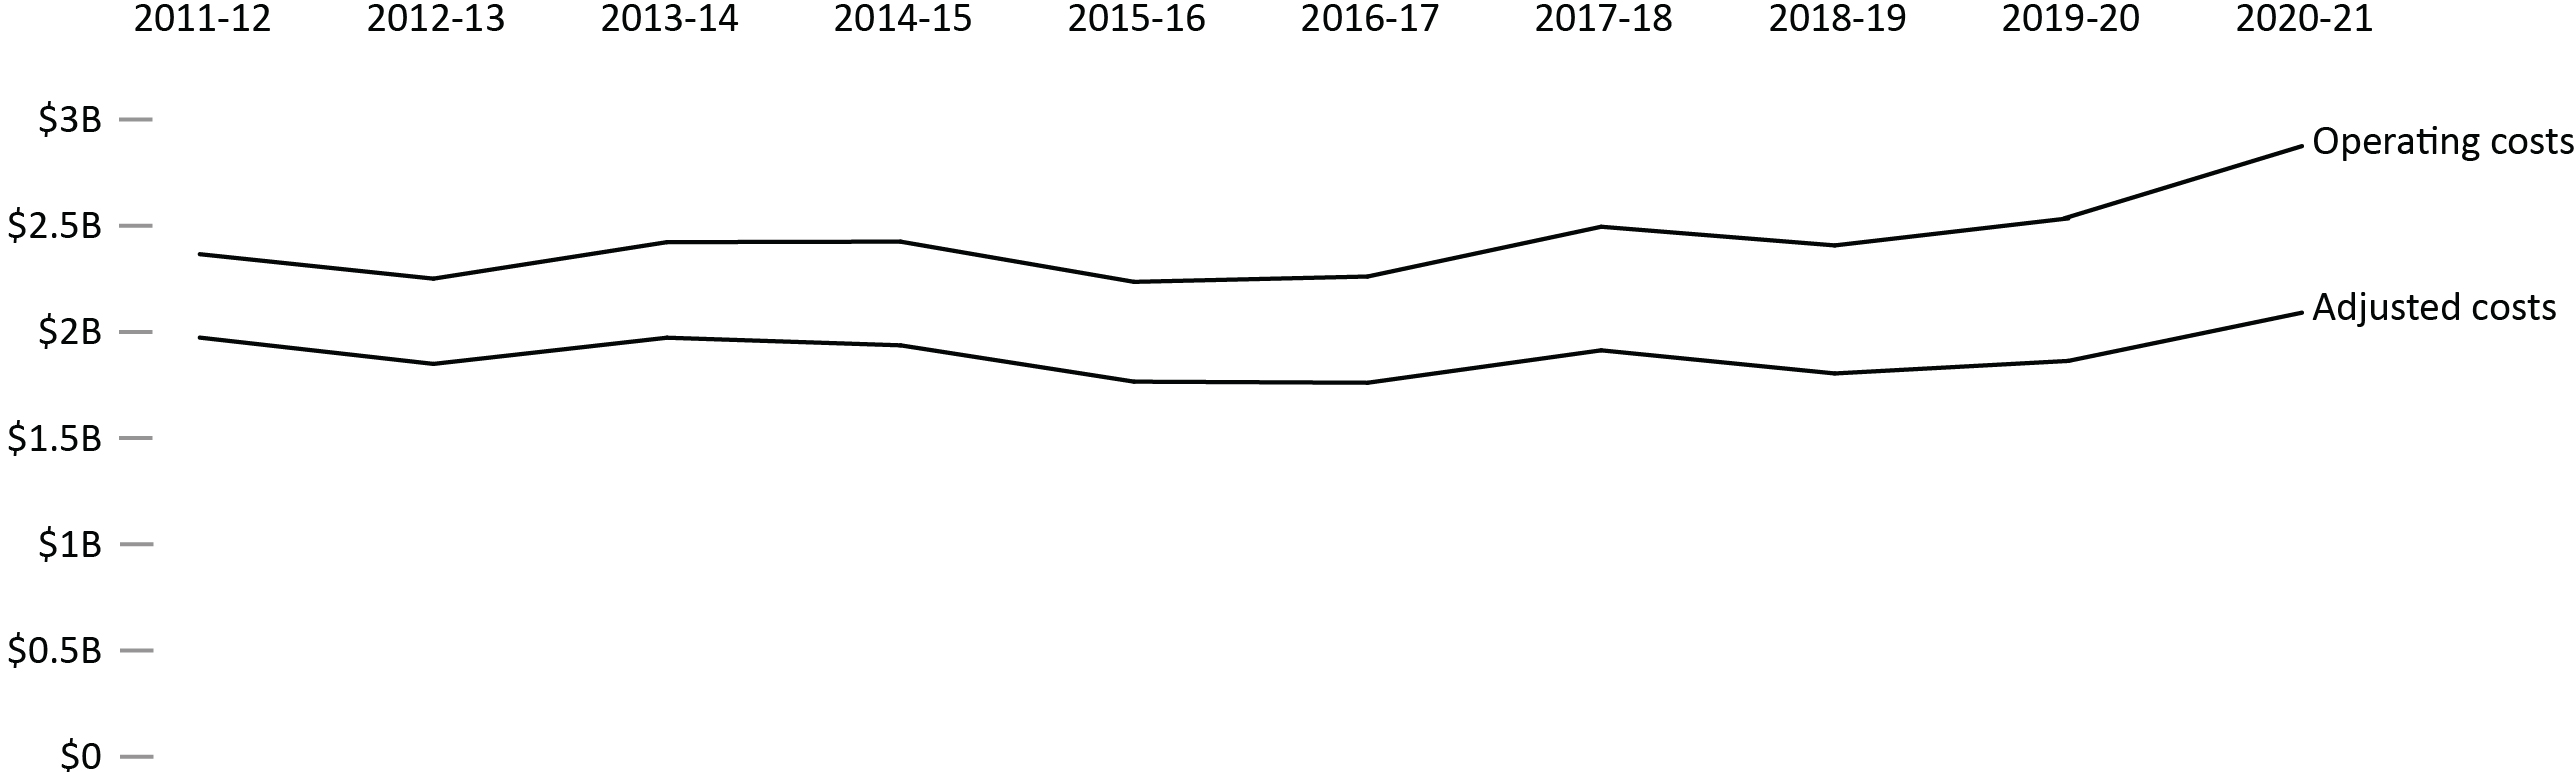
Image description
Line graph showing the costs of federal corrections from fiscal year 2011 to 2012 to fiscal year 2020 to 2021. Operating costs are the largest proportion of correctional budgets over time. Operating costs decreased from just shy of 2.5 billion dollars in fiscal year 2011 to 2012 to around 2.25 billion dollars in the next fiscal; operating costs continued to fluctuate between around 2.25 billion dollars to around 2.5 billion dollars until fiscal year 2020 to 2021 when costs peaked around 2.8 billion dollars. Adjusted costs followed a very similar pattern, but at levels that are roughly 500 million dollars less than operating costs. Adjusted costs decreased from around 2 billion dollars in fiscal year 2011 to 2012 to around 1.75 billion dollars in the next fiscal; adjusted costs continued to fluctuate between around 1.75 billion dollars to just over 2 billion dollars through fiscal year 2020 to 2021. Full data are available immediately below.
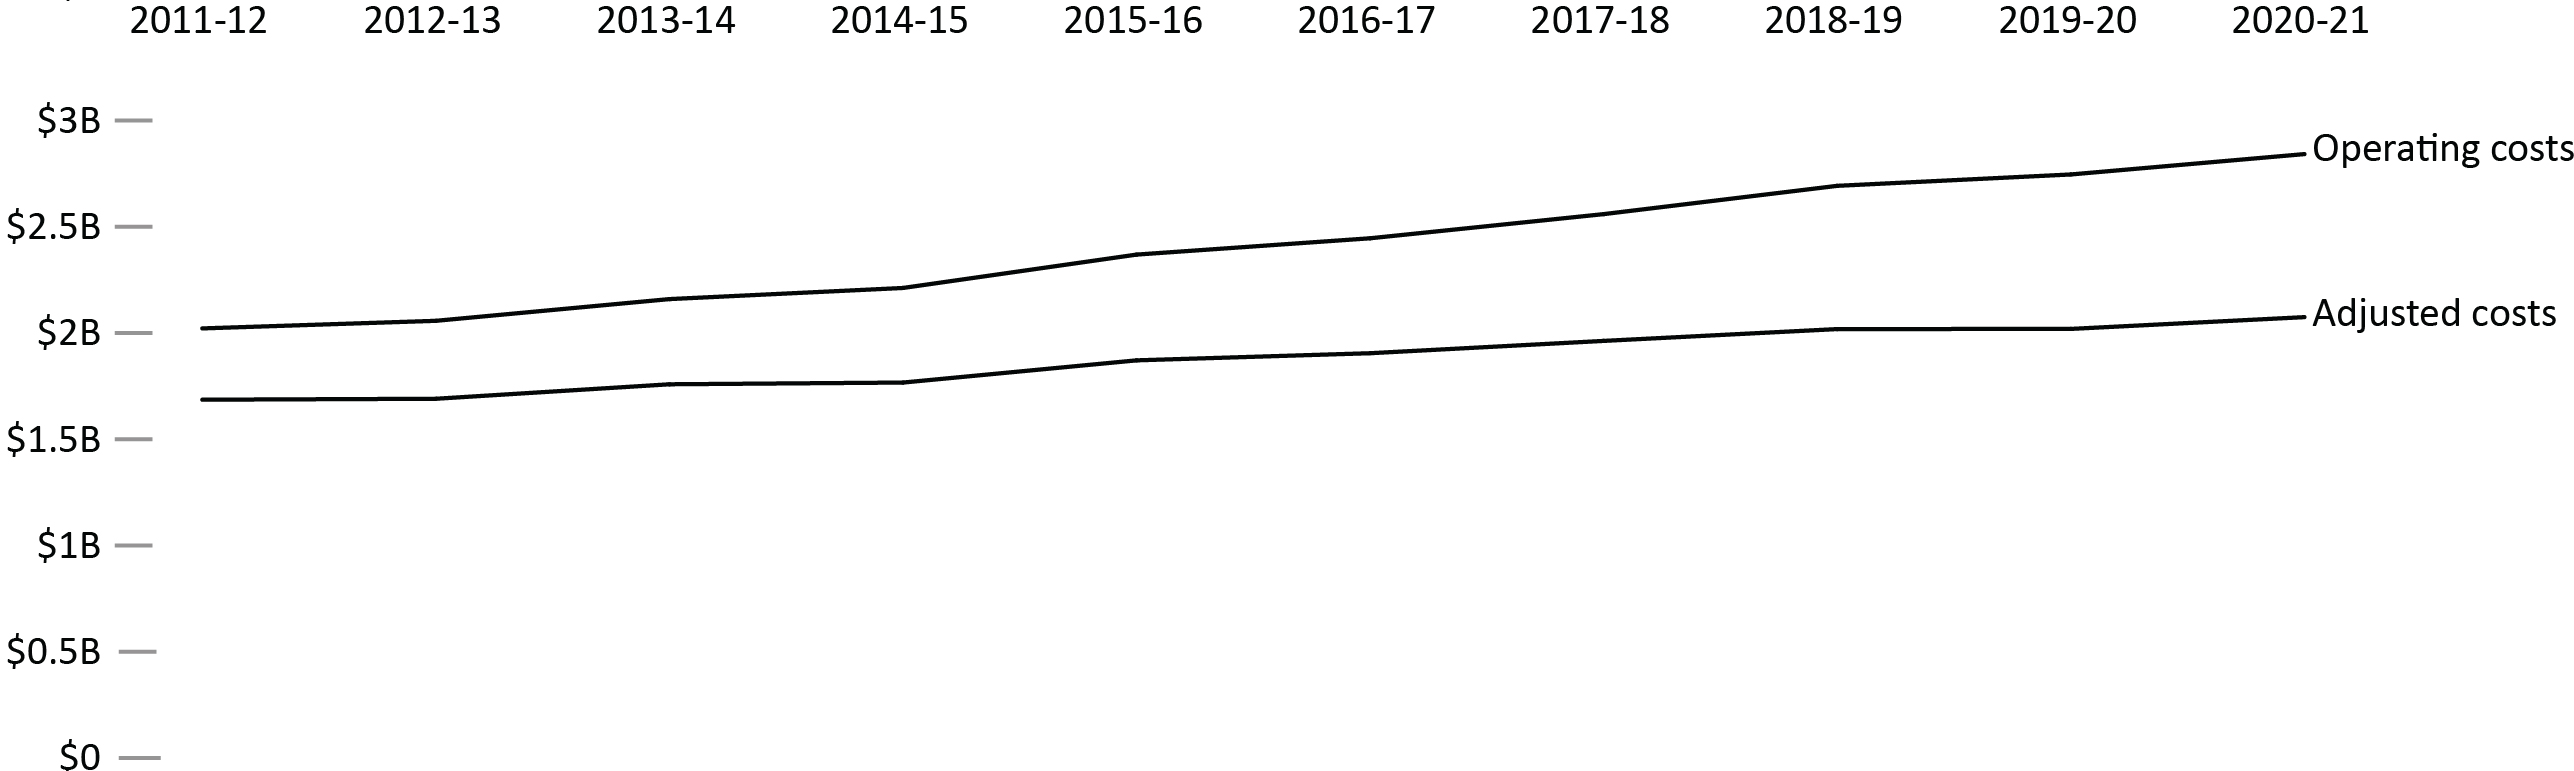
Image description
Line graph showing the costs of provincial and territorial corrections from fiscal year 2011 to 2012 to 2020 to 2021. Operating costs are the largest proportion of correctional budgets over time. Provincial and territorial operating costs increased steadily from around 2 billion dollars in fiscal year 2011 to 2012 to over 2.6 billion dollars in fiscal year 2020 to 2021. Adjusted costs followed a similar trend line to the operating costs, but adjusted costs did not increase as fast as spending on operating costs did. Adjusted costs increased from around 1.75 billion dollars in fiscal year 2011 to 2012 to just shy of 2 billion dollars in fiscal year 2020 to 2021. Full data are available immediately below.
Sources: Federal costs are from Correctional Service Canada; Office of the Correctional Investigator; Parole Board of Canada. Provincial/Territorial costs are from Table 35-10-0013-01, Adult Correctional Services, Canadian Centre for Justice and Community Safety Statistics, Statistics Canada.
- Costs of federal corrections were $2.86 billion in 2020-21. This was a 13.2% increase compared to the prior year and is 21.2% higher than 2012-13. When considering adjusted costs there was a 6.1% increase in spending between 2011-12 to 2020-21.
- Costs of provincial/territorial corrections were about $2.8 billion in 2020-21. This represented a 3.5% increase from 2019-20 and a 40.6% increase since 2011-12. When considering adjusted costs there was a 23.0% increase in spending between 2011-12 to 2020-21.
Figure B1 Notes
Total expenditures represent gross expenditures and exclude revenues (i.e., Foreign Exchange Gains). Operating costs include Employee Benefit Plan expenditures. CSC expenditures exclude CORCAN (a Special Operating Agency that conducts industrial operations within penitentiaries).
Adjusted costs adjust for the impact of inflation by reporting in constant dollars. Constant dollars (2002) represent dollar amounts calculated on a 1-year base that adjusts for inflation, allowing the yearly amounts to be directly comparable. Changes in the Consumer Price Index were used to calculate constant dollars.
Federal expenditures on corrections include spending by Correctional Service Canada (CSC), the Parole Board of Canada (PBC), and the Office of the Correctional Investigator (OCI).
The table includes data from the most recent year available at the time of publication.
Reported year periods reflect fiscal years. A fiscal year runs from April 1 to March 31 of the following year.
| Fiscal year | Current dollars | Constant 2002 dollars | |||||||
|---|---|---|---|---|---|---|---|---|---|
| Operating | Capital | Total | Per capitaFootnote * | Operating | Capital | Total | Per capitaFootnote * | ||
$’000 |
$’000 |
$’000 |
$ | $’000 |
$’000 |
$’000 |
$ | ||
2016-17 |
CSC |
2,209,048 | 153,757 | 2,362,805 | 65.43 | 1,720,442 | 119,748 | 1,840,190 | 50.96 |
PBC |
46,825 | NA |
46,825 | 1.30 | 36,468 | NA |
36,468 | 1.01 | |
OCI |
4,693 | NA |
4,693 | 0.13 | 3,655 | NA |
3,655 | 0.10 | |
Total |
2,260,566 | 153,757 | 2,414,322 | 66.86 | 1,760,565 | 119,748 | 1,880,313 | 52.07 | |
2017-18 |
CSC |
2,442,488 | 185,624 | 2,628,112 | 71.91 | 1,873,074 | 142,350 | 2,015,423 | 55.15 |
PBC |
47,730 | NA |
47,730 | 1.31 | 36,603 | NA |
36,603 | 1.00 | |
OCI |
4,616 | NA |
4,616 | 0.13 | 3,551 | NA |
3,551 | 0.10 | |
Total |
2,494,849 | 185,624 | 2,680,473 | 73.35 | 1,913,228 | 142,350 | 2,055,577 | 56.25 | |
2018-19 |
CSC |
2,352,556 | 227,793 | 2,580,349 | 69.62 | 1,763,535 | 170,759 | 1,934,295 | 52.19 |
PBC |
49,754 | NA |
49,754 | 1.34 | 37,297 | NA |
37,297 | 1.01 | |
OCI |
4,631 | NA |
4,631 | 0.12 | 3,472 | NA |
3,472 | 0.09 | |
Total |
2,406,941 | 227,793 | 2,634,734 | 71.08 | 1,804,304 | 170,759 | 1,975,063 | 53.29 | |
2019-20 |
CSC |
2,477,237 | 164,643 | 2,641,879 | 70.28 | 1,821,498 | 121,061 | 1,942,558 | 51.67 |
PBC |
51,489 | NA |
51,489 | 1.37 | 37,860 | NA |
37,860 | 1.01 | |
OCI |
5,441 | NA |
5,441 | 0.14 | 4,001 | NA |
4,001 | 0.11 | |
Total |
2,534,167 | 164,643 | 2,698,809 | 71.79 | 1,863,358 | 121,061 | 1,984,418 | 52.79 | |
2020-21 |
CSC |
2,811,113 | 121,987 | 2,933,100 | 77.17 | 2,044,446 | 88,718 | 2,133,164 | 56.13 |
PBC |
57,745 | NA |
57,745 | 1.52 | 41,996 | NA |
41,996 | 1.10 | |
OCI |
5,304 | NA |
5,304 | 0.14 | 3,857 | NA |
3,857 | 0.10 | |
Total |
2,874,162 | 121,987 | 2,996,149 | 78.83 | 2,090,300 | 88,718 | 2,179,017 | 57.33 | |
Sources: Federal costs are from Correctional Service Canada; Office of the Correctional Investigator; Parole Board of Canada.
Number of CSC employees by location
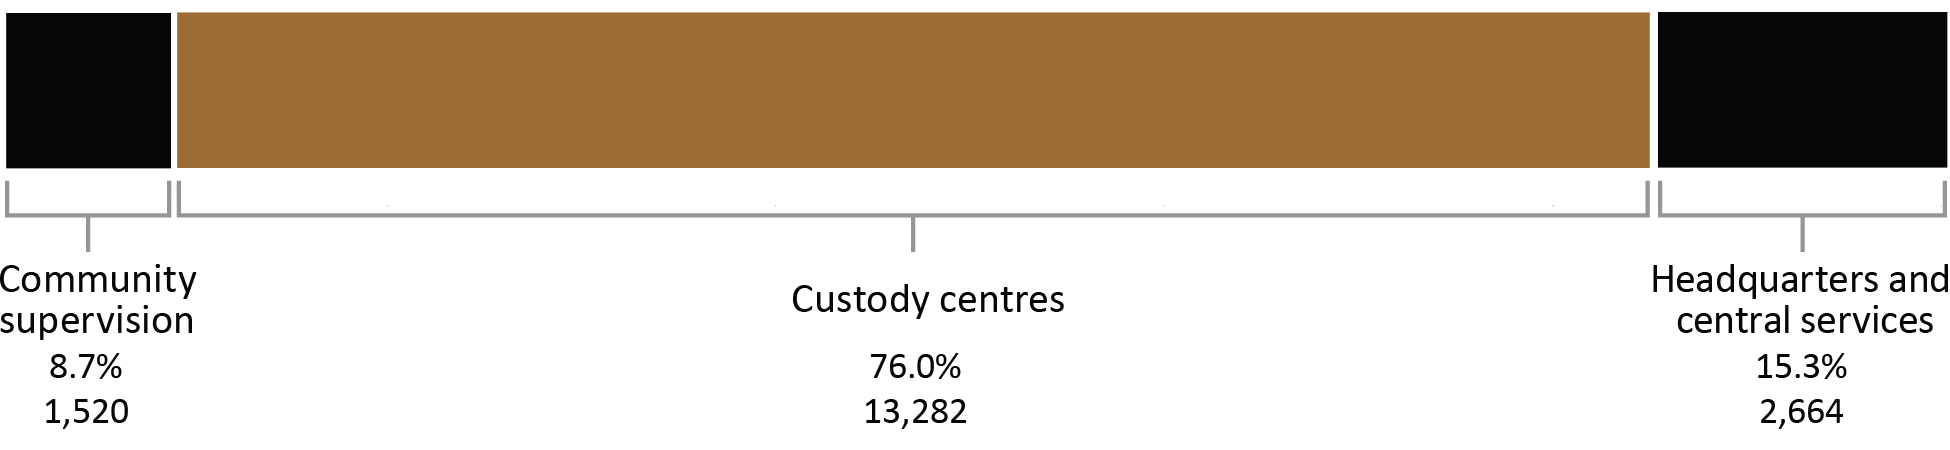
Image description
Bar illustration representing the number of Correctional Service of Canada (CSC) employees at the end of the 2021 to 2022 fiscal year. The bar is divided into three sections: community supervision, custody centres, and headquarters and central services. Community supervision employees are the smallest job category at CSC, representing 8.7% of all CSC employees or 1,520 employees. This is followed by jobs at headquarters and central services which represent 15.3% of all CSC employees or 2,664 employees. Jobs at custody centres is the most common job category representing 76.0% of all CSC employees or 13,282 employees. Full data are available immediately below.
Source: Correctional Service of Canada.
- The Correctional Service of Canada (CSC) has a total staff of 17,466.
- 76% of CSC staff work in institutions.
- Staff employed in community supervision account for 8.7% of the total number of CSC employees.
Figure B2 Notes
Due to changes in policy, Correctional Officers no longer occupy positions in the community.
CSC has changed its definition of employee. Previously, the total number of employees included casual employees, employees on leave without pay and suspended employees. These categories have been removed from the total as of 2005-06. These numbers represent indeterminate and term equal to, or more than 3 months substantive employment; and employee status of active and paid leave current up to March 31, 2022.
Due to rounding, percentage may not add to 100.
Reported year periods reflect fiscal years. A fiscal year runs from April 1 to March 31 of the following year.
| Service area | March 31, 2012 | March 31, 2022 | ||
|---|---|---|---|---|
| # | % | # | % | |
| Headquarters and central services | 2,955 | 15.9 | 2,664 | 15.3 |
| Administration | 2,592 | 13.9 | 2,017 | 11.5 |
| Health care | 99 | 0.5 | 73 | 0.4 |
| Program staff | 79 | 0.4 | 65 | 0.4 |
| Correctional officers | 19 | 0.1 | 42 | 0.2 |
| Instructors/supervisors | 12 | 0.1 | 11 | 0.1 |
| Parole officers/parole supervisorsFootnote * | 2 | 0.0 | 1 | 0.0 |
| OtherFootnote ** | 152 | 0.8 | 455 | 2.6 |
| Custody centres | 14,126 | 75.9 | 13,282 | 76.0 |
| Correctional officers | 7,629 | 41.0 | 7,037 | 40.3 |
| Administration | 2,140 | 11.5 | 1,764 | 10.1 |
| Health care | 1,040 | 5.6 | 1,034 | 5.9 |
| Program staff | 1,024 | 5.5 | 990 | 5.7 |
| Parole officers/parole supervisorsFootnote * | 678 | 3.6 | 556 | 3.2 |
| Instructors/supervisors | 410 | 2.2 | 416 | 2.4 |
| OtherFootnote ** | 1,205 | 6.5 | 1,485 | 8.5 |
| Community supervision | 1,532 | 8.2 | 1,520 | 8.7 |
| Parole officers/parole supervisorsFootnote * | 701 | 3.8 | 789 | 4.5 |
| Administration | 396 | 2.1 | 365 | 2.1 |
| Program staff | 339 | 1.8 | 257 | 1.5 |
| Health care | 83 | 0.4 | 82 | 0.5 |
| Correctional officers | 12 | 0.1 | 0 | 0.0 |
| OtherFootnote ** | 1 | 0.0 | 27 | 0.2 |
| Total | 18,613 | 100 | 17,466 | 100 |
Source: Correctional Service of Canada.
Cost of incarceration in a federal institution: 5-year trend
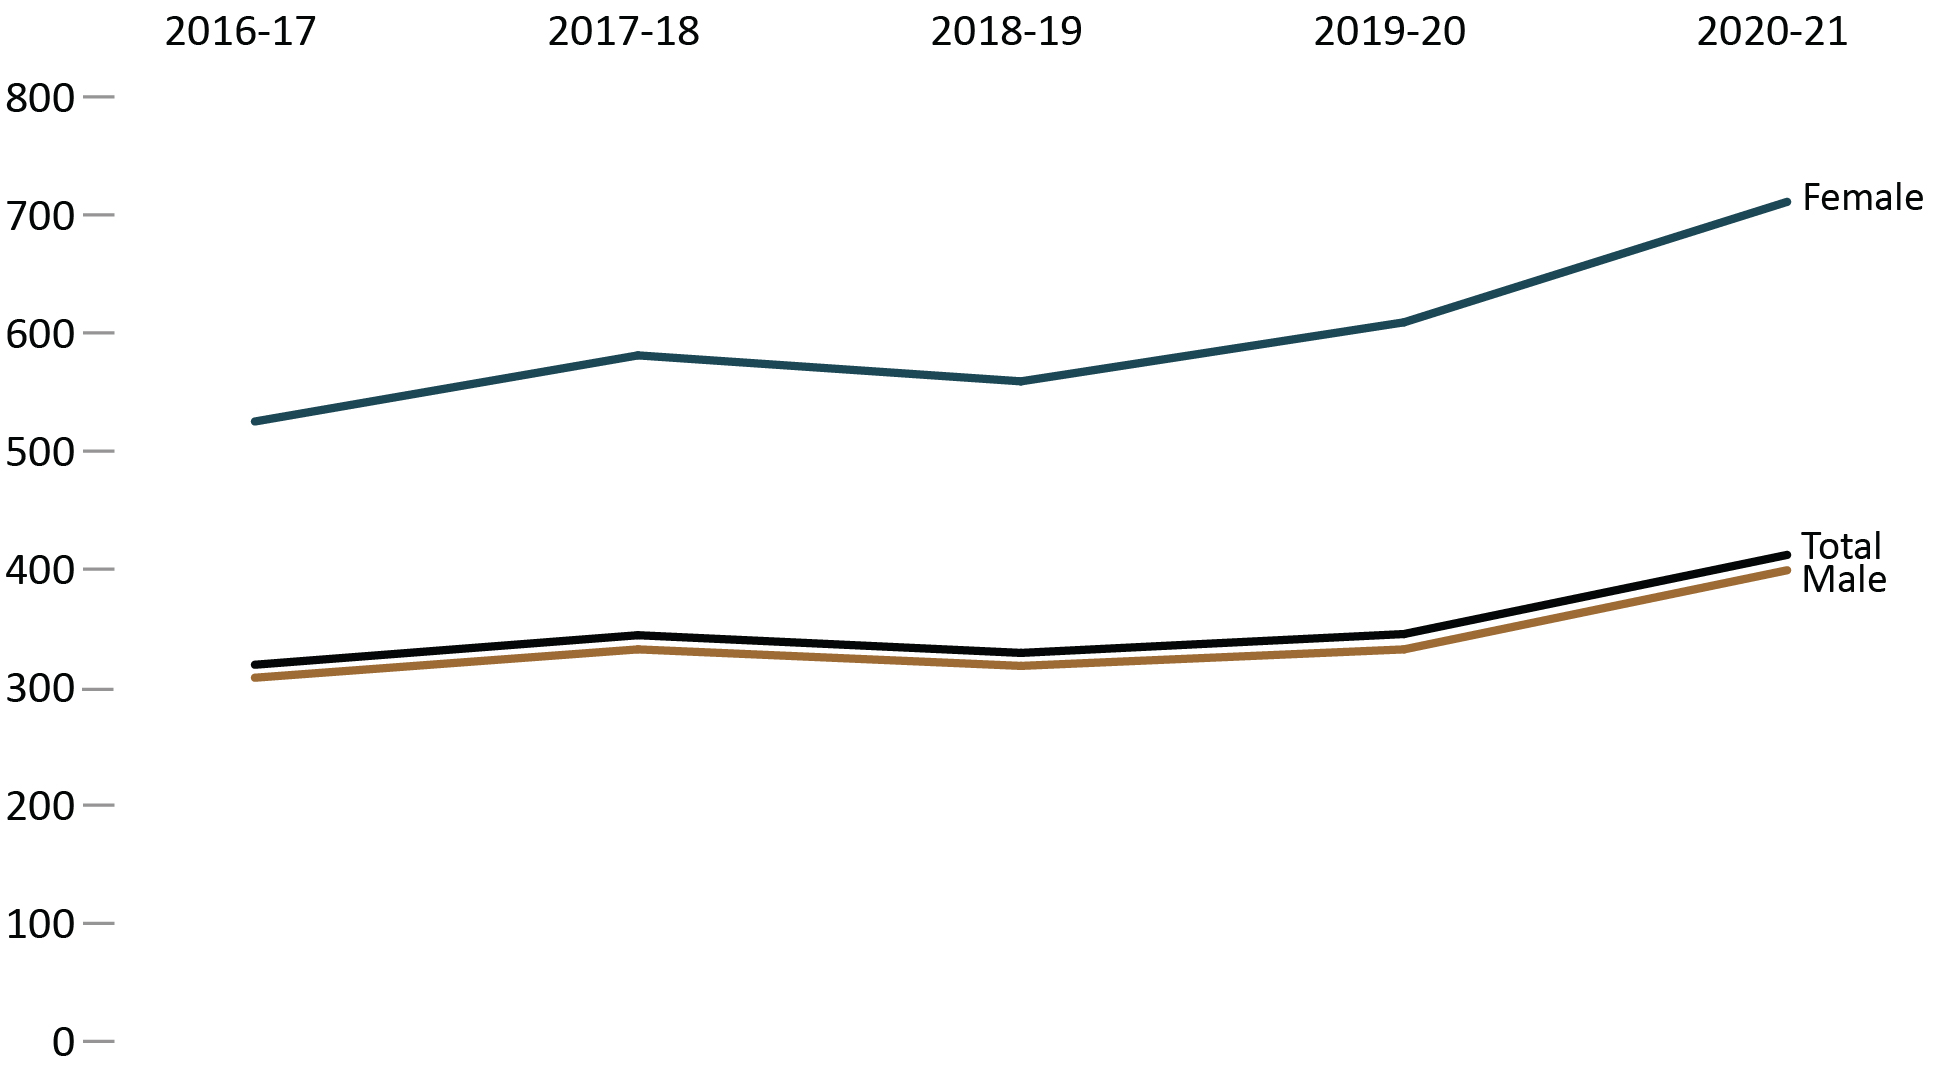
Image description
Line graph showing the cost of incarceration in a federal institution, by average daily inmate cost in dollars, and by female, male, and total from fiscal year 2016 to 2017 to fiscal year 2020 to 2021. Female daily inmate costs were the highest, followed by total and then male. Female daily inmate costs increased from 525 dollars in fiscal year 2016 to 2017 to around 575 dollars in fiscal year 2017 to 2018; then dropping to around 550 in fiscal year 2018 to 2019; after which point daily costs steadily increase to just over 700 dollars in fiscal year 2020 to 2021.
Trend lines for the total daily inmate cost and male daily inmate cost share a similar pattern. Total and male daily inmate costs increase from around 300 dollars in fiscal year 2016 to 2017 to around 350 dollars in fiscal year 2017 to 2018; then dropping to around 325 dollars in fiscal year 2018 to 2019; after which point total and male daily inmate costs increase steadily to around 400 dollars in fiscal year 2020 to 2021. Full data are available immediately below.
Source: Correctional Service of Canada.
- The federal average daily inmate cost has increased from $319 in 2016-17 to $412 in 2020-21. In 2020-21, the annual average cost of keeping an inmate incarcerated was $150,505 per year, an increase from $116,473 per year in 2016-17. In 2020-21, the annual average cost of keeping a male incarcerated was $145,542 per year, whereas the annual average cost for incarcerating a female was $259,654.
- The cost associated with maintaining an offender in the community is 74.5% less than what it costs to maintain an offender in custody ($38,418 per year versus $150,505 per year).
Figure B3 Notes
In 2018-19, the methodology of presentation for certain indirect costs was changed to better reflect the direct costs of maintaining an offender.
The average daily inmate cost includes those costs associated with the operation of the institutions such as salaries and employee benefit plan contributions, but excludes capital expenditures and expenditures related to CORCAN (a Special Operating Agency that conducts industrial operations within federal institutions).
Figures may not add due to rounding.
Reported year periods reflect fiscal years. A fiscal year runs from April 1 to March 31 of the following year.
| Categories | 2016-17 | 2017-18 | 2018-19 | 2019-20 | 2020-21 |
|---|---|---|---|---|---|
| Maximum security (men’s facilities) | 158,113 | 169,367 | 163,642 | 174,939 | 204,048 |
| Medium security (men’s facilities) | 105,349 | 115,263 | 109,660 | 111,243 | 131,533 |
| Minimum security (men’s facilities) | 83,450 | 86,603 | 83,900 | 92,877 | 121,898 |
| Women’s facilities | 191,843 | 212,005 | 204,474 | 222,942 | 259,654 |
| Exchange of services agreementsFootnote * (males and females) | 122,998 | 114,188 | 122,269 | 131,322 | 130,729 |
| Incarcerated average | 116,473 | 125,466 | 120,589 | 126,253 | 150,505 |
| Offenders in the community | 30,639 | 32,327 | 32,037 | 34,214 | 38,418 |
| Total incarcerated and in community | 95,654 | 100,425 | 99,185 | 104,963 | 119,735 |
Source: Correctional Service of Canada.
The number of Parole Board of Canada employees
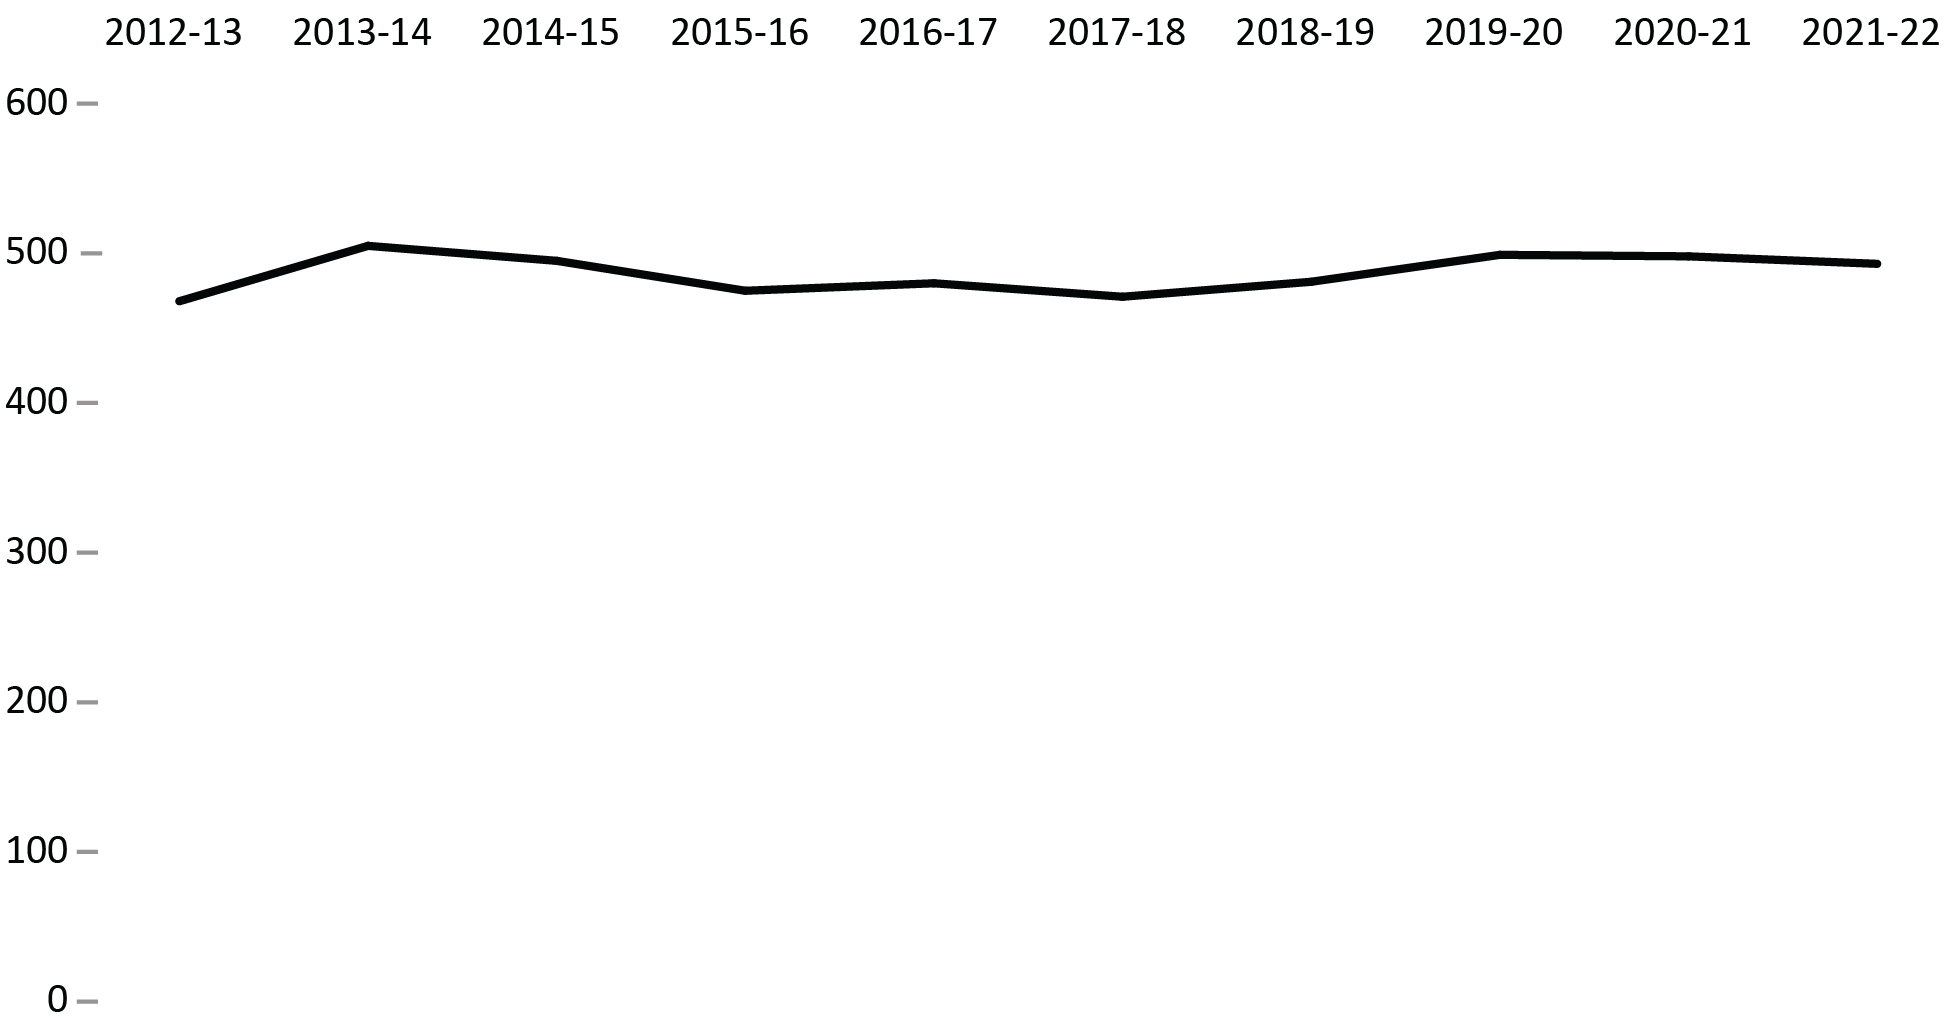
Image description
Line graph showing the number of full-time employees employed by the Parole Board of Canada from fiscal year 2012 to 2013 to fiscal year 2021 to 2022. The trend line rises from around 475 employees in fiscal year 2012 to 2013 to around 500 employees in fiscal year 2013 to 2014; then it gradually decreases back to 475 employees in fiscal year 2015 to 2016. The trend is relatively stable until fiscal year 2017 to 2018 when it begins to rise until it reaches 499 employees in fiscal year 2019 to 2020; then drops slightly to 493 employees in fiscal year 2021 to 2022. Full data are available immediately below.
Source: Parole Board of Canada.
- In 2021-22, the full-time equivalents employed by the Parole Board of Canada was 493 (5 fewer) compared to 2020-21.
- In the past 10 years (from 2012-13 to 2021-22), there was a 5.3% increase (from 468 to 493) in the number of full-time equivalents employed by the Parole Board of Canada.
Figure B4 Notes
A full-time equivalent is a measure of the extent to which an employee represents a full person-year charge against a departmental budget. Section 103 of the Corrections and Conditional Release Act limits the Parole Board of Canada to 60 full-time members.
Reported year periods reflect fiscal years. A fiscal year runs from April 1 to March 31 of the following year.
| 2017-18 | 2018-19 | 2019-20 | 2020-21 | 2021-22 | |
|---|---|---|---|---|---|
| Program activity | |||||
Conditional release decisions |
317 | 317 | 320 | 323 | 320 |
Conditional release openness and accountability |
42 | 43 | 45 | 45 | 49 |
Record suspension and clemency recommendations |
48 | 58 | 72 | 62 | 57 |
Internal services |
64 | 63 | 62 | 68 | 67 |
Total |
471 | 481 | 499 | 498 | 493 |
| Types of employees | |||||
Full-time board members |
38 | 41 | 40 | 36 | 40 |
Part-time board members |
20 | 19 | 20 | 20 | 19 |
Staff |
413 | 421 | 439 | 442 | 434 |
Total |
471 | 481 | 499 | 498 | 493 |
Source: Parole Board of Canada.
Table B4 Notes
A full-time equivalent is a measure of the extent to which an employee represents a full person-year charge against a departmental budget. Section 103 of the Corrections and Conditional Release Act limits the Parole Board of Canada to 60 full-time members.
Reported year periods reflect fiscal years. A fiscal year runs from April 1 to March 31 of the following year.
The number of employees in the Office of the Correctional Investigator
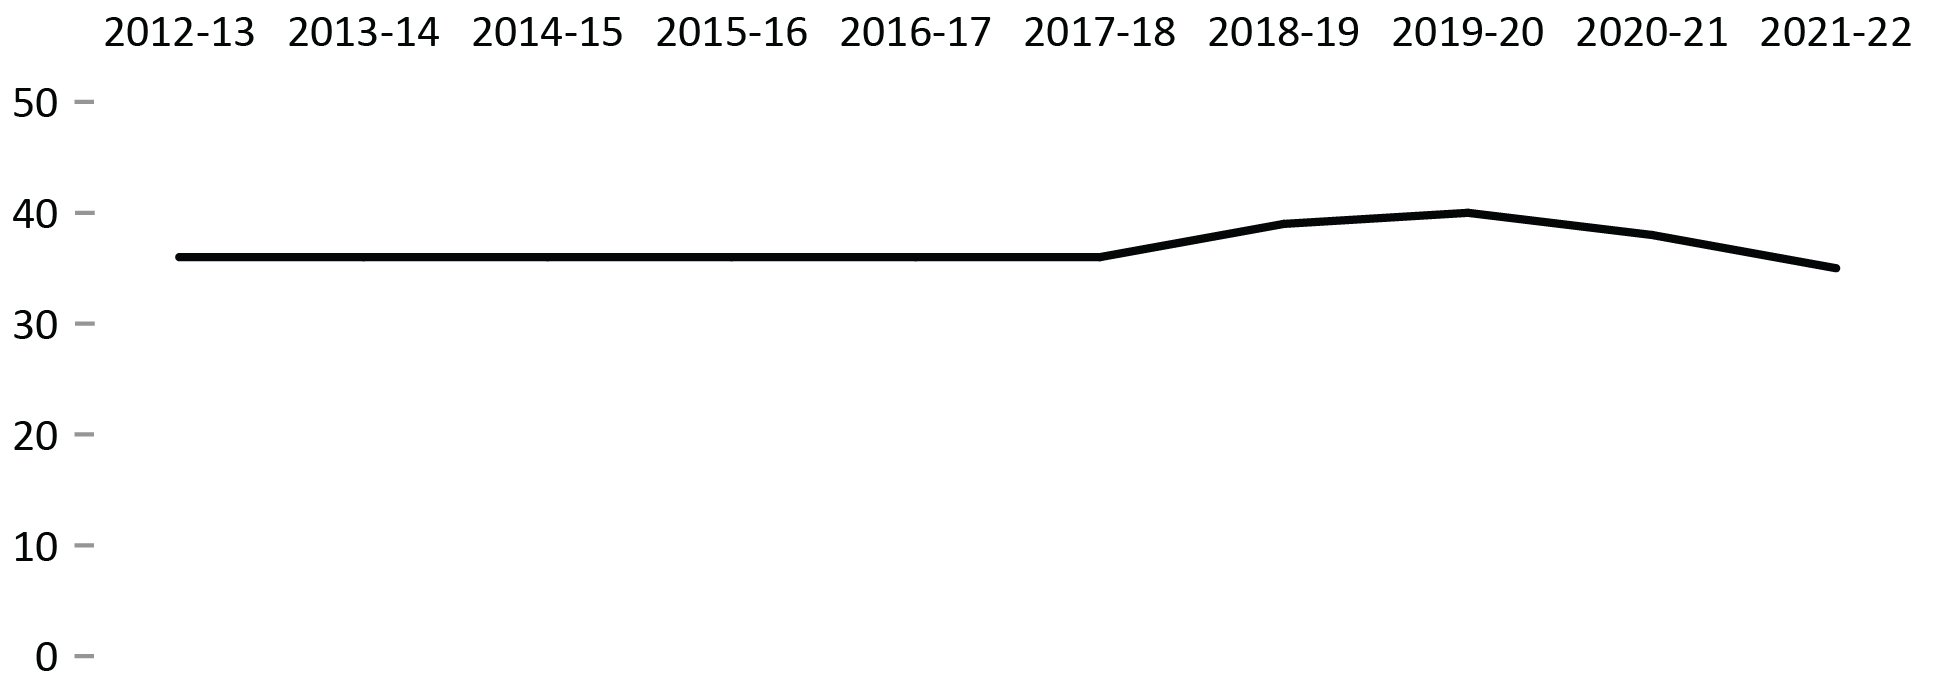
Image description
Line graph showing the number of full-time employees at the Office of the Correctional Investigator from fiscal year 2012 to 2013 to fiscal year 2021 to 2022. The number of full-time employees remains relative stable, around 35 employees, between fiscal year 2012 to 2013 and fiscal year 2017 to 2018; then it rises and reaches a peak of 40 employees in fiscal year 2019 to 2020; then drops again until it reaches 35 employees in fiscal year 2021 to 2022. Full data are available immediately below.
Source: Office of the Correctional Investigator.
- In 2021-22, the total number of full-time equivalents at the Office of the Correctional Investigator decreased from 38 employees total in 2020-21 to 35 employees total.
- In the past 10 years (from 2012-13 to 2021-22), the total number of full-time equivalents at the Office of the Correctional Investigator has remained relatively stable.
Figure B5 Notes
The Office of the Correctional Investigator (OCI) may commence an investigation on receipt of a complaint by or on behalf of an offender or on its own initiative. Complaints are made by telephone, letter and during interviews with the OCI's investigative staff at federal correctional facilities. The dispositions in response to complaints involve a combination of internal responses (where the information or assistance sought by the offender can generally be provided by the OCI's investigative staff) and investigations (where, further to a review/analysis of law, policies and documentation, OCI investigative staff make an inquiry or several interventions with Correctional Service Canada and submit recommendations to address the complaint). Investigations vary considerably in terms of scope, complexity, duration and resources required.
Reported year periods reflect fiscal years. A fiscal year runs from April 1 to March 31 of the following year.
| Types of employees | 2017-18 | 2018-19 | 2019-20 | 2020-21 | 2021-22 |
|---|---|---|---|---|---|
| Correctional investigator | 1 | 1 | 1 | 1 | 1 |
| Senior management and investigative services | 26 | 27 | 28 | 26 | 24 |
| Internal services | 4 | 6 | 5 | 5 | 5 |
| Legal counsel, policy and research | 5 | 5 | 6 | 6 | 5 |
| Total | 36 | 39 | 40 | 38 | 35 |
Source: Office of the Correctional Investigator.
Table B5 Notes
The Office of the Correctional Investigator (OCI) may commence an investigation on receipt of a complaint by or on behalf of an offender or on its own initiative. Complaints are made by telephone, letter and during interviews with the OCI's investigative staff at federal correctional facilities. The dispositions in response to complaints involve a combination of internal responses (where the information or assistance sought by the offender can generally be provided by the OCI's investigative staff) and investigations (where, further to a review/analysis of law, policies and documentation, OCI investigative staff make an inquiry or several interventions with Correctional Service Canada and submit recommendations to address the complaint). Investigations vary considerably in terms of scope, complexity, duration and resources required.
Reported year periods reflect fiscal years. A fiscal year runs from April 1 to March 31 of the following year.
Most common offender complaints to the Office of the Correctional Investigator
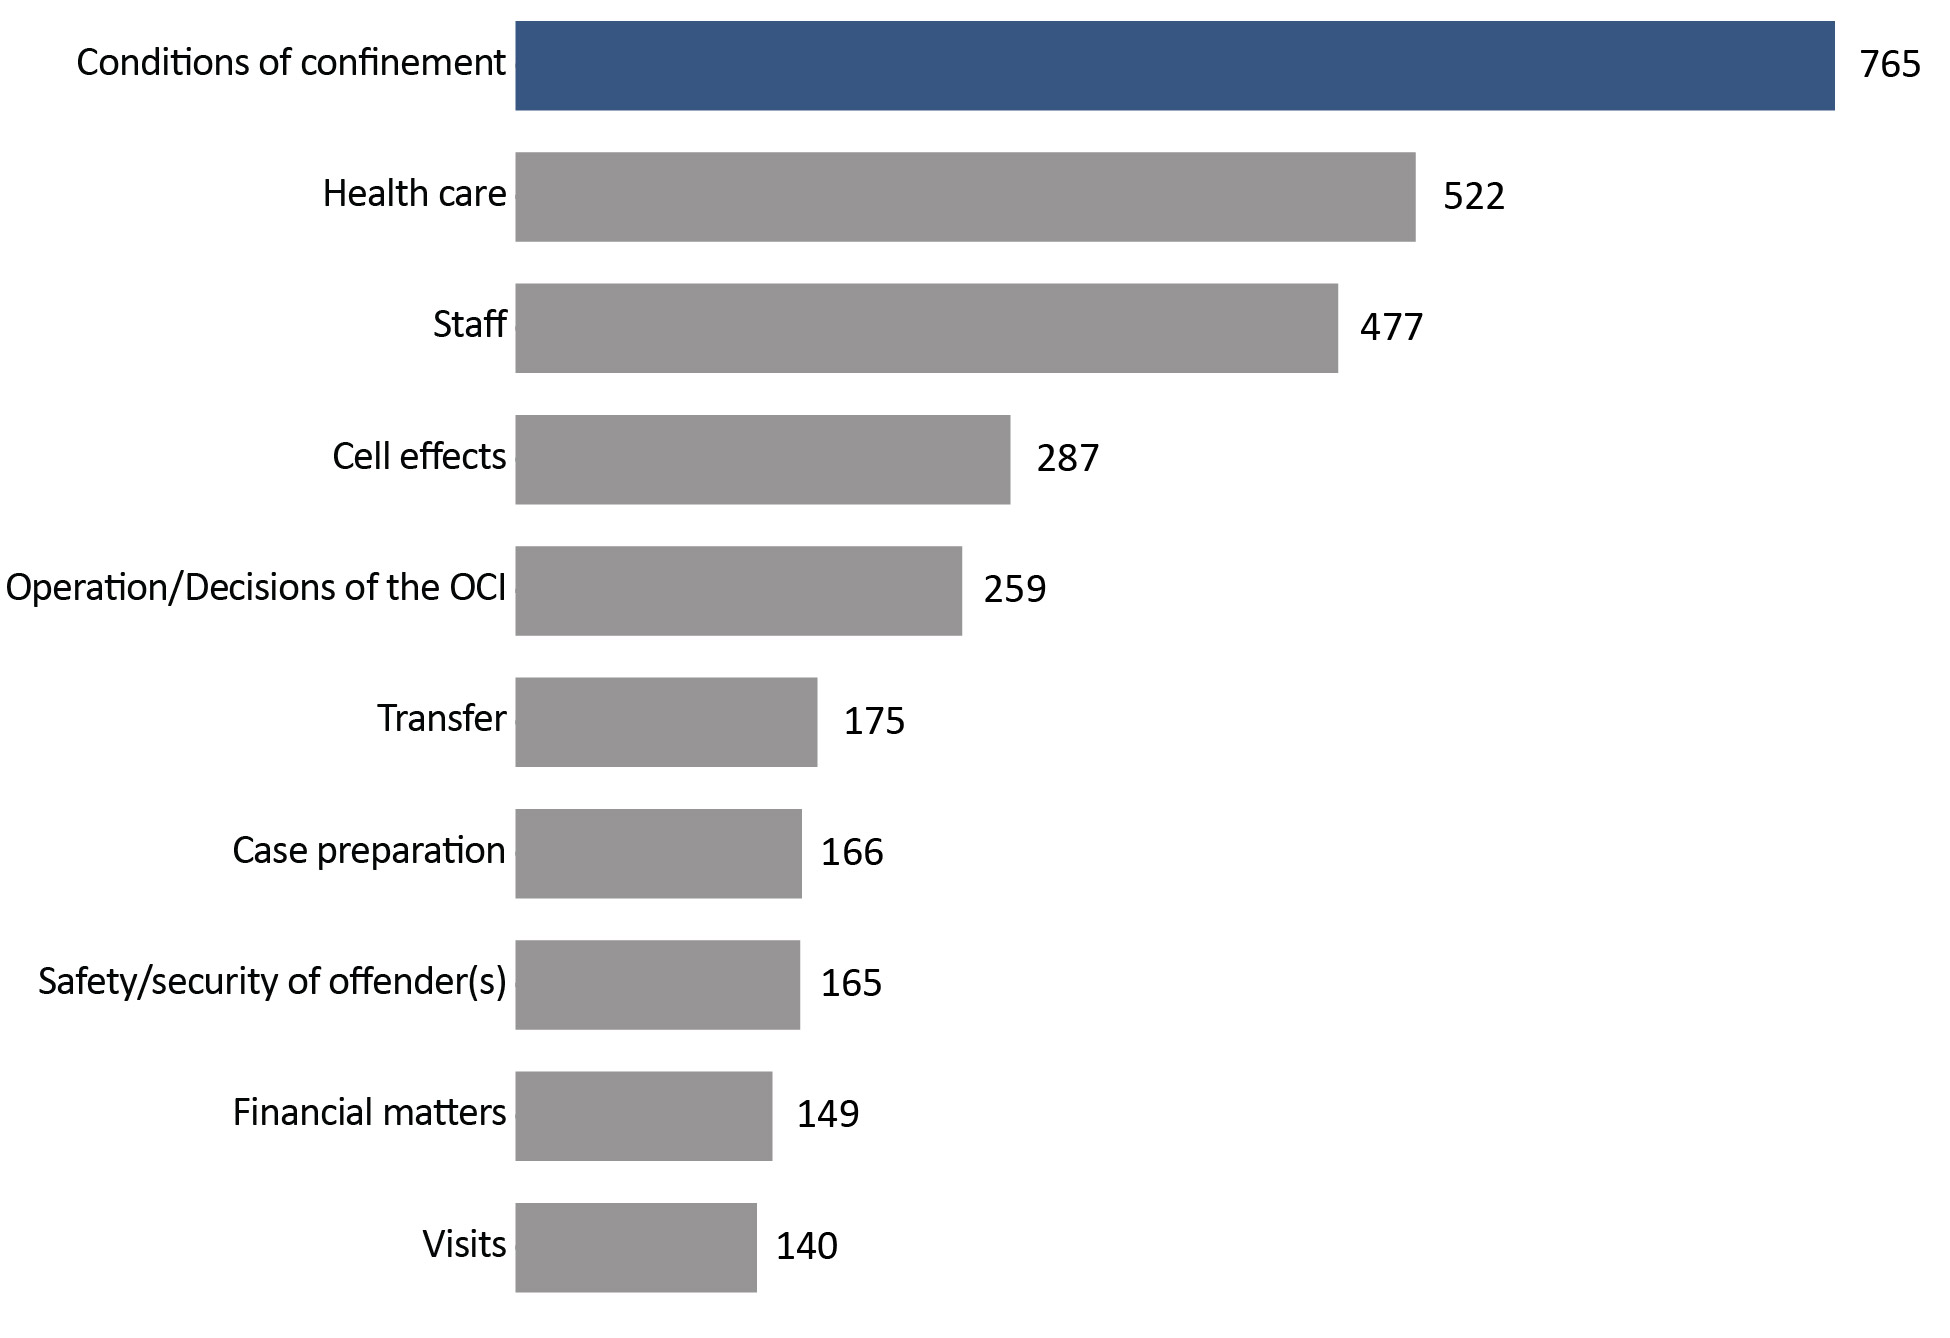
Image description
Bar graph showing the 10 most common offender complaints in fiscal year 2021 to 2022. In descending order of frequency, conditions of confinement are the most prevalent with 765 complaints; followed by health care with 522 complaints; staff with 477 complaints; cell effects with 287 complaints; operation/decisions of the OCI with 259 complaints; transfer with 175 complaints; case preparation with 166 complaints; safety/security of offender(s) with 165 complaints; financial matters with 149 complaints; and visits with 140 complaints. Full data are available immediately below.
Source: Office of the Correctional Investigator.
- There were 4,755 complaints/enquiries received at the Office of the Correctional Investigator (OCI) in 2021-22, an increase of 5.5% since 2020-21.
- Conditions of confinement (16.1%), health care (11.0%), staff (10.0%), and cell effects (6.0%), accounted for 43.1% of all complaints.
- Conditions of confinement remain the most common offender complaint in 2021-22. From 2017-18 to 2019-20, the most common complain was health care.
Figure B6 Notes
The Office of the Correctional Investigator (OCI) may commence an investigation on receipt of a complaint by or on behalf of an offender or on its own initiative. Complaints are made by telephone, letter and during interviews with the OCI's investigative staff at federal correctional facilities. The dispositions in response to complaints involve a combination of internal responses (where the information or assistance sought by the offender can generally be provided by the OCI's investigative staff) and investigations (where, further to a review/analysis of law, policies and documentation, OCI investigative staff make an inquiry or several interventions with Correctional Service Canada and submit recommendations to address the complaint). Investigations vary considerably in terms of scope, complexity, duration and resources required.
Due to restrictions on institutional visits and the operational changes required to meet our service standards as an organization during the COVID-19 pandemic, there was a sudden and large increase in the number of cases categorized as “Operation/Decisions of the OCI.” Most of these were not related to complaints, but were general inquiries regarding visit arrangements, requests for information, etc.
Due to ongoing efforts at the OCI to streamline our administrative database and ensure accuracy in reporting, the numbers in this table will not always match those of past Corrections and Conditional Release Statistical Overviews, or OCI Annual Reports.
Reported year periods reflect fiscal years. A fiscal year runs from April 1 to March 31 of the following year.
| Category of complaintFootnote * | 2017-18 | 2018-19 | 2019-20 | 2020-21 | 2021-22 |
|---|---|---|---|---|---|
| Conditions of confinement | 783 | 608 | 502 | 863 | 765 |
| Health care | 858 | 693 | 688 | 516 | 522 |
| Staff | 530 | 501 | 560 | 515 | 477 |
| Cell effects | 412 | 407 | 388 | 244 | 287 |
| Transfer | 353 | 334 | 368 | 201 | 175 |
| Safety/Security of offender(s) | 127 | 177 | 230 | 183 | 165 |
| Visits | 214 | 192 | 209 | 123 | 140 |
| Request for information | 126 | 159 | 245 | 204 | 139 |
| Telephone | 169 | 183 | 185 | 133 | 127 |
| Grievance | 177 | 127 | 129 | 106 | 92 |
| Financial matters | 107 | 111 | 119 | 112 | 149 |
| Outside OCI jurisdiction | 193 | 128 | 133 | 65 | 71 |
| Correspondence | 149 | 84 | 130 | 103 | 84 |
| Case preparation | 55 | 73 | 96 | 149 | 166 |
| Security classification | 129 | 102 | 136 | 61 | 81 |
| Programs | 138 | 112 | 112 | 71 | 73 |
| Administrative segregation | 223 | 187 | 89 | 4 | 2 |
| Operation/Decisions of the OCIFootnote ** | 36 | 39 | 57 | 80 | 259 |
| Mental health | 76 | 59 | 100 | 49 | 66 |
| Release procedures | 83 | 55 | 83 | 59 | 65 |
| Total of all categoriesFootnote *** | 5,865 | 5,113 | 5,566 | 4,507 | 4,755 |
Source: Office of the Correctional Investigator.
Section C: Federal Offender and Registered Victims Populations
Offenders under the responsibility of CSC
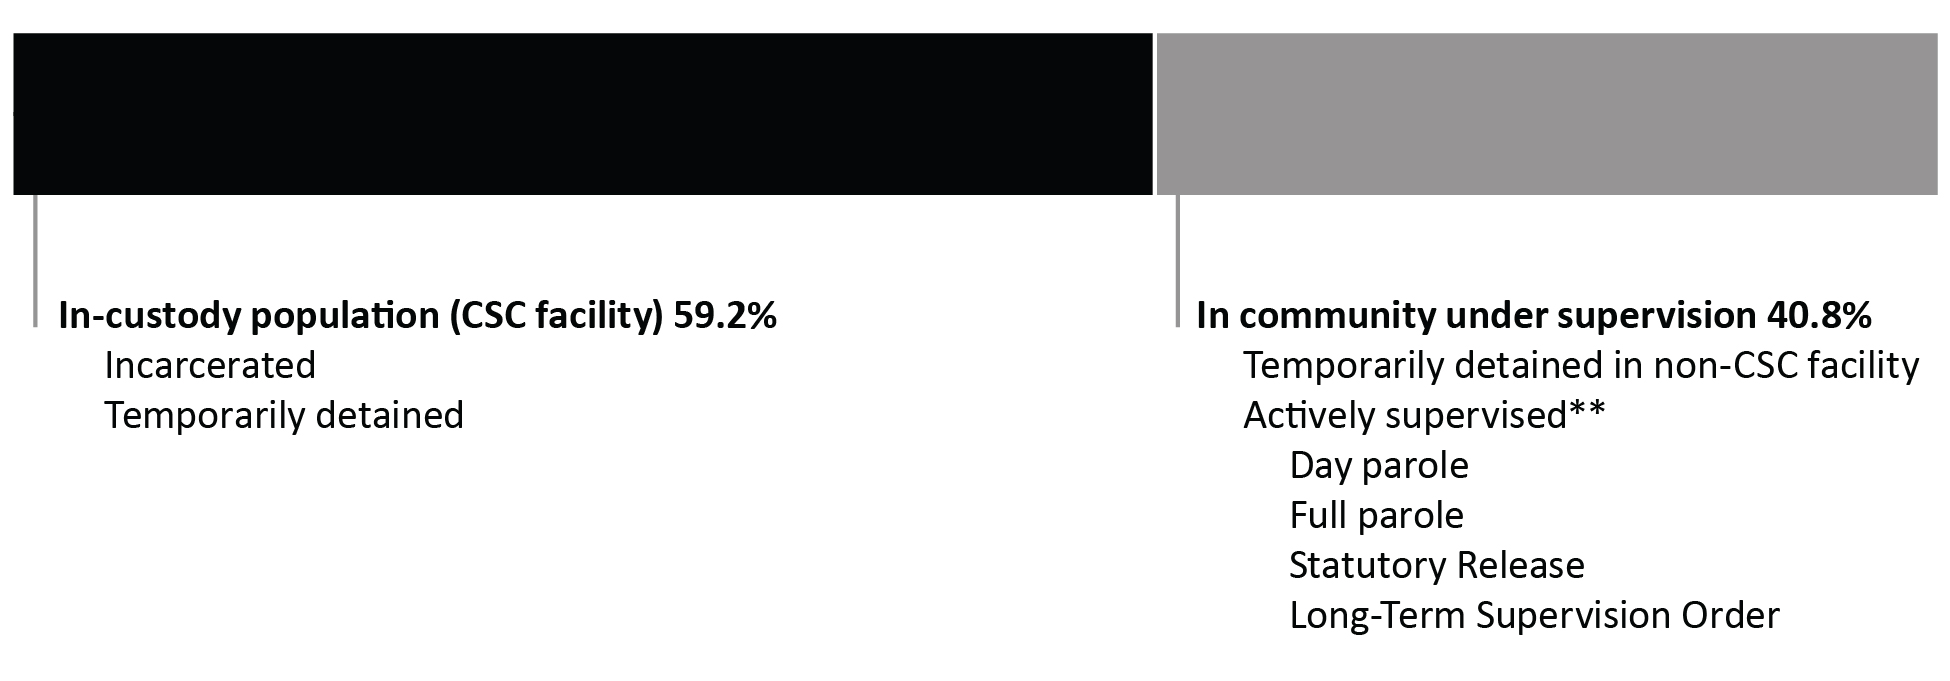
Image description
Bar illustration of the total offender population in fiscal year 2021 to 2022 that is separated into two categories: in-custody population and in community under supervision. First, the in-custody population held at Correctional Service of Canada facilities accounts for 59.2% of the total offender population and includes those who are incarcerated or temporarily detained. Second, the in-community under supervision population of offenders accounts for 40.8% of the total offender population and includes those who are temporarily detained in a non-Correctional Service of Canada facility or are being actively supervised on day parole, full parole, statutory release, or long-term supervision order. Full data are available immediately below.
Source: Correctional Service of Canada.
- From 2012-13 to 2013-14, the in-custody population at a CSC facility increased but started to decline in 2014-15. There was a 0.6% decrease in 2021-22 in comparison with 2020-21.
Definitions C1:
Total Offender Population includes all active offenders, who are incarcerated in a CSC facility, offenders on temporary absence from a CSC facility, offenders who are temporarily detained, offenders who are actively supervised, and offenders who are unlawfully at large for less than 90 days.
CSC Facilities include all federal institutions and federally funded Healing Lodges.
In Custody includes all active offenders incarcerated in a CSC facility, offenders on temporary absence from a CSC facility, offenders who are temporarily detained in a CSC facility and offenders on remand in a CSC facility.
In Community Under Supervision includes all active offenders on day parole, full parole, statutory release, in the community supervised on a long-term supervision order, offenders who are temporarily detained in a non-CSC facility, offenders who are unlawfully at large for less than 90 days, offenders on remand in a non-CSC facility, and offenders supervised and subject to an immigration hold by Canada Border Services Agency.
**Actively Supervised includes all active offenders on day parole, full parole or statutory release, as well as those who are in the community on long-term supervision orders.
Temporarily Detained includes offenders who are physically held in a CSC facility or a non-CSC facility after being suspended for a breach of a parole condition or to prevent a breach of parole conditions.
In addition to the total offender population, there are excluded groups such as:
Federal jurisdiction offenders incarcerated in a Community Correctional Centre or in a non-CSC facility.
Federal jurisdiction offenders deported /extradited including offenders for whom a deportation order has been enforced by Canada Border Services Agency.
Federal offenders on bail which includes offenders on a judicial interim release; they have appealed their conviction or sentence and have been released to await the results of a new trial.
Escaped includes offenders who have absconded from either a correctional facility or while on a temporary absence and whose whereabouts are unknown.
Unlawfully at Large for 90 days or more. This includes offenders who have been released to the community on day parole, full parole, statutory release or a long-term supervision order for whom a warrant for suspension has been issued at least 90 days ago, but has not yet been executed.
| Status | Offenders under the responsibility of CSC | |
|---|---|---|
| # | % | |
In-custody population (CSC facility) |
12,328 | 59.2 |
Incarcerated in CSC facility |
11,673 | 56.1 |
Temporarily detained in CSC facility |
655 | 3.1 |
In community under supervision |
8,479 | 40.8 |
Temporarily detained in non-CSC facility |
205 | 1.0 |
Actively supervisedFootnote ** |
8,274 | 39.8 |
Day parole |
1,357 | 6.5 |
Full parole |
4,096 | 19.7 |
Statutory release |
2,343 | 11.3 |
Long-term supervision order |
477 | 2.3 |
Total |
20,807 | 100.0 |
Source: Correctional Service of Canada.
Number of registered victims and number of offenders with a registered victim: 5-year trend
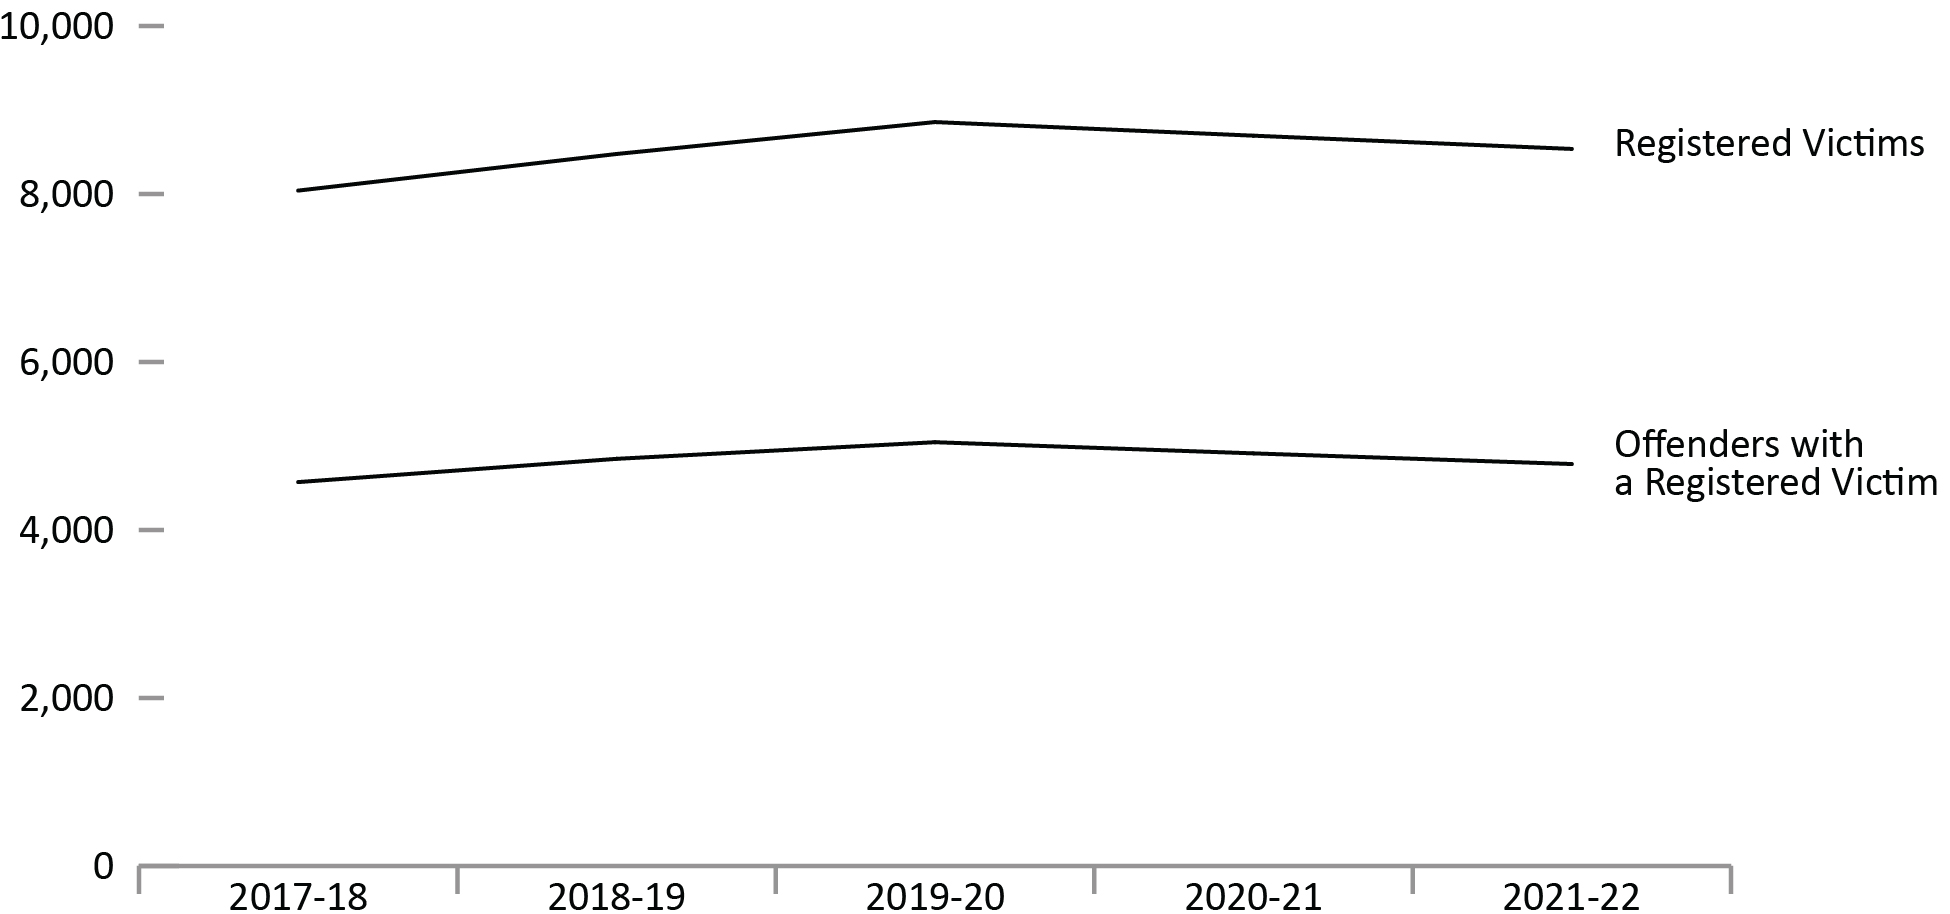
Image description
Line graph showing the number of registered victims and the number of offenders with a registered victim from fiscal year 2017 to 2018 to fiscal year 2021 to 2022. The number of registered victims rose from 8,041 in fiscal year 2017 to 2018 to a peak of 8,857 victims in fiscal year 2019 to 2020, then dropping to 8,537 victims in fiscal year 2021 to 2022. Meanwhile, there were 4,570 offenders with a registered victim in fiscal year 2017 to 2018, rising to a peak of 5,045 offenders in fiscal year 2019 to 2020, before decreasing again in fiscal year 2021 to 2022 at 4,785 offenders. Full data are available immediately below.
Source: Correctional Service of Canada.
- In order to register to receive information, a victim must meet the definition of a victim under the Corrections and Conditional Release Act (CCRA). Victims of federal offenders must be at least 18 years old or legally emancipated or demonstrate they can act for themselves. Victims can register with the Correctional Service of Canada or the Parole Board of Canada.
- Although the number of victims registered with the federal correctional system has fluctuated over the past 5 years, it has increased by 6.2%, from 8,041 in 2017-18 to 8,537 in 2021-22.
- Although the number of offenders with registered victims has fluctuated over the past 5 years, it has increased by 4.7% from 4,570 in 2017-18 to 4,785 in 2021-22.
Figure C2 Notes
The Canadian Victims Bill of Rights defines a victim as any individual who has suffered physical or emotional harm, property damage, or economic loss as the result of the commission of an offence. The law also allows a spouse, a relative or dependent, an individual who is responsible for the care or support of the victim or the care or support of a dependent of the victim, to act on behalf of a victim, if the victim cannot act on their own behalf. Victims include persons harmed by the offender regardless of whether the offender has been prosecuted or not, as long as an official complaint has been made to the police or to the Crown.
Victims do not automatically receive information about the offender who harmed them. If they have been harmed by an offender serving a sentence of 2 years or more, victims must register with the Correctional Service of Canada (CSC) or the Parole Board of Canada to receive information or access services. Registration allows CSC to verify that the individual meets the definition of victim, which is required by law before sharing protected offender information. https://www.csc-scc.gc.ca/victims/003006-7001-en.shtml
Reported data is current up to the end of each fiscal year. A fiscal year runs from April 1 to March 31 of the following year.
| Fiscal year | Number of registered victims | Number of offenders with a registered victim |
|---|---|---|
| 2017-18 | 8,041 | 4,570 |
| 2018-19 | 8,477 | 4,847 |
| 2019-20 | 8,857 | 5,045 |
| 2020-21 | 8,695 | 4,912 |
| 2021-22 | 8,537 | 4,785 |
Source: Correctional Service of Canada.
Table C2 Notes
The Canadian Victims Bill of Rights defines a victim as any individual who has suffered physical or emotional harm, property damage, or economic loss as the result of the commission of an offence. The law also allows a spouse, a relative or dependent, an individual who is responsible for the care or support of the victim or the care or support of a dependent of the victim, to act on behalf of a victim, if the victim cannot act on their own behalf. Victims include persons harmed by the offender regardless of whether the offender has been prosecuted or not, as long as an official complaint has been made to the police or to the Crown.
Victims do not automatically receive information about the offender who harmed them. If they have been harmed by an offender serving a sentence of 2 years or more, victims must register with the Correctional Service of Canada (CSC) or the Parole Board of Canada to receive information or access services. Registration allows CSC to verify that the individual meets the definition of victim, which is required by law before sharing protected offender information. https://www.csc-scc.gc.ca/victims/003006-7001-en.shtml
Reported data is current up to the end of each fiscal year. A fiscal year runs from April 1 to March 31 of the following year.
The number of in-custody offenders: 10-year trend
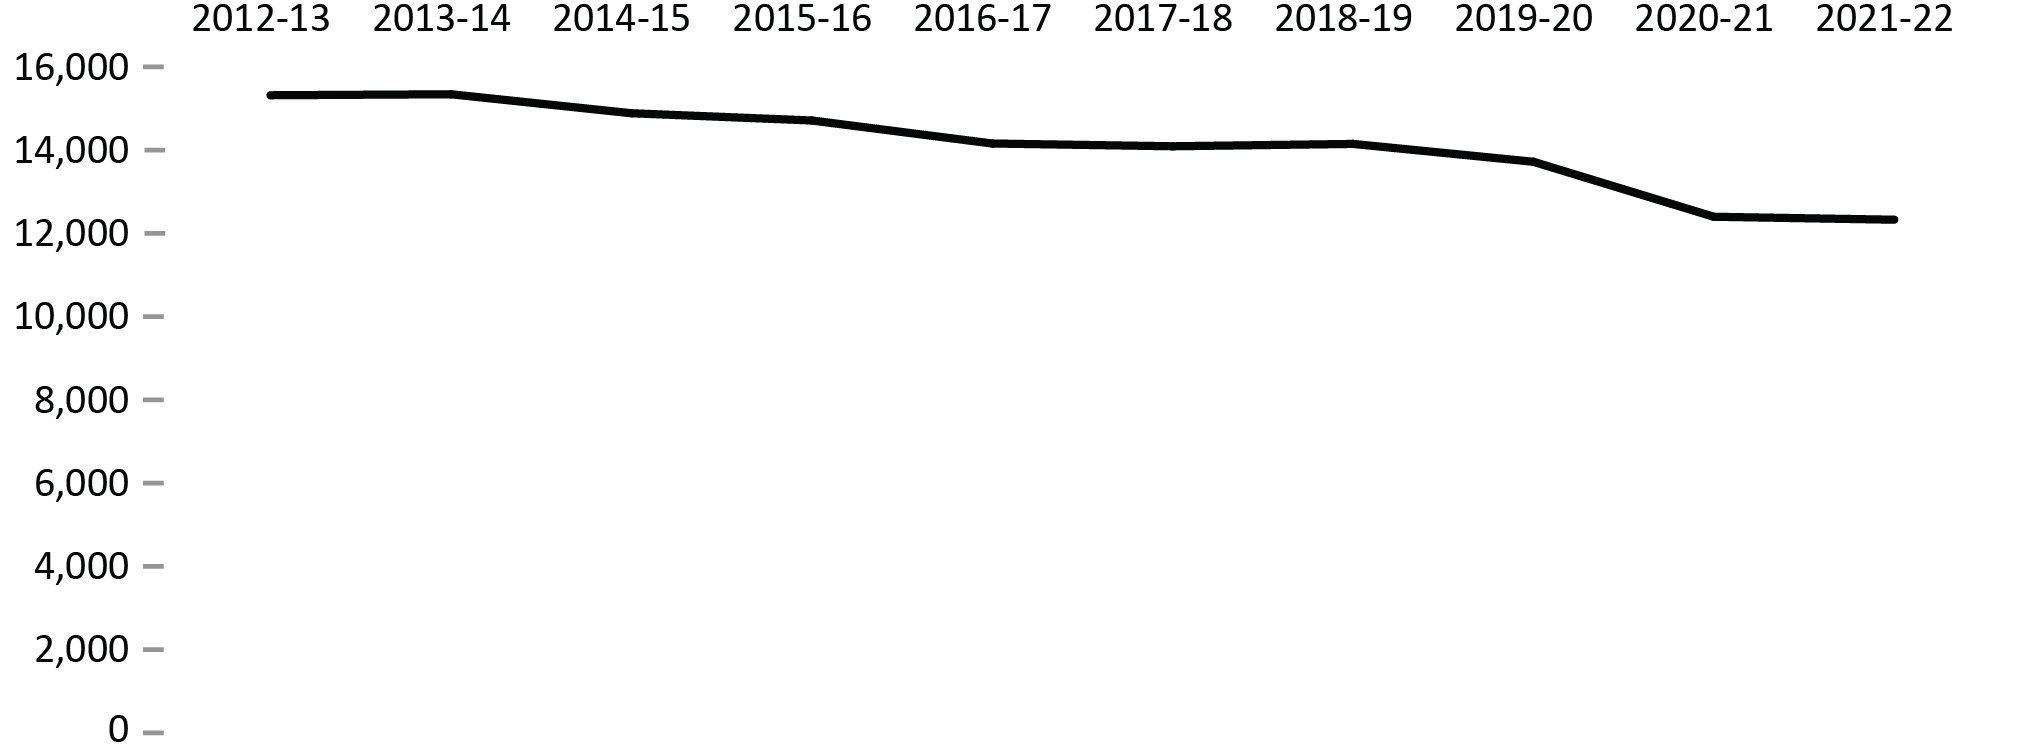
Image description
Line graph showing the number of in-custody offenders in a Correctional Service Canada facility at fiscal year end from fiscal year 2012 to 2013 to fiscal year 2021 to 2022. The number of in-custody offenders rises from 15,318 for fiscal year 2012 to 2013 to a peak of 15,342 in-custody offenders in fiscal year 2013 to 2014, then gradually drops to 14,092 in-custody offenders for fiscal year 2017 to 2018, rising briefly again to 14,149 in-custody offenders for fiscal year 2018 to 2019, then gradually dropping to its lowest point during fiscal year 2021 to 2022 at 12,328 in-custody offenders. Full data are available immediately below.
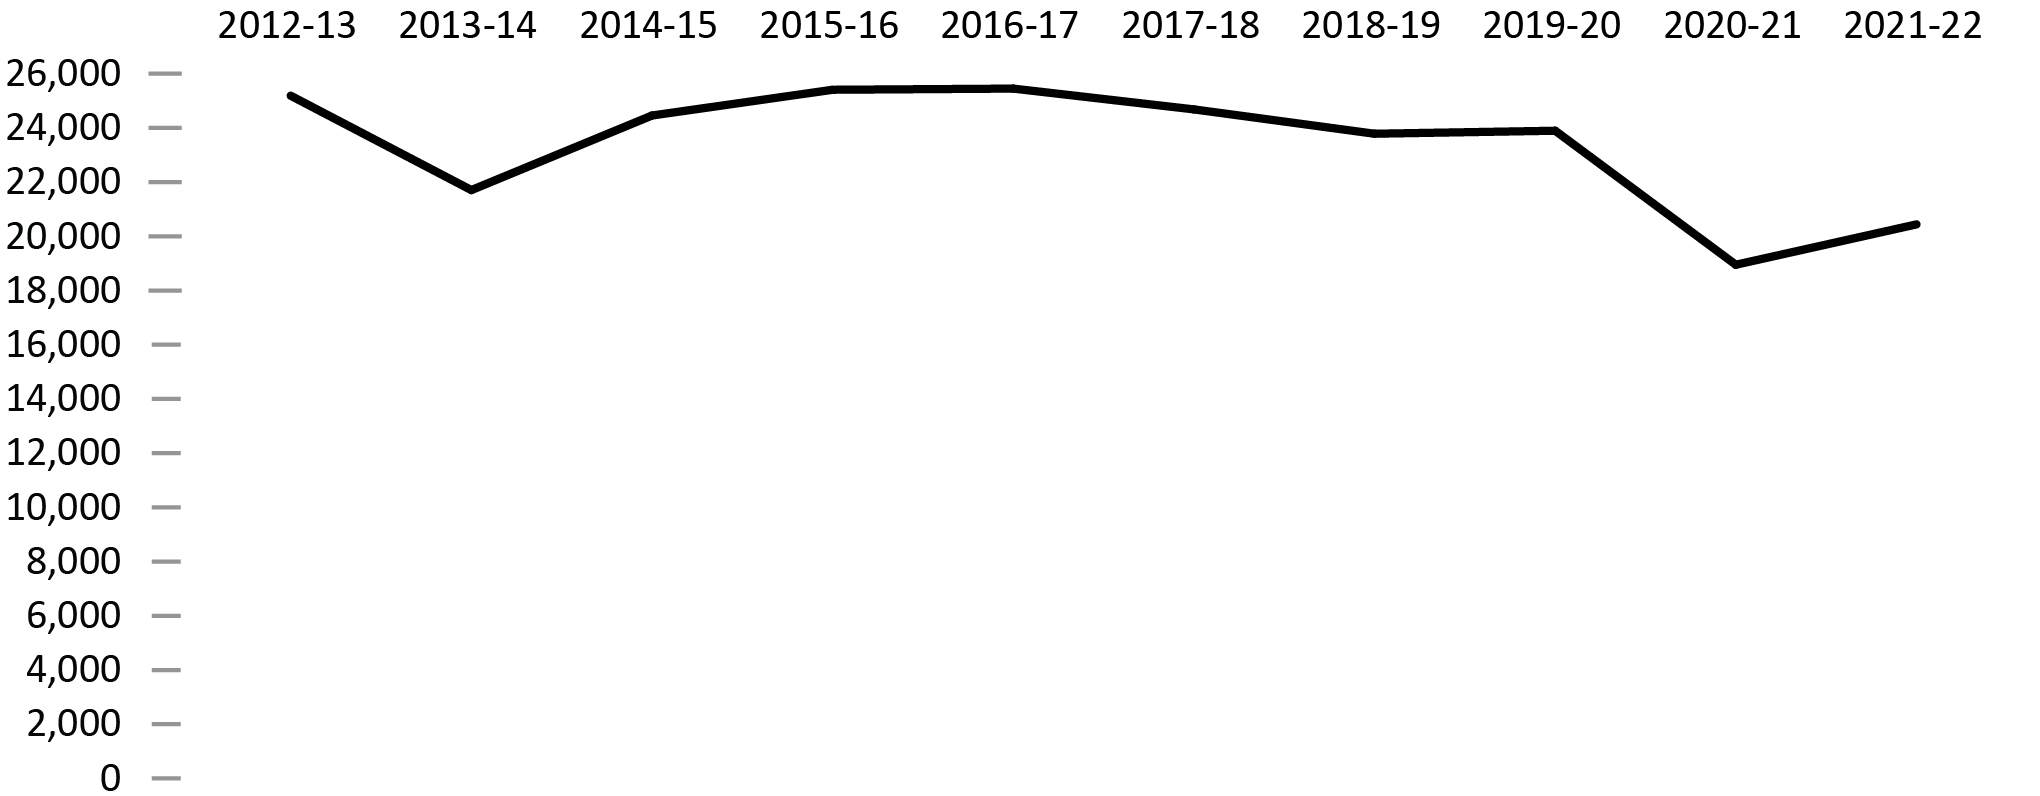
Image description
Line graph showing the number of in-custody offenders in a provincial or territorial facility at fiscal year end from fiscal year 2012 to 2013 to fiscal year 2021 to 2022. The number drops from 25,185 in-custody offenders in fiscal year 2012 to 2013 to 21,704 in-custody offenders in fiscal year 2013 to 2014, then rises to a peak of 25,448 in-custody offenders in fiscal year 2016 to 2017, before dropping to its lowest point of 18,950 in-custody offenders in fiscal year 2020 to 2021, then rising again to 20,439 in-custody offenders in fiscal year 2021 to 2022. Full data are available immediately below.
Source: Table: 35-10-0154-01, Corrections Key Indicator Report for Adults and Youth, Canadian Centre for Justice and Community Safety Statistics, Statistics Canada.
- From 2012-13 to 2013-14, the in-custody population at a CSC facility remained stable but started to decline in 2014-15. There was a 0.6% decrease in 2021-22 in comparison with 2020-21.
- From 2016-17 to 2020-21, the in-custody population in a provincial/territorial facility decreased by 25.5%, followed by a 7.9% increase from 2020-21 to 2021-22.
| Fiscal Year | In custody in a CSCFootnote 1 facilityFootnote * | Provincial/territorialFootnote 2 | ||||
|---|---|---|---|---|---|---|
| Sentenced | Remand | Other/ temporary detention | Total | Total | ||
| 2012-13 | 15,318 | 11,138 | 13,739 | 308 | 25,185 | 40,503 |
| 2013-14 | 15,342 | 9,888 | 11,494 | 322 | 21,704 | 37,046 |
| 2014-15 | 14,886 | 10,364 | 13,650 | 441 | 24,455 | 39,341 |
| 2015-16 | 14,712 | 10,091 | 14,899 | 415 | 25,405 | 40,117 |
| 2016-17 | 14,159 | 9,710 | 15,417 | 321 | 25,448 | 39,607 |
| 2017-18 | 14,092 | 9,545 | 14,833 | 303 | 24,681 | 38,773 |
| 2018-19 | 14,149 | 8,708 | 14,778 | 297 | 23,783 | 37,932 |
| 2019-20 | 13,720 | 7,947 | 15,505 | 442 | 23,894 | 37,614 |
| 2020-21 | 12,399 | 5,881 | 12,753 | 317 | 18,950 | 31,349 |
| 2021-22 | 12,328 | 5,798 | 14,415 | 226 | 20,439 | 32,767 |
Number of admissions to CSC facilities
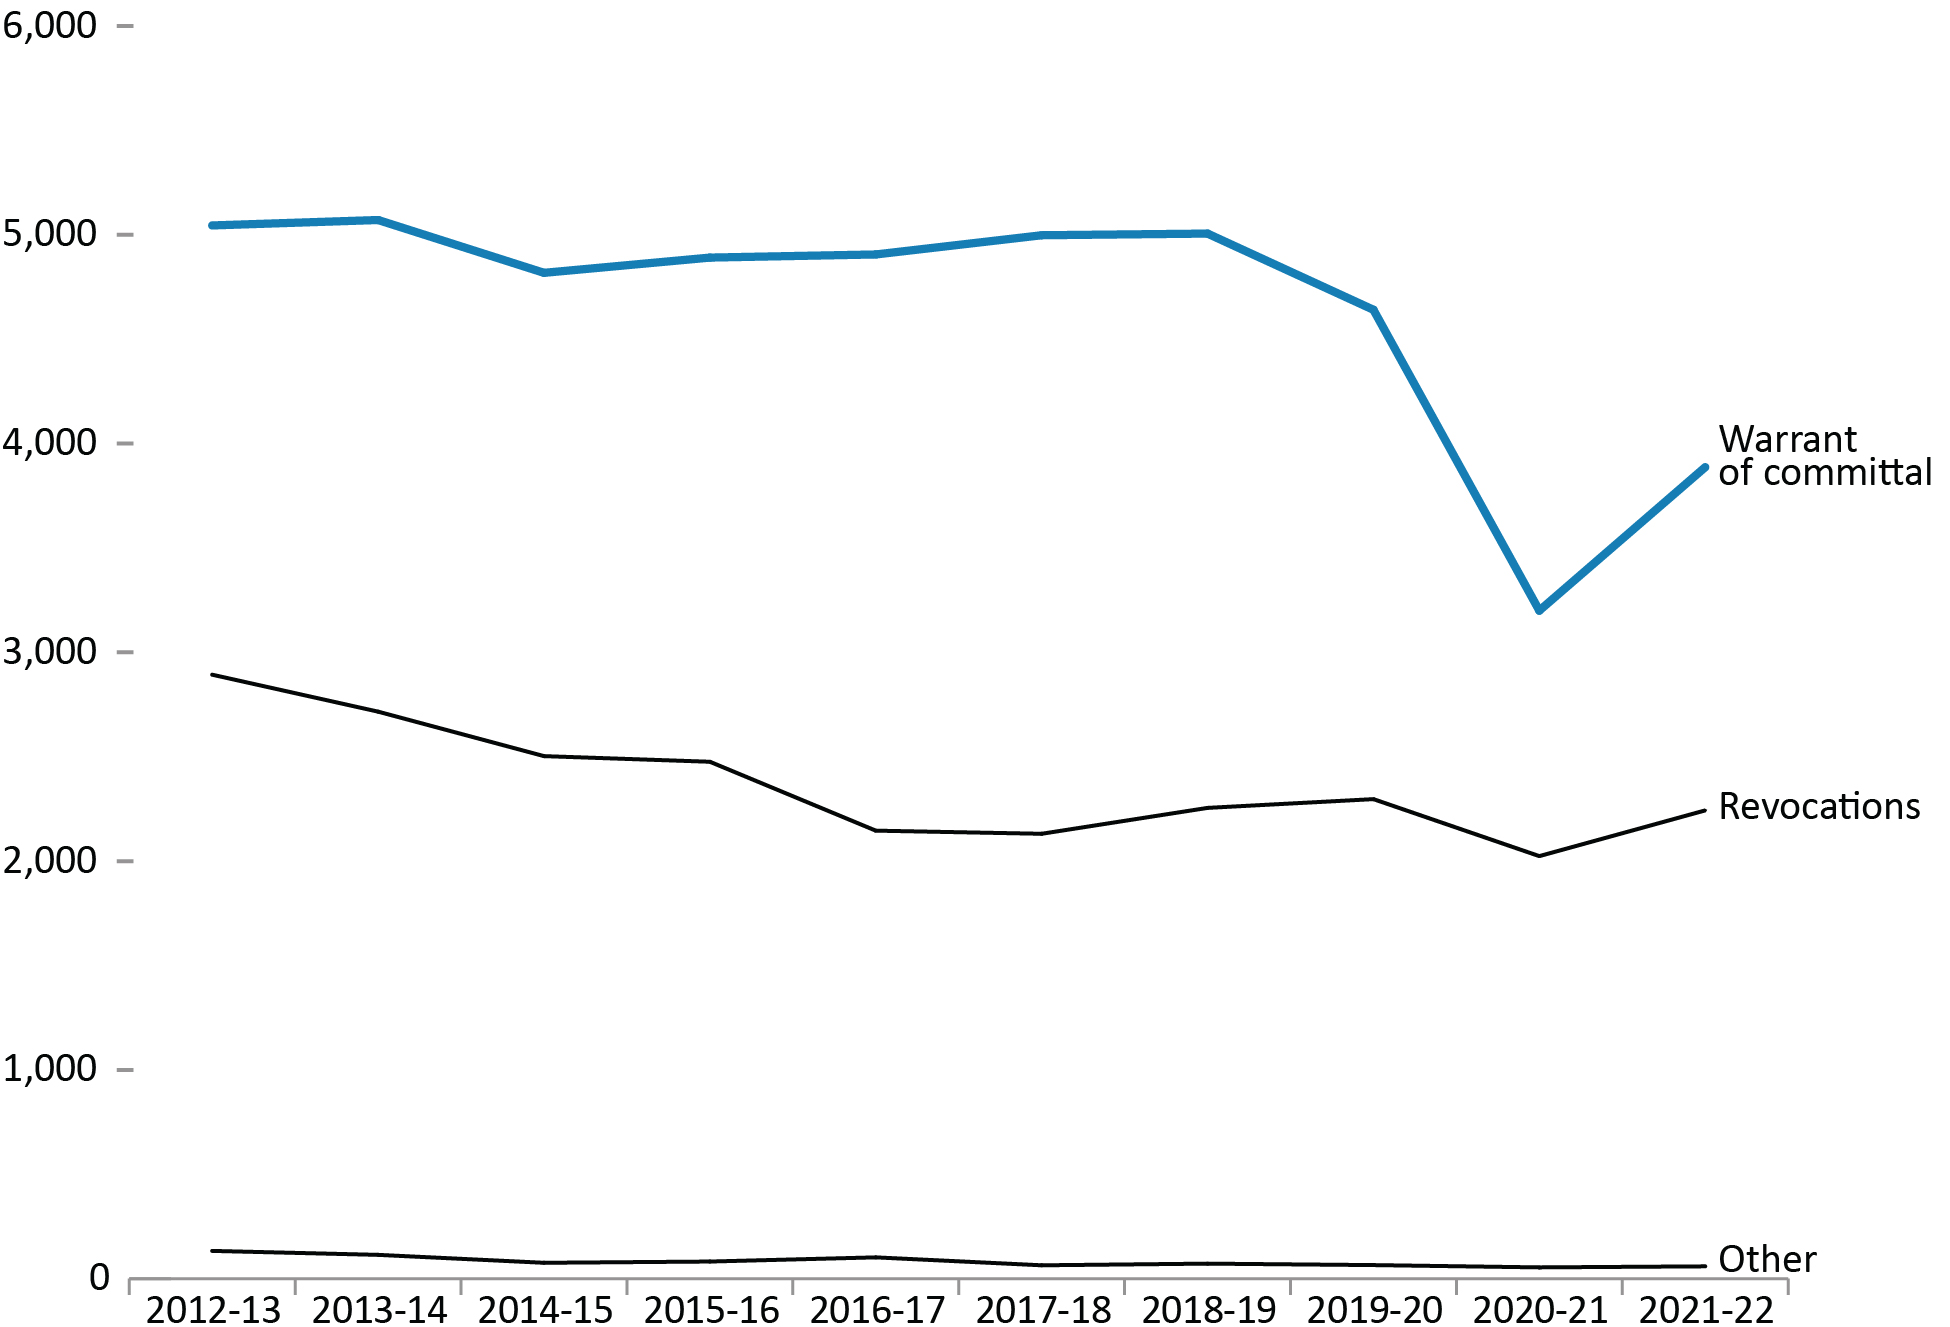
Image description
Line graph showing the number of admissions to Correctional Service Canada facilities from fiscal year 2012 to 2013 until fiscal year 2021 to 2022. The trend line for warrant of committal admissions remained relatively stable between fiscal year 2012 to 2013 and fiscal year 2018 to 2019, fluctuating between around 5,000 admissions and 4,800 admissions. The trend then drops dramatically to its lowest point in fiscal year 2020 to 2021 at 3,200 admissions and then increases slightly in fiscal year 2021 to 2022 at 3,887. Revocations admissions began at 2,131 in fiscal year 2017 to 2018, increasing to 2,255 in fiscal year 2018 to 2019, before rising to 2,297 in fiscal year 2019 to 2020, before dropping to its lowest point in fiscal year 2020 to 2021 at 2,021 and increasing again in fiscal year 2021 to 2022 at 2,243. The trend for the category of “other” admissions was the lowest, with 64 in fiscal year 2017 to 2018, varying slightly over time until reaching its lowest point in fiscal year 2020 to 2021 at 54 admissions. Full data are available immediately below.
Source: Correctional Service Canada.
- After peaking at 8,071 in 2012-13, the number of admissions to CSC facilities has decreased by 23.3% to 6,189 in 2021-22. There was a sharp decrease of 24.6% between 2019-20 to 2020-21, followed by an increase of 17.3% in 2021-22.
- The number of warrant of committal admissions has fluctuated over the past decade but has declined by 23.3% when comparing 2021-22 data (3,887 admissions) to the highest point, which occurred in fiscal year 2013-14 (5,071 admissions).
Figure C4 Notes
Warrant of Committal is a new admission to federal jurisdiction from the courts.
Revocation is when an offender is admitted to federal custody after conditional release and before reaching warrant expiry.
“Other” includes transfers from other jurisdictions (exchange of services), terminations, transfers from foreign countries, and admissions where a release is interrupted as a consequence of a new conviction.
These numbers refer to the total number of admissions to a federal institution or Healing Lodge during each fiscal year and may be greater than the actual number of offenders admitted, since an individual offender may be admitted more than once in a given year.
There is a lag in the data entry of admissions into CSC’s Offender Management System. The admission figures for the most recent year are under-reported by 200-400 admissions at the time of year end data extraction. More accurate figures will be available in the next year’s publication. Please use caution when including the most recent year in any trend analysis.
Reported year periods reflect fiscal years. A fiscal year runs from April 1 to March 31 of the following year.
| 2017-18 | 2018-19 | 2019-20 | 2020-21 | 2021-22 | ||||||
|---|---|---|---|---|---|---|---|---|---|---|
| Females | Males | Females | Males | Females | Males | Females | Males | Females | Males | |
| Warrant of committal | ||||||||||
1st federal sentence |
335 | 3,361 | 347 | 3,448 | 323 | 3,172 | 244 | 2,136 | 240 | 2,692 |
Subsequent federal sentence |
45 | 1,242 | 36 | 1,164 | 30 | 1,102 | 23 | 781 | 38 | 907 |
Provincial sentence |
2 | 13 | 0 | 11 | 1 | 13 | 0 | 16 | 0 | 10 |
Subtotal |
382 | 4,616 | 383 | 4,623 | 354 | 4,287 | 267 | 2,933 | 278 | 3,609 |
Total |
4,998 | 5,006 | 4,641 | 3,200 | 3,887 | |||||
Revocations |
149 | 1,982 | 145 | 2,110 | 177 | 2,120 | 144 | 1,880 | 141 | 2,102 |
Total |
2,131 | 2,255 | 2,297 | 2,024 | 2,243 | |||||
Other |
9 | 55 | 5 | 67 | 4 | 61 | 8 | 46 | 1 | 58 |
Total |
64 | 72 | 65 | 54 | 59 | |||||
Total admissions |
540 | 6,653 | 533 | 6,800 | 535 | 6,468 | 419 | 4,859 | 420 | 5,769 |
| Total admissions | 7,193 | 7,333 | 7,003 | 5,278 | 6,189 | |||||
Source: Correctional Service Canada.
Table C4 Notes
Warrant of Committal is a new admission to federal jurisdiction from the courts.
Revocation is when an offender is admitted to federal custody after conditional release and before reaching warrant expiry.
“Other” includes transfers from other jurisdictions (exchange of services), terminations, transfers from foreign countries, and admissions where a release is interrupted as a consequence of a new conviction.
These numbers refer to the total number of admissions to a federal institution or Healing Lodge during each fiscal year and may be greater than the actual number of offenders admitted, since an individual offender may be admitted more than once in a given year.
There is a lag in the data entry of admissions into CSC’s Offender Management System. The admission figures for the most recent year are under-reported by 200-400 admissions at the time of year end data extraction. More accurate figures will be available in the next year’s publication. Please use caution when including the most recent year in any trend analysis.
Reported year periods reflect fiscal years. A fiscal year runs from April 1 to March 31 of the following year.
Warrant of committal admissions to CSC facilities by sex: 10-year trend
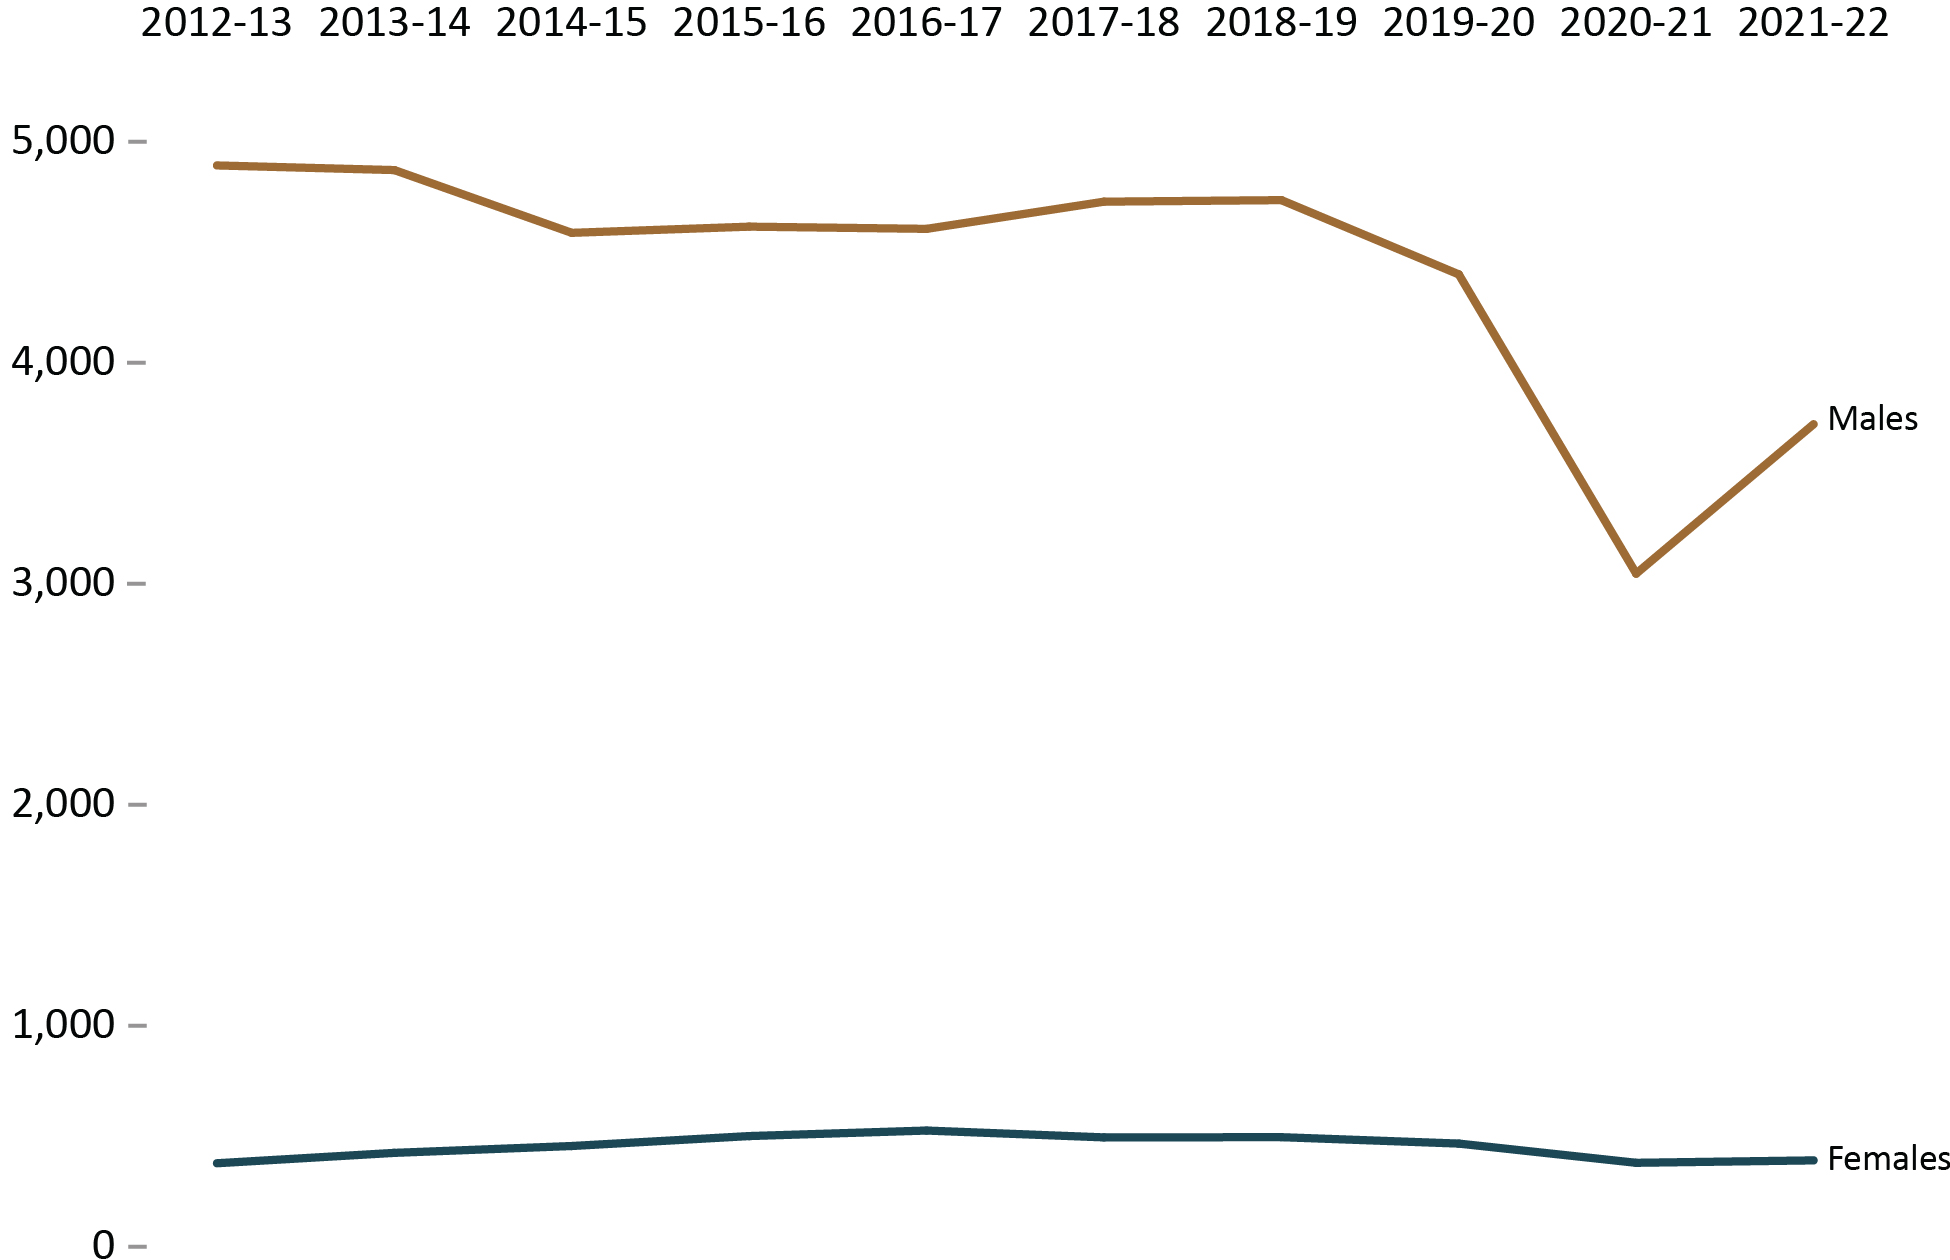
Image description
Line graph showing the number of warrant of committal admissions to Correctional Service Canada facilities by sex from fiscal year 2012 to 2013 until fiscal year 2021 to 2022. The number of males starts at 4,780 admissions in fiscal year 2012 to 2013, then drops steadily until a point of 4,493 admissions in fiscal year 2016 to 2017, rises again to a point of 4,623 admissions in fiscal year 2018 to 2019. The trend then drops drastically to 2,933 admissions in fiscal year 2020 to 2021, followed by a slight rise to 3,609 admissions in 2021 to 2022. The female trend was much lower, beginning in fiscal year 2012 to 2013 with 265 admissions before rising until its peak in fiscal year 2016 to 2017 at 413 admissions, then dropping to 267 admissions in fiscal year 2020 to 2021, before increasing slightly in fiscal year 2021 to 2022 at 278 admissions. Full data are available immediately below.
Source: Correctional Service Canada.
- In the past 5 years, the number of females admitted to CSC facilities on a warrant of committal decreased 27.2% from 382 in 2017-18 to 278 in 2021-22. During the same time period, there was a 21.8% decrease in the number of males admitted to CSC facilities on a warrant of committal from 4,616 in 2017-18 to 3,609 in 2021-22.
- Overall, females continue to represent a small proportion of the total number of warrant of committal admissions (i.e., 7.2% in 2021-22).
- At the end of fiscal year 2021-22, there were 588 females and 11,740 males in custody within Correctional Service Canada facilities.
Figure C5 Notes
A warrant of committal is a new admission to federal jurisdiction from the courts.
These numbers refer to the total number of admissions to a federal institution or Healing Lodge during each fiscal year and may be greater than the actual number of offenders admitted, since an individual offender may be admitted more than once in a given year.
There is a lag in the data entry of admissions into CSC's Offender Management System. The admission figures for the most recent year are under-reported by 200-400 admissions at the time of year end data extraction. More accurate figures will be available in the next year's publication. Please use caution when including the most recent year in any trend analysis.
Reported year periods reflect fiscal years. A fiscal year runs from April 1 to March 31 of the following year.
| Fiscal year | Females | Males | Total | ||
|---|---|---|---|---|---|
| # | % | # | % | # | |
| 2012-13 | 265 | 5.3 | 4,780 | 94.7 | 5,045 |
| 2013-14 | 312 | 6.2 | 4,759 | 93.8 | 5,071 |
| 2014-15 | 343 | 7.1 | 4,475 | 92.9 | 4,818 |
| 2015-16 | 388 | 7.9 | 4,503 | 92.1 | 4,891 |
| 2016-17 | 413 | 8.4 | 4,493 | 91.6 | 4,906 |
| 2017-18 | 382 | 7.6 | 4,616 | 92.4 | 4,998 |
| 2018-19 | 383 | 7.7 | 4,623 | 92.3 | 5,006 |
| 2019-20 | 354 | 7.6 | 4,287 | 92.4 | 4,641 |
| 2020-21 | 267 | 8.3 | 2,933 | 91.7 | 3,200 |
| 2021-22 | 278 | 7.2 | 3,609 | 92.8 | 3,887 |
Source: Correctional Service of Canada.
Table C5 Notes
A warrant of committal is a new admission to federal jurisdiction from the courts.
These numbers refer to the total number of admissions to a federal institution or Healing Lodge during each fiscal year and may be greater than the actual number of offenders admitted, since an individual offender may be admitted more than once in a given year.
There is a lag in the data entry of admissions into CSC's Offender Management System. The admission figures for the most recent year are under-reported by 200-400 admissions at the time of year end data extraction. More accurate figures will be available in the next year's publication. Please use caution when including the most recent year in any trend analysis.
Reported year periods reflect fiscal years. A fiscal year runs from April 1 to March 31 of the following year.
Number of registered victims by gender: 5-year trend
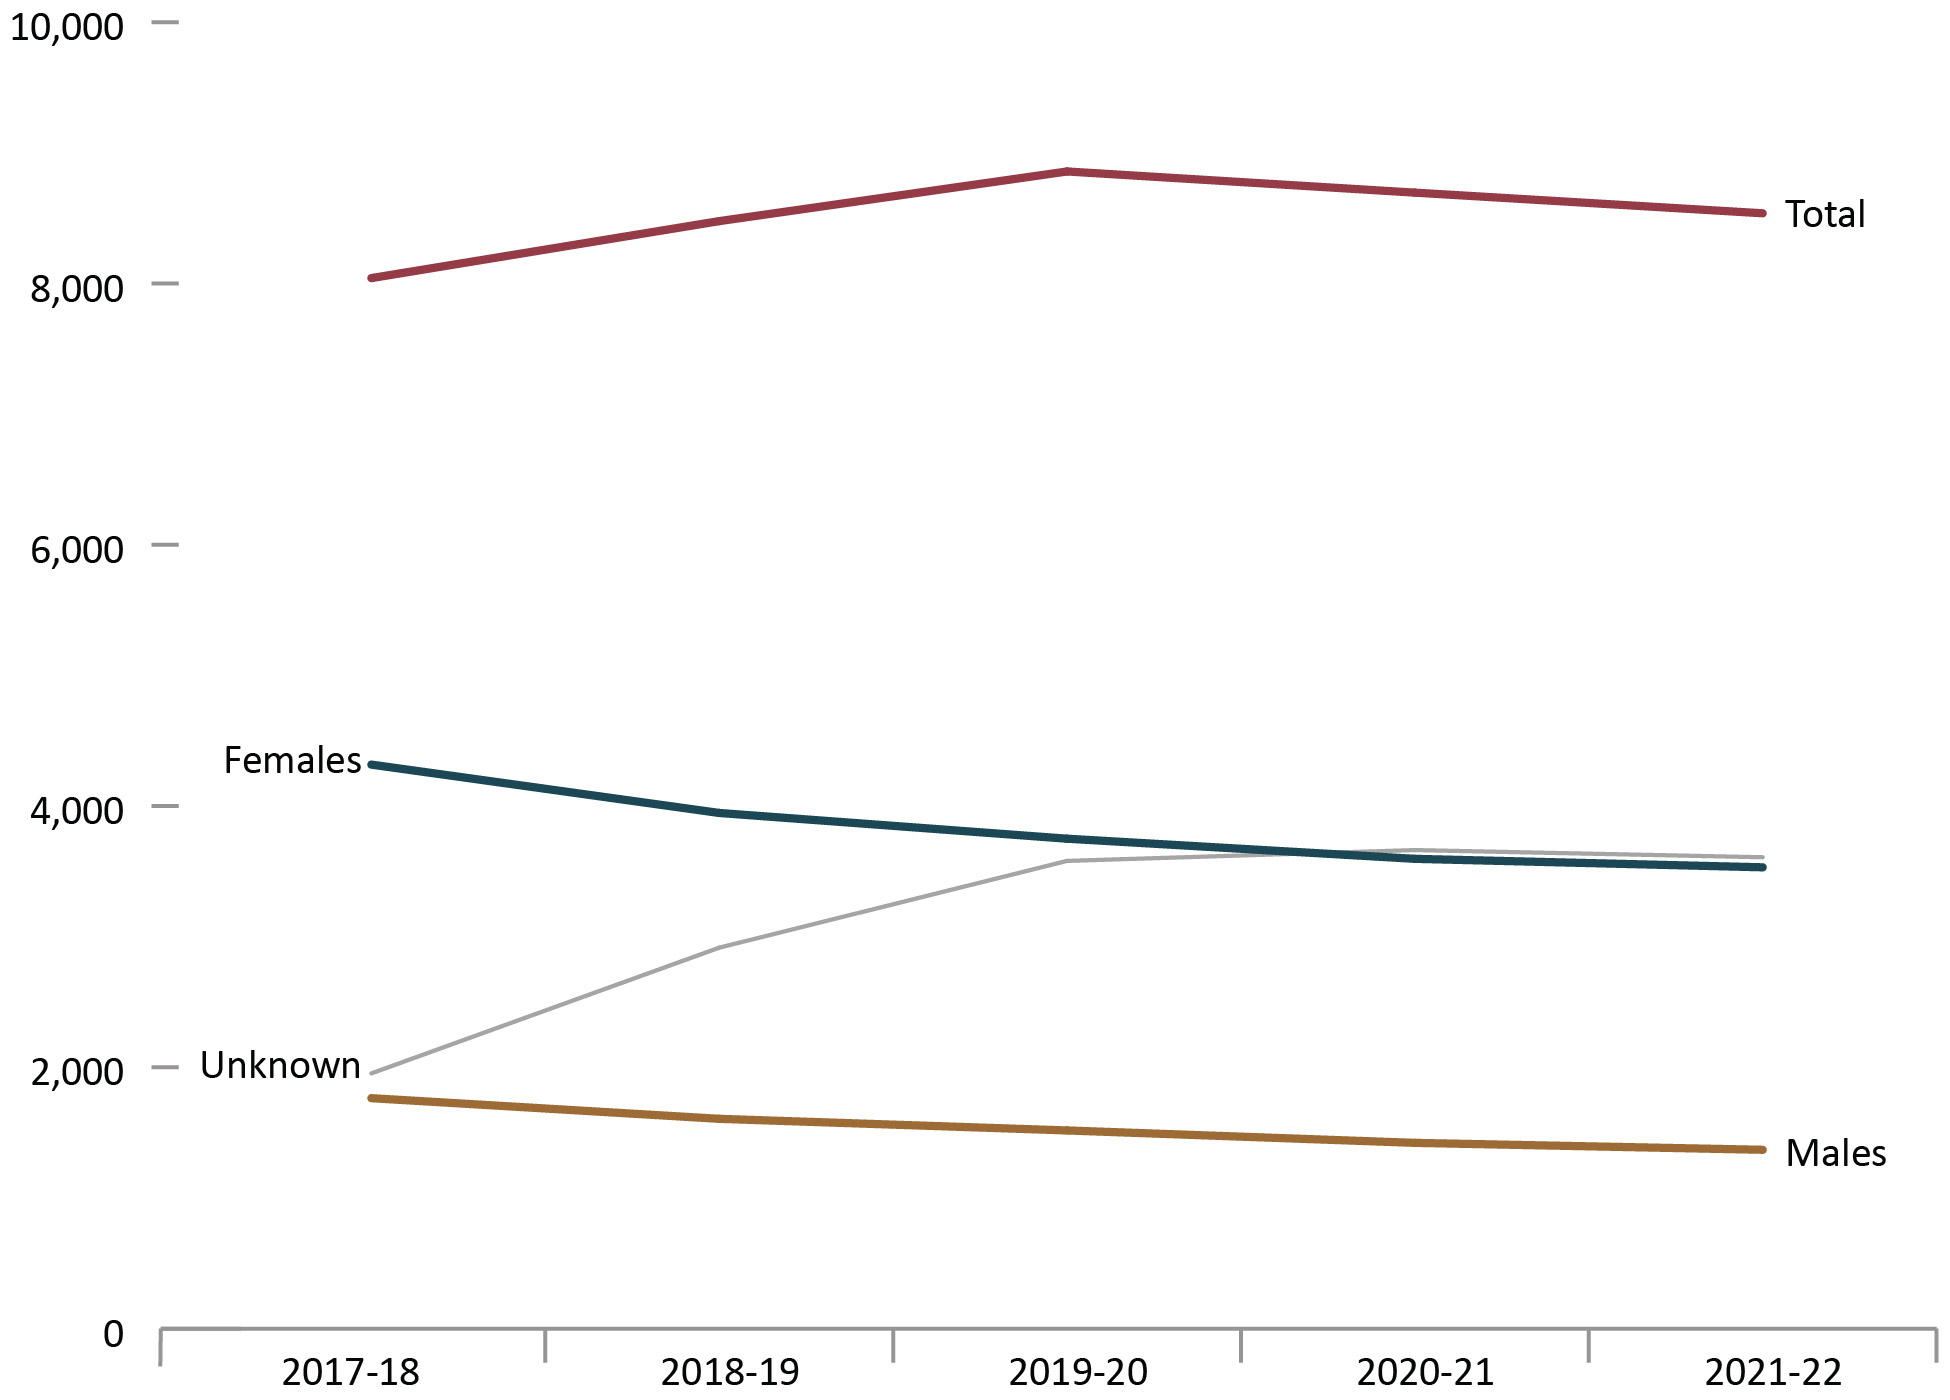
Image description
Line graph of the number of registered victims by gender from fiscal year 2017 to 2018 until fiscal year 2021 to 2022. The total number of registered victims rose steadily from 8,041 in fiscal year 2017 to 2018 to 8,857 in fiscal year 2019 to 2020, before dropping to 8,537 in fiscal year 2021 to 2022. Of the female, male, and unknown gender categories, the female trend was highest starting at 4,317 female registered victims in fiscal year 2017 to 2018, decreasing steadily until reaching 3,531 female registered victims in fiscal year 2021 to 2022. The number of registered victims of an unknown gender rose from 1,954 in fiscal year 2017 to 2018 to 3,633 registered victims of an unknown gender in fiscal year 2020 to 2021, followed by a slight decrease in 2021 to 2022 at 3,608 registered victims of an unknown gender. The number of male registered victims was lowest, starting at 1,764 in fiscal year 2017 to 2018, then decreasing steadily until reaching 1,369 male registered victims in fiscal year 2021 to 2022. Full data are available immediately below.
Source: Correctional Service of Canada.
- Most registered victims were of unknown gender (42.3%), or identified as female (41.4%).
- Although not displayed, 2 registered victims identified as another genderFootnote ** and 27 registered victims did not want to provide a gender at the end of fiscal year 2021-22.
Reported data is current up to the end of each fiscal year. A fiscal year runs from April 1 to March 31 of the following year.
| 2017-18 | 2018-19 | 2019-20 | 2020-21 | 2021-22 | |
|---|---|---|---|---|---|
Male |
1,764 | 1,606 | 1,517 | 1,422 | 1,369 |
Female |
4,317 | 3,947 | 3,750 | 3,596 | 3,531 |
Another genderFootnote ** |
NR |
NR |
0 | 0 | 2 |
Does not want to provide |
6 | 8 | 10 | 14 | 27 |
Unknown |
1,954 | 2,916 | 3,580 | 3,663 | 3,608 |
Total |
8,041 | 8,477 | 8,857 | 8,695 | 8,537 |
Source: Correctional Service of Canada.
CSC total offender population by sentence length
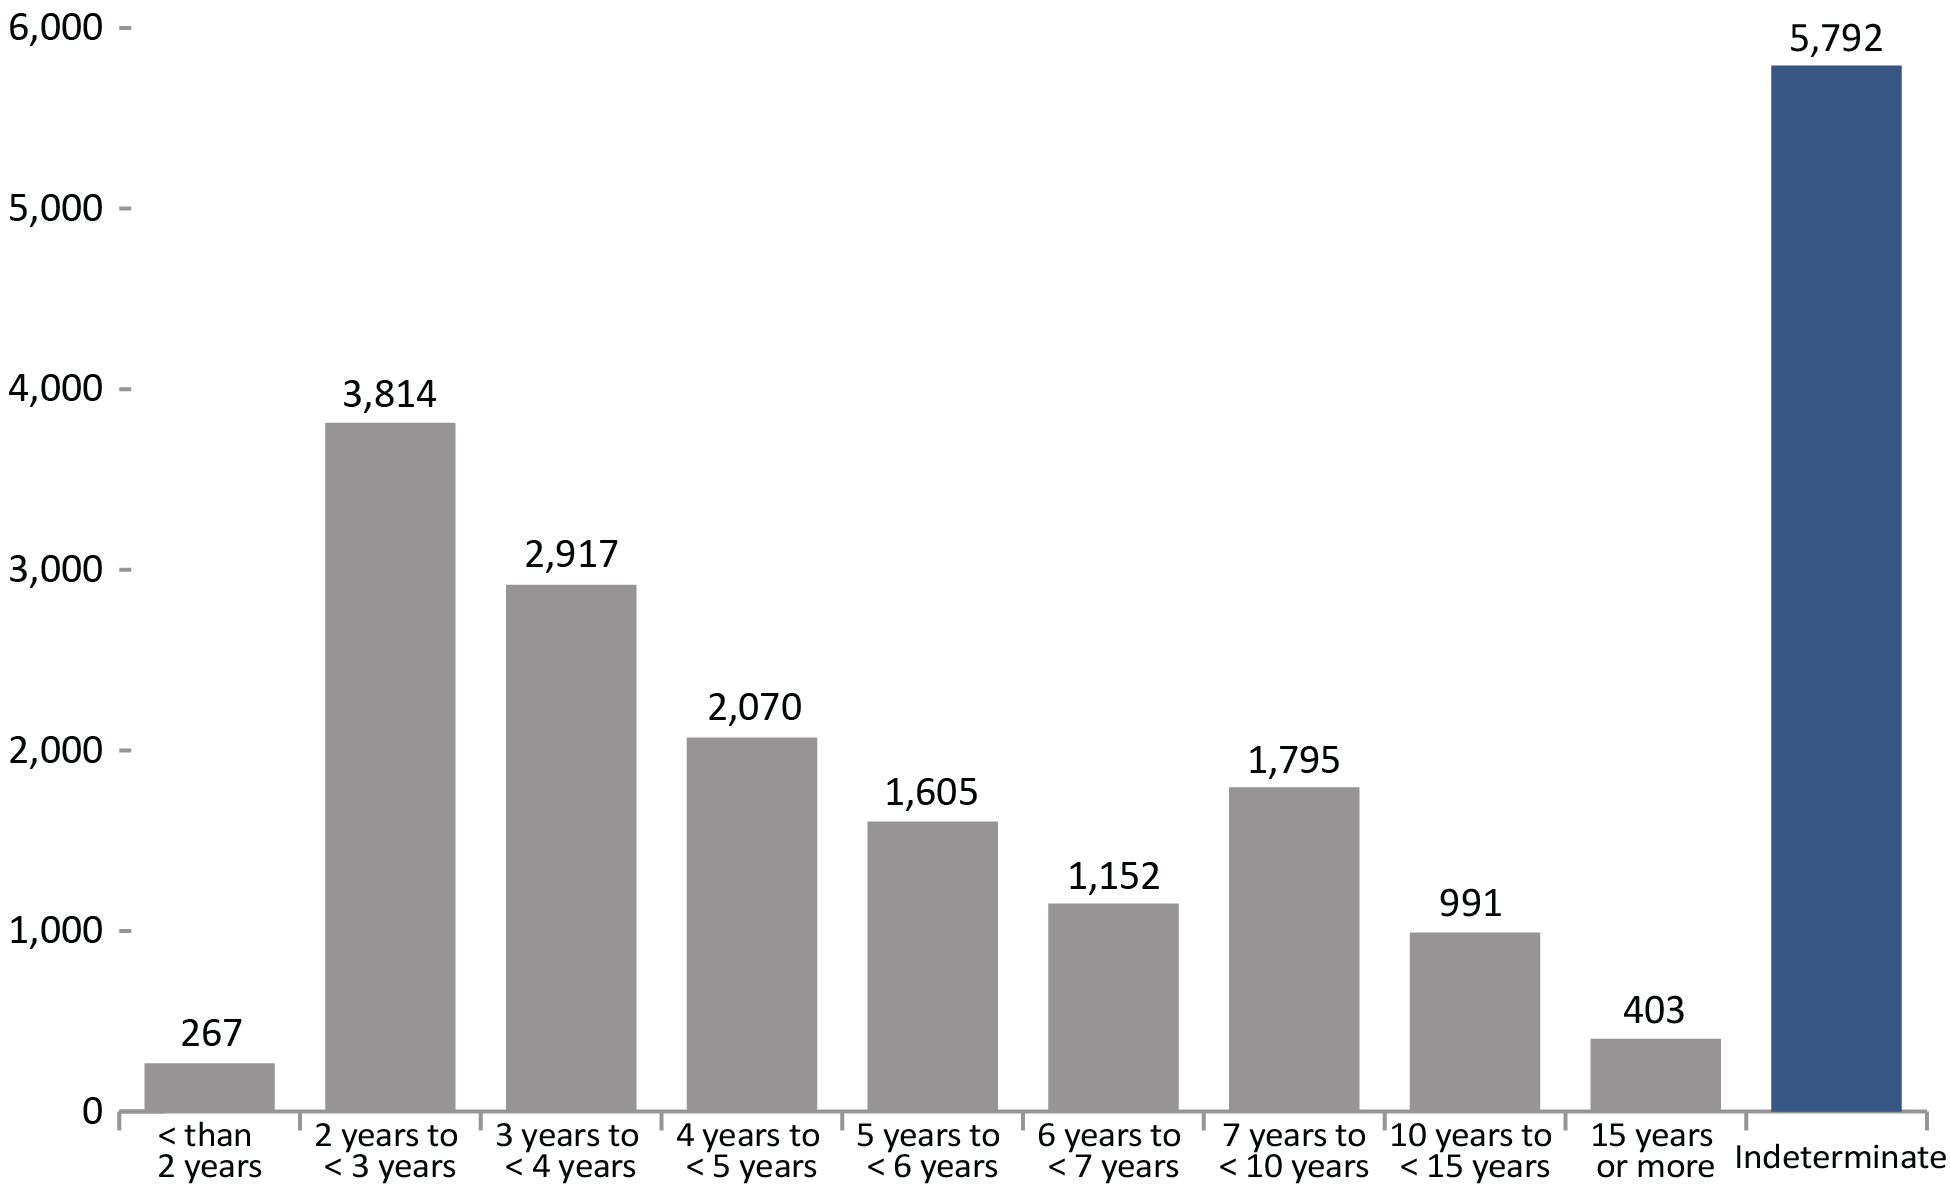
Image description
Bar graph showing the sentence length of the Correctional Services of Canada total offender population in fiscal year 2021 to 2022. There were 267 sentences of less than 2 years; 3,814 sentences of 2 to less than 3 years; 2,917 sentences of 3 to less than 4 years; 2,070 sentences of 4 to less than 5 years; 1,605 sentences of 5 to less than 6 years; 1,152 sentences of 6 to less than 7 years; 1,795 sentences of 7 to less than 10 years; 991 sentences of 10 to less than 15 years; 403 sentences of 15 years or more; and 5,792 sentences of a life sentence or an indeterminate sentence. Full data are available immediately below.
Source: Correctional Service of Canada.
- In 2021-22, almost half (43.6%) of the total offender population was serving a sentence of less than 5 years, with 18.3% serving a sentence between 2 years and less than 3 years.
- 5,792 offenders were serving an indeterminate sentence, representing 27.8% of the total offender population. The total number of offenders with indeterminate sentences has increased 3.1% since 2017-18 from 5,619 to 5,792 in 2021-22.
Figure C7 Notes
As a result of a data quality issue, sentence length information on 1 offender was not available at the time of the data extraction; therefore, the total of the sentence length grouping will not add up to the offender population results for 2021-22.
Total Offender Population includes all active offenders, who are incarcerated in a CSC facility, offenders on temporary absence from a CSC facility, offenders who are temporarily detained, offenders who are actively supervised, and offenders who are unlawfully at large for less than 90 days.
The group of offenders serving a sentence less than 2 years includes offenders transferred from foreign countries or offenders under a long-term supervision order who received a new sentence of less than 2 years.
Indeterminate means that the offender’s term of imprisonment does not have an end date. The parole Board of Canada reviews the case after 7 years and every 2 years after that.
Reported year periods reflect fiscal years. A fiscal year runs from April 1 to March 31 of the following year.
| Sentence length | 2017-18 | 2018-19 | 2019-20 | 2020-21 | 2021-22 | |||||
|---|---|---|---|---|---|---|---|---|---|---|
| # | % | # | % | # | % | # | % | # | % | |
| < than 2 years | 348 | 1.5 | 307 | 1.3 | 307 | 1.3 | 293 | 1.4 | 267 | 1.3 |
| 2 years to < 3 years | 5,412 | 23.3 | 5,457 | 23.3 | 5,149 | 22.3 | 4,321 | 20.1 | 3,814 | 18.3 |
| 3 years to < 4 years | 3,378 | 14.5 | 3,436 | 14.6 | 3,389 | 14.7 | 3,060 | 14.2 | 2,917 | 14.0 |
| 4 years to < 5 years | 2,342 | 10.1 | 2,368 | 10.1 | 2,371 | 10.3 | 2,157 | 10.0 | 2,070 | 9.9 |
| 5 years to < 6 years | 1,674 | 7.2 | 1,711 | 7.3 | 1,692 | 7.3 | 1,598 | 7.4 | 1,605 | 7.7 |
| 6 years to < 7 years | 1,186 | 5.1 | 1,172 | 5.0 | 1,153 | 5.0 | 1,130 | 5.3 | 1,152 | 5.5 |
| 7 years to < 10 years | 1,811 | 7.8 | 1,857 | 7.9 | 1,841 | 8.0 | 1,795 | 8.3 | 1,795 | 8.6 |
| 10 years to < 15 years | 979 | 4.2 | 998 | 4.3 | 1,010 | 4.4 | 999 | 4.6 | 991 | 4.8 |
| 15 years or more | 474 | 2.0 | 445 | 1.9 | 426 | 1.8 | 404 | 1.9 | 403 | 1.9 |
| Life and/or indeterminate Sentence | 5,619 | 24.2 | 5,713 | 24.3 | 5,764 | 25.0 | 5,755 | 26.8 | 5,792 | 27.8 |
| Total | 23,223 | 100.0 | 23,464 | 100.0 | 23,102 | 100.0 | 21,512 | 100.0 | 20,807 | 100.0 |
Source: Correctional Service of Canada.
Table C7 Notes
As a result of a data quality issue, sentence length information on 1 offender was not available at the time of the data extraction; therefore, the total of the sentence length grouping will not add up to the offender population results for 2021-22.
Total Offender Population includes all active offenders, who are incarcerated in a CSC facility, offenders on temporary absence from a CSC facility, offenders who are temporarily detained, offenders who are actively supervised, and offenders who are unlawfully at large for less than 90 days.
The group of offenders serving a sentence less than 2 years includes offenders transferred from foreign countries or offenders under a long-term supervision order who received a new sentence of less than 2 years.
Indeterminate means that the offender’s term of imprisonment does not have an end date. The parole Board of Canada reviews the case after 7 years and every 2 years after that.
Reported year periods reflect fiscal years. A fiscal year runs from April 1 to March 31 of the following year.
Offences of victimization among registered victims
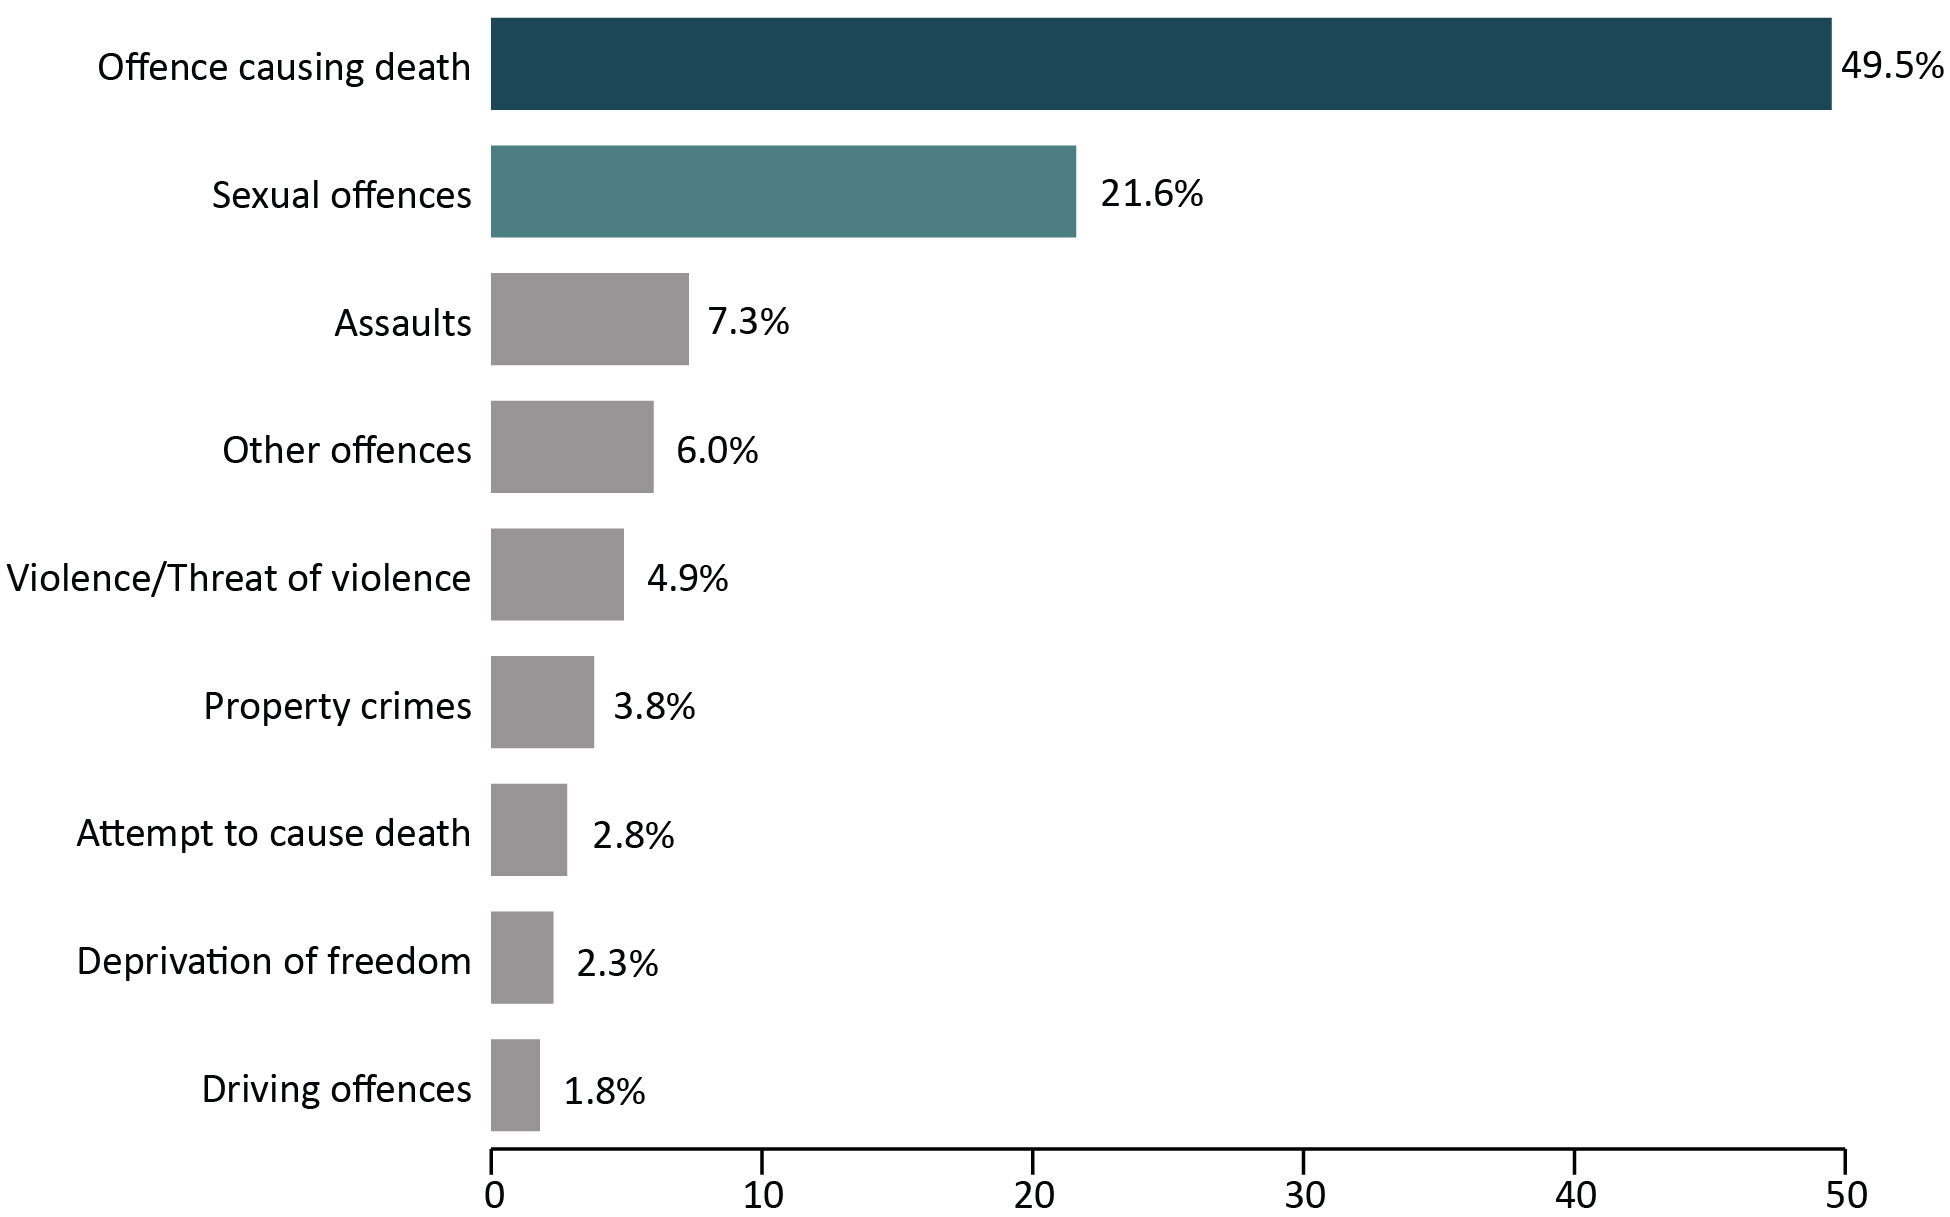
Image description
Bar graph showing the offences of victimization among registered victims by offence type in fiscal year 2021 to 2022. Offences causing death account for 49.5 percent of offences of victimization; followed by sexual offences which account for 21.6 percent; assaults which account for 7.3 percent; other offences which account for 6 percent; involving violence or threats of violence which account for 4.9 percent; property crimes which account for 3.8 percent; attempts to cause deaths which account for 2.8 percent; deprivation of freedom which account for 2.3 percent; and finally, driving offences which account for 1.8 percent. Full data are available immediately below.
Source: Correctional Service of Canada.
- Offences causing death accounted for almost half of offences of victimization (49.5%).
- Sexual offences were the second most common offence of victimization (21.6%).
Figure C8 Notes
The Canadian Victims Bill of Rights defines a victim as any individual who has suffered physical or emotional harm, property damage, or economic loss as the result of the commission of an offence. The law also allows a spouse, a relative or dependant, an individual who is responsible for the care or support of the victim or the care or support of a dependant of the victim, to act on behalf of a victim, if the victim cannot act on their own behalf. Victims include persons harmed by the offender regardless of whether the offender has been prosecuted or not, as long as an official complaint has been made to the police or to the Crown.
Victims do not automatically receive information about the offender who harmed them. If they have been harmed by an offender serving a sentence of 2 years or more, victims must register with the Correctional Service of Canada (CSC) or the Parole Board of Canada to receive information or access services. Registration allows CSC to verify that the individual meets the definition of victim, which is required by law before sharing protected offender information. https://www.csc-scc.gc.ca/victims/003006-7001-en.shtml
Offences of victimization are acts the offender committed that harmed the victim, and have been confirmed using police reports or judge's comments. The offender may not have been convicted of each act or may be serving a federal sentence for different offences. This could be a result of plea deals, because charges were not pursued by the Crown, or the offence may be from a previous sentence or a provincial sentence. Offences of victimization are limited to victims registered with CSC.
More than one offence of victimization may be recorded for each victim.
"Deprivation of freedom" offences are offences such as kidnapping, forcible confinement, hostage taking, or abduction.
Reported year periods reflect fiscal years. A fiscal year runs from April 1 to March 31 of the following year.
| 2017-18 | 2018-19 | 2019-20 | 2020-21 | 2021-22 | ||||||
|---|---|---|---|---|---|---|---|---|---|---|
| # | % | # | % | # | % | # | % | # | % | |
| Offence causing death | 5,128 | 49.8 | 5,398 | 48.5 | 5,629 | 47.8 | 5,597 | 48.5 | 5,653 | 49.5 |
| Sexual offences | 2,130 | 20.7 | 2,366 | 21.3 | 2,517 | 21.4 | 2,483 | 21.5 | 2,464 | 21.6 |
| Assaults | 784 | 7.6 | 876 | 7.9 | 932 | 7.9 | 903 | 7.8 | 828 | 7.3 |
| Other offences | 600 | 5.8 | 683 | 6.1 | 762 | 6.5 | 696 | 6.0 | 689 | 6.0 |
| Violence/threat of violence | 482 | 4.7 | 502 | 4.5 | 540 | 4.6 | 555 | 4.8 | 555 | 4.9 |
| Property crimes | 458 | 4.5 | 508 | 4.6 | 540 | 4.6 | 501 | 4.3 | 438 | 3.8 |
| Attempt to cause death | 296 | 2.9 | 317 | 2.8 | 338 | 2.9 | 341 | 3.0 | 325 | 2.8 |
| Deprivation of freedom | 249 | 2.4 | 263 | 2.4 | 279 | 2.4 | 260 | 2.3 | 260 | 2.3 |
| Driving offences | 160 | 1.6 | 210 | 1.9 | 229 | 1.9 | 198 | 1.7 | 204 | 1.8 |
| Unknown | 5 | 0.0 | 4 | 0.0 | 4 | 0.0 | 3 | 0.0 | 2 | 0.0 |
| Total number of offences | 10,292 | 100.0 | 11,127 | 100.0 | 11,770 | 100.0 | 11,537 | 100.0 | 11,418 | 100.0 |
Source: Correctional Service of Canada.
Table C8 Notes
The Canadian Victims Bill of Rights defines a victim as any individual who has suffered physical or emotional harm, property damage, or economic loss as the result of the commission of an offence. The law also allows a spouse, a relative or dependant, an individual who is responsible for the care or support of the victim or the care or support of a dependant of the victim, to act on behalf of a victim, if the victim cannot act on their own behalf. Victims include persons harmed by the offender regardless of whether the offender has been prosecuted or not, as long as an official complaint has been made to the police or to the Crown.
Victims do not automatically receive information about the offender who harmed them. If they have been harmed by an offender serving a sentence of 2 years or more, victims must register with the Correctional Service of Canada (CSC) or the Parole Board of Canada to receive information or access services. Registration allows CSC to verify that the individual meets the definition of victim, which is required by law before sharing protected offender information. https://www.csc-scc.gc.ca/victims/003006-7001-en.shtml
Offences of victimization are acts the offender committed that harmed the victim, and have been confirmed using police reports or judge's comments. The offender may not have been convicted of each act or may be serving a federal sentence for different offences. This could be a result of plea deals, because charges were not pursued by the Crown, or the offence may be from a previous sentence or a provincial sentence. Offences of victimization are limited to victims registered with CSC.
More than one offence of victimization may be recorded for each victim.
"Deprivation of freedom" offences are offences such as kidnapping, forcible confinement, hostage taking, or abduction.
Reported data is current up to the end of each fiscal year. A fiscal year runs from April 1 to March 31 of the following year.
Warrant of committal admissions to a CSC facility by age
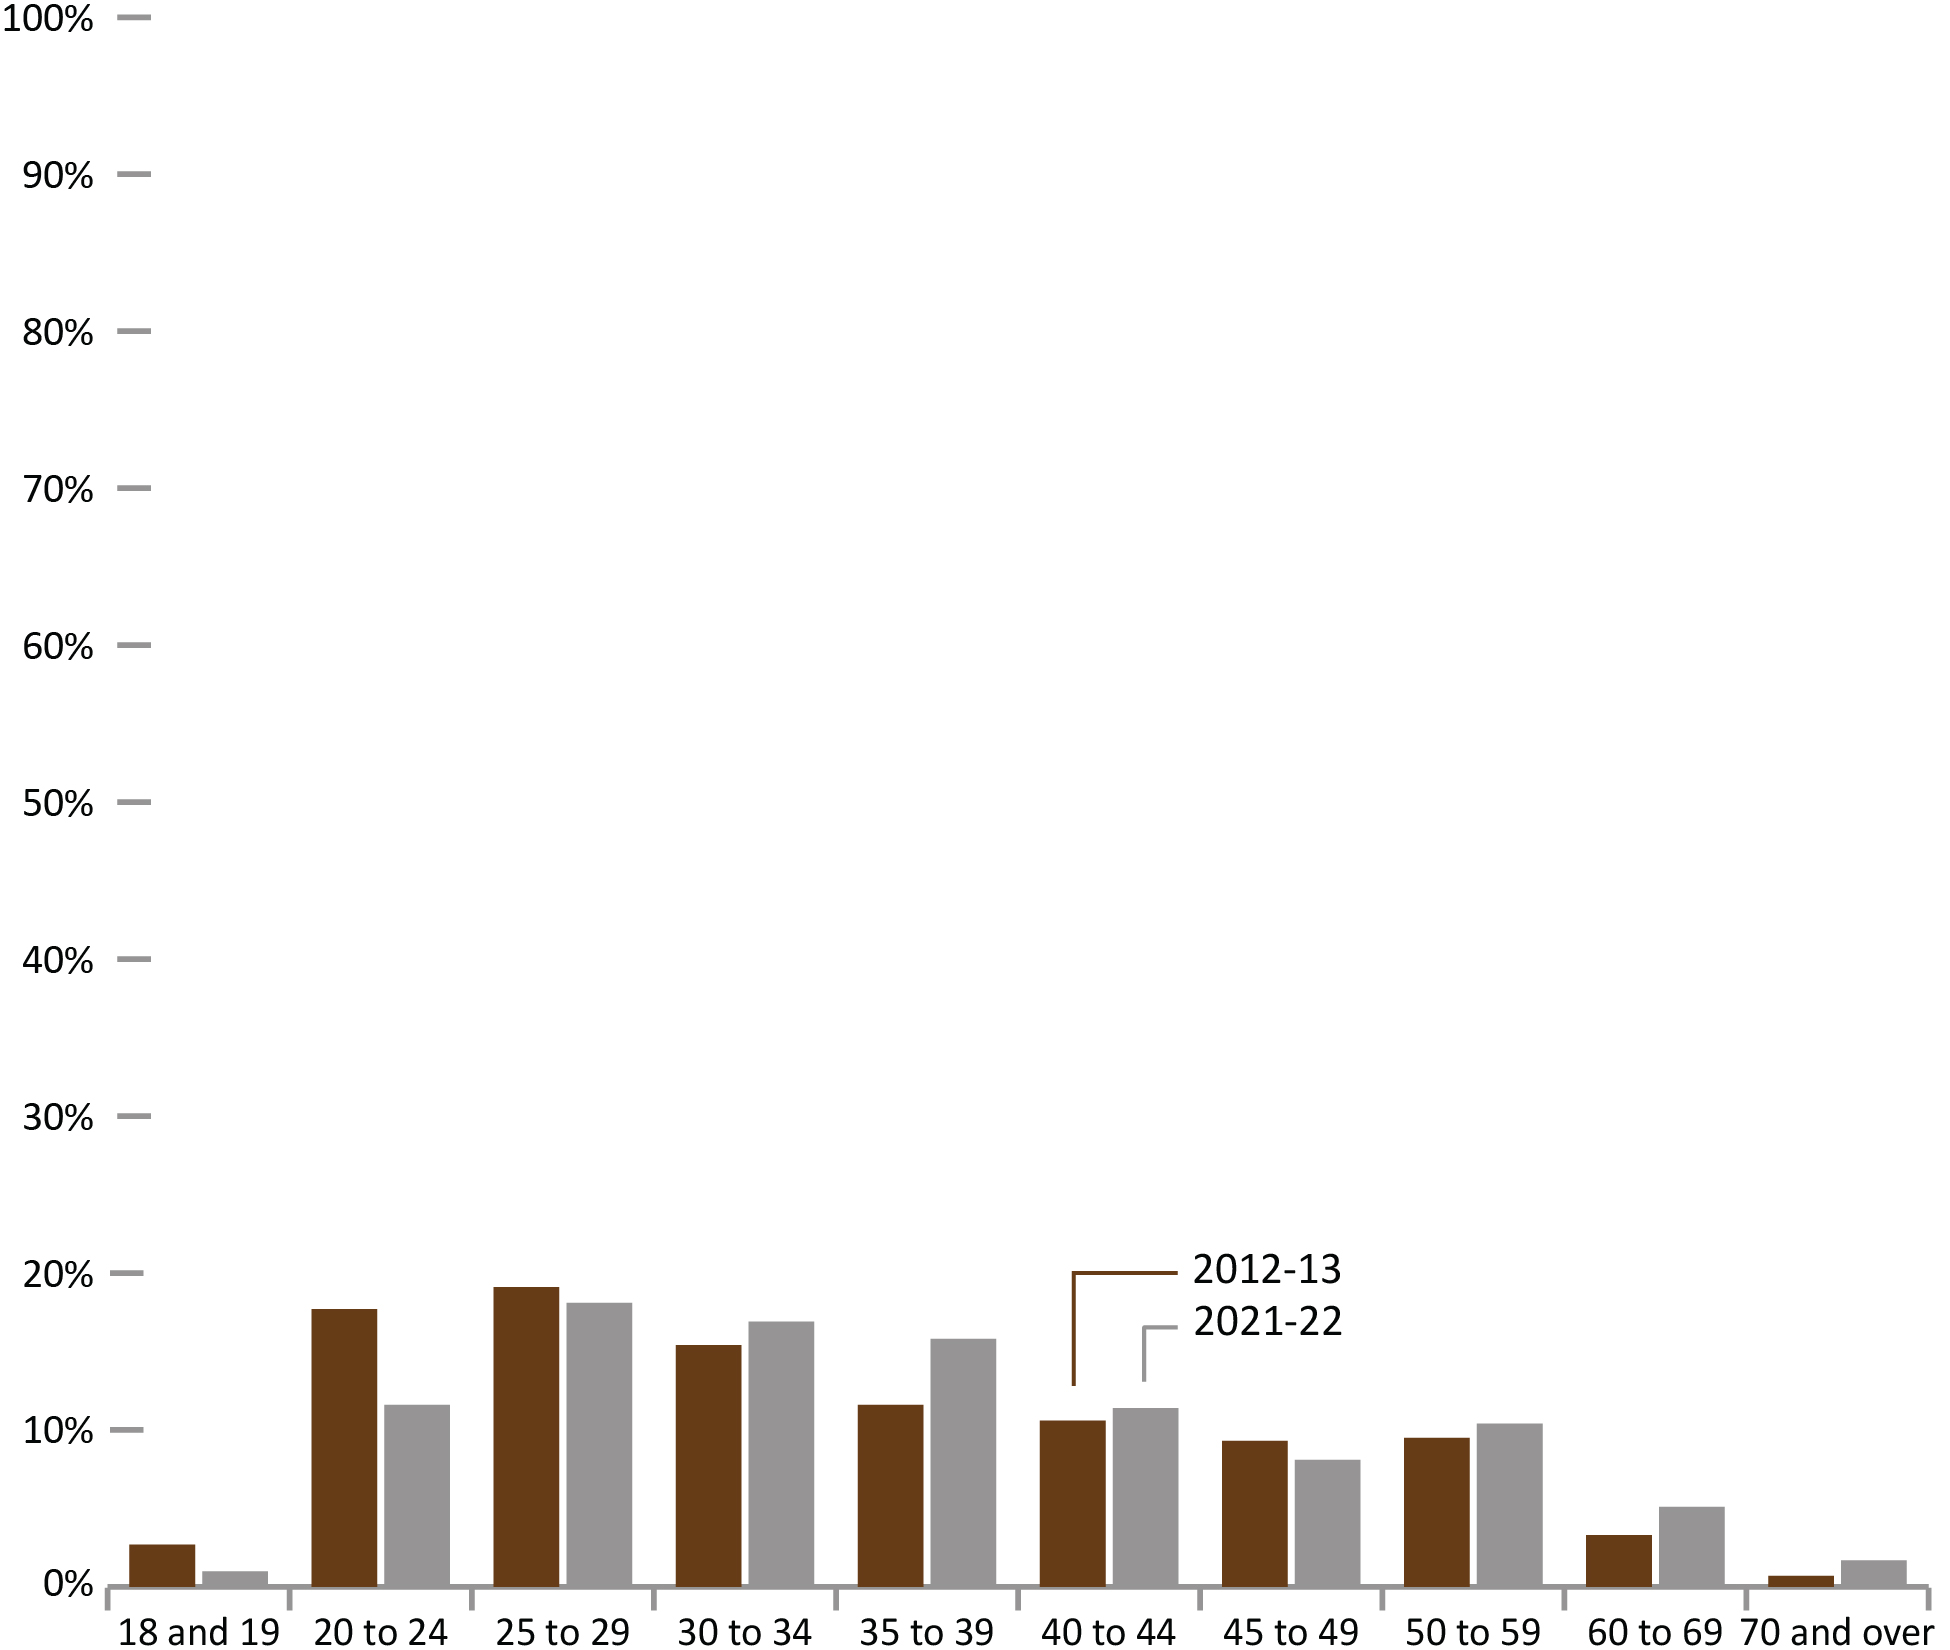
Image description
Bar graph showing the percentage of warrant committal admissions to a Correctional Services of Canada facility by age for fiscal year 2012 to 2013 and for fiscal year 2021 to 2022. Over time, the percentage of admissions decreased in the 18 and 19 age group; the 20 to 24 age group; and, the 45 to 49 age group. The percentage of admissions increased over time for all other age groups, including the 25 to 29 age group; the 30 to 34 age group; the 35 to 39 age group; the 40 to 44 age group; the 50 to 59 age group; the 60 to 69 age group; and the 70 plus age group. Full data are available immediately below.
Source: Correctional Service of Canada.
- In 2021-22, 29.6% of offenders admitted on a warrant of committal to CSC facilities were between the ages of 20 and 29, and 32.7% were between 30 and 39 years of age.
- In both 2021-22 and 2012-13, most warrant of committal admissions were among those ages 25 to 29.
- The median age of the population upon admission in 2021-22 was 35, compared to a median age of 33 in 2012-13.
- The number of offenders between the ages of 40 and 49 at admission decreased from 1,008 in 2012-13 to 756 in 2021-22, representing a 25.0% decrease.
- The number of offenders between the ages of 50 and 59 at admission decreased from 478 in 2012-13 to 404 in 2021-22, representing a 15.5% decrease.
Figure C9 Notes
A warrant of committal is a new admission to federal jurisdiction from the courts.
Although not illustrated in the figure, the distribution of age upon admission is similar for both males and females.
These numbers refer to the total number of admissions to a federal institution or Healing Lodge during each fiscal year and may be greater than the actual number of offenders admitted, since an individual offender may be admitted more than once in a given year.
There is a lag in the data entry of admissions into CSC’s Offender Management System. The admission figures for the most recent year are under-reported by 200-400 admissions at the time of year end data extraction. More accurate figures will be available in the next year’s publication. Please use caution when including the most recent year in any trend analysis.
Due to rounding, percentages may not add to 100 percent.
Reported year periods reflect fiscal years. A fiscal year runs from April 1 to March 31 of the following year.
| Age at admission | 2012-13 | 2021-22 | ||||||||||
|---|---|---|---|---|---|---|---|---|---|---|---|---|
| Females | Males | Total | Females | Males | Total | |||||||
| # | % | # | % | # | % | # | % | # | % | # | % | |
| 18 and 19 | 4 | 1.5 | 130 | 2.7 | 134 | 2.7 | 4 | 1.4 | 35 | 1.0 | 39 | 1.0 |
| 20 to 24 | 57 | 21.5 | 836 | 17.5 | 893 | 17.7 | 34 | 12.2 | 415 | 11.5 | 449 | 11.6 |
| 25 to 29 | 51 | 19.2 | 912 | 19.1 | 963 | 19.1 | 55 | 19.8 | 647 | 17.9 | 702 | 18.1 |
| 30 to 34 | 40 | 15.1 | 738 | 15.4 | 778 | 15.4 | 43 | 15.5 | 615 | 17.0 | 658 | 16.9 |
| 35 to 39 | 29 | 10.9 | 557 | 11.7 | 586 | 11.6 | 41 | 14.7 | 572 | 15.8 | 613 | 15.8 |
| 40 to 44 | 33 | 12.5 | 504 | 10.5 | 537 | 10.6 | 31 | 11.2 | 411 | 11.4 | 442 | 11.4 |
| 45 to 49 | 26 | 9.8 | 445 | 9.3 | 471 | 9.3 | 33 | 11.9 | 281 | 7.8 | 314 | 8.1 |
| 50 to 59 | 19 | 7.2 | 459 | 9.6 | 478 | 9.5 | 28 | 10.1 | 376 | 10.4 | 404 | 10.4 |
| 60 to 69 | 5 | 1.9 | 163 | 3.4 | 168 | 3.3 | 7 | 2.5 | 192 | 5.3 | 199 | 5.1 |
| 70 and over | 1 | 0.4 | 36 | 0.8 | 37 | 0.7 | 2 | 0.7 | 65 | 1.8 | 67 | 1.7 |
| Total | 265 | 4,780 | 5,045 | 278 | 3,609 | 3,887 | ||||||
Source: Correctional Service of Canada.
Table C9 Notes
A warrant of committal is a new admission to federal jurisdiction from the courts.
These numbers refer to the total number of admissions to a federal institution or Healing Lodge during each fiscal year and may be greater than the actual number of offenders admitted, since an individual offender may be admitted more than once in a given year.
There is a lag in the data entry of admissions into CSC’s Offender Management System. The admission figures for the most recent year are under-reported by 200-400 admissions at the time of year end data extraction. More accurate figures will be available in the next year’s publication. Please use caution when including the most recent year in any trend analysis.
Due to rounding, percentages may not add to 100 percent.
Reported year periods reflect fiscal years. A fiscal year runs from April 1 to March 31 of the following year.
Number of registered victims by age
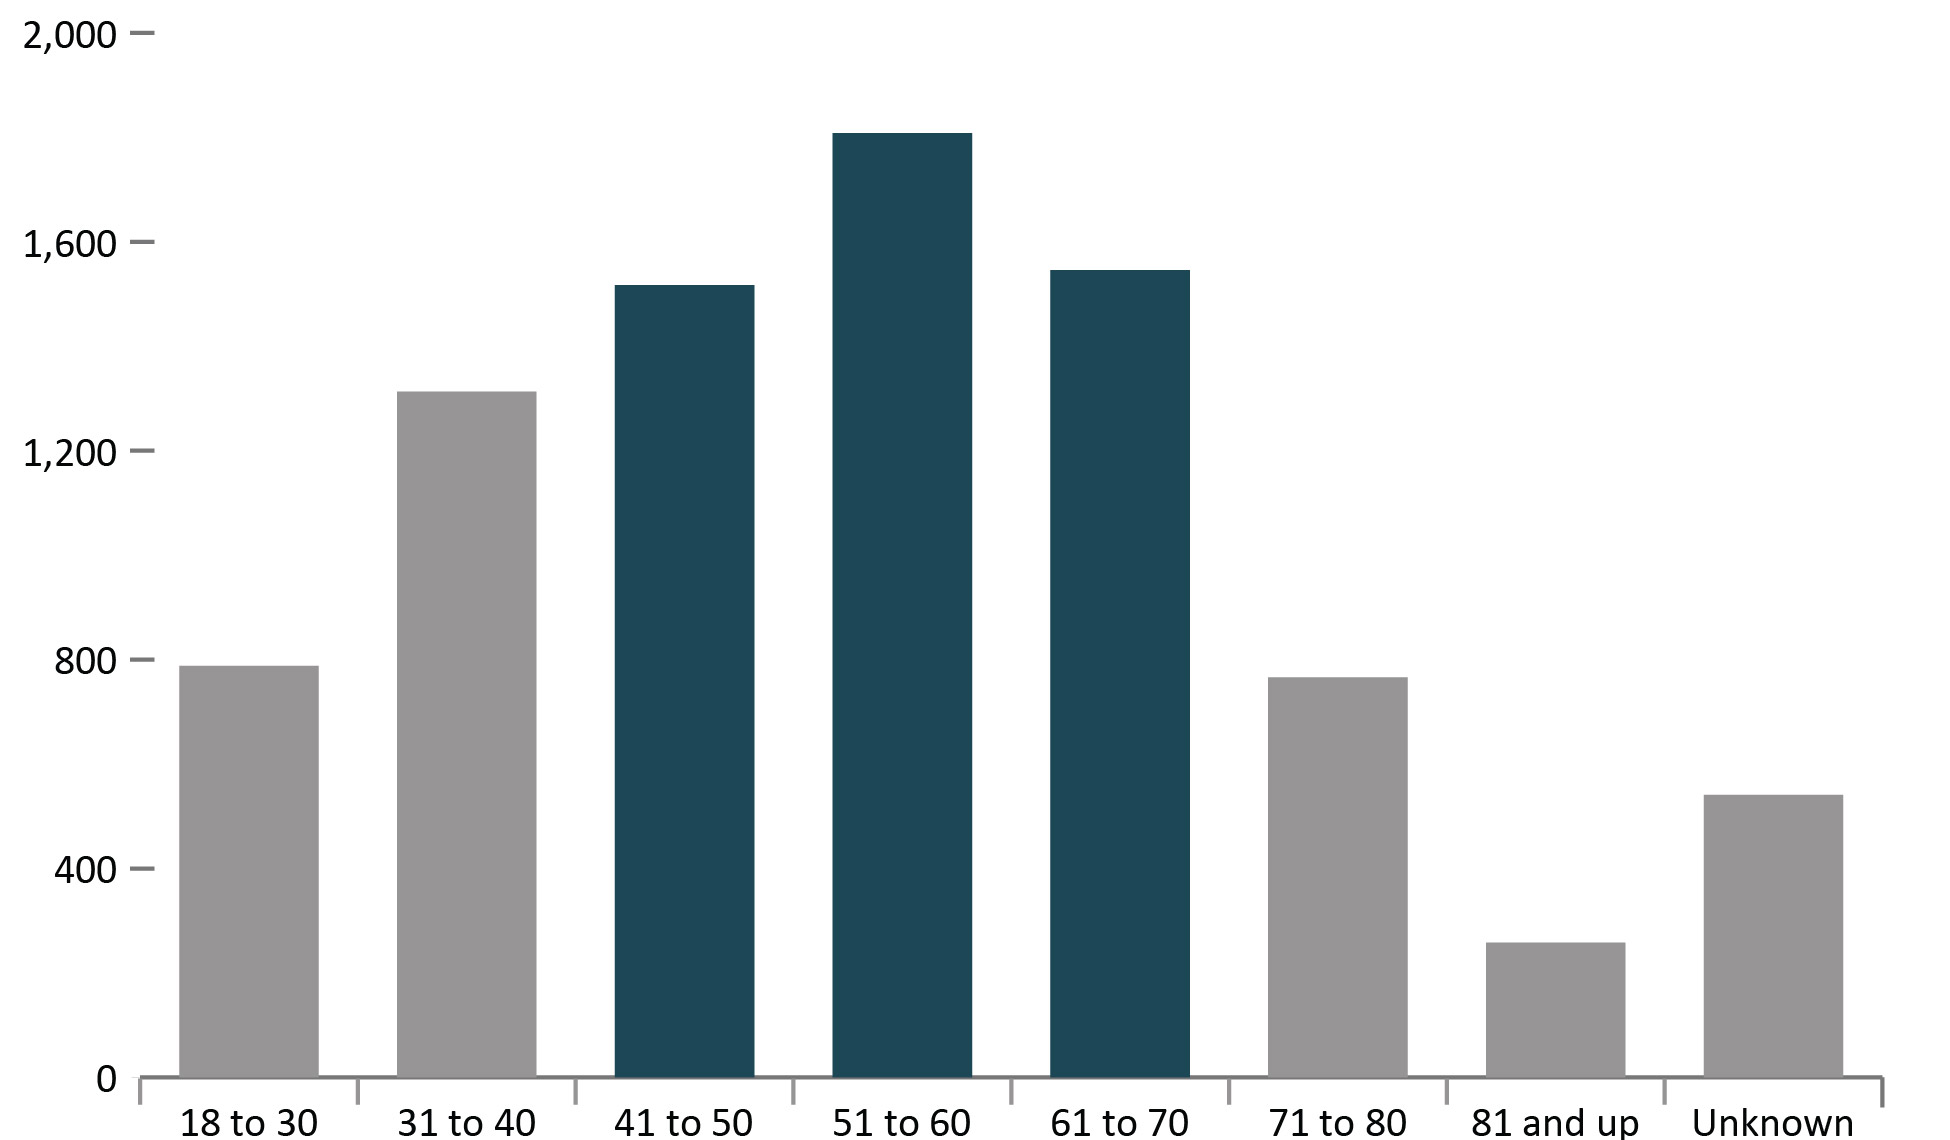
Image description
Bar graph showing the number of registered victims by age in fiscal year 2021 to 2022. There were 788 registered victims aged 30 and under, with the numbers rising by ascending decennial age grouping until reaching the highest number of registered victims in the 51 to 60 age group at 1,808 registered victims. The number of registered victims then decreased by ascending decade age group until reaching the age group with the fewest registered victims of 253 for those 81 years of age and older. Full data are available immediately below.
Source: Correctional Service of Canada.
- In 2021-22, 57.1% of registered victims were aged 41 to 70. The greatest proportion of victims was in the 51-60 age group (21.2%). This pattern has remained consistent over the past 5 years (from 2017-18 to 2021-22).
Figure C10 Notes
The Canadian Victims Bill of Rights defines a victim as any individual who has suffered physical or emotional harm, property damage, or economic loss as the result of the commission of an offence. The law also allows a spouse, a relative or dependant, an individual who is responsible for the care or support of the victim or the care or support of a dependant of the victim, to act on behalf of a victim, if the victim cannot act on their own behalf. Victims include persons harmed by the offender regardless of whether the offender has been prosecuted or not, as long as an official complaint has been made to the police or to the Crown.
Victims do not automatically receive information about the offender who harmed them. If they have been harmed by an offender serving a sentence of 2 years or more, victims must register with the Correctional Service of Canada (CSC) or the Parole Board of Canada to receive information or access services. Registration allows CSC to verify that the individual meets the definition of victim, which is required by law before sharing protected offender information. https://www.csc-scc.gc.ca/victims/003006-7001-en.shtml
Reporting rates ranged from 90.1% in 2017-18 to 93.7% in 2021-22. The difference between the total number of registered victims and the number of victims who reported their age is the result of victims choosing not to report their age during registration, or their age is unknown to CSC. The information does not represent victims who have not been in contact with CSC or those who choose not to register.
Note that all registered victims are 18 years of age or older except for exceptional circumstances (i.e. emancipations).
Reported year periods reflect fiscal years. A fiscal year runs from April 1 to March 31 of the following year.
| 2017-18 | 2018-19 | 2019-20 | 2020-21 | 2021-22 | ||||||
|---|---|---|---|---|---|---|---|---|---|---|
| # | % | # | % | # | % | # | % | # | % | |
| 30 and under | 818 | 10.2 | 890 | 10.5 | 957 | 10.8 | 881 | 10.1 | 788 | 9.2 |
| 31 to 40 | 1,158 | 14.4 | 1,225 | 14.5 | 1,274 | 14.4 | 1,288 | 14.8 | 1,313 | 15.4 |
| 41 to 50 | 1,430 | 17.8 | 1,521 | 17.9 | 1,598 | 18.0 | 1,585 | 18.2 | 1,517 | 17.8 |
| 51 to 60 | 1,844 | 22.9 | 1,882 | 22.2 | 1,928 | 21.8 | 1,852 | 21.3 | 1,808 | 21.2 |
| 61 to 70 | 1,213 | 15.1 | 1,373 | 16.2 | 1,455 | 16.4 | 1,504 | 17.3 | 1,546 | 18.1 |
| 71 to 80 | 595 | 7.4 | 651 | 7.7 | 715 | 8.1 | 748 | 8.6 | 766 | 9.0 |
| 81 and older | 188 | 2.3 | 214 | 2.5 | 246 | 2.8 | 252 | 2.9 | 258 | 3.0 |
| Unknown | 795 | 9.9 | 721 | 8.5 | 684 | 7.7 | 585 | 6.7 | 541 | 6.3 |
| Total | 8,041 | 100.0 | 8,477 | 100.00 | 8,857 | 100.0 | 8,695 | 100.0 | 8,537 | 100.0 |
Source: Correctional Service of Canada.
Table C10 Notes
The Canadian Victims Bill of Rights defines a victim as any individual who has suffered physical or emotional harm, property damage, or economic loss as the result of the commission of an offence. The law also allows a spouse, a relative or dependant, an individual who is responsible for the care or support of the victim or the care or support of a dependant of the victim, to act on behalf of a victim, if the victim cannot act on their own behalf. Victims include persons harmed by the offender regardless of whether the offender has been prosecuted or not, as long as an official complaint has been made to the police or to the Crown.
Victims do not automatically receive information about the offender who harmed them. If they have been harmed by an offender serving a sentence of 2 years or more, victims must register with the Correctional Service of Canada (CSC) or the Parole Board of Canada to receive information or access services. Registration allows CSC to verify that the individual meets the definition of victim, which is required by law before sharing protected offender information. https://www.csc-scc.gc.ca/victims/003006-7001-en.shtml
Reporting rates ranged from 90.1% in 2017-18 to 93.7% in 2021-22. The difference between the total number of registered victims and the number of victims who reported their age is the result of victims choosing not to report their age during registration, or their age is unknown to CSC. The information does not represent victims who have not been in contact with CSC or those who choose not to register.
Note that all registered victims are 18 years of age or older except for exceptional circumstances (i.e. emancipations).
Reported data is current up to the end of each fiscal year. A fiscal year runs from April 1 to March 31 of the following year.
Warrant of committal admissions to a CSC facility for Indigenous and non-Indigenous offenders by age
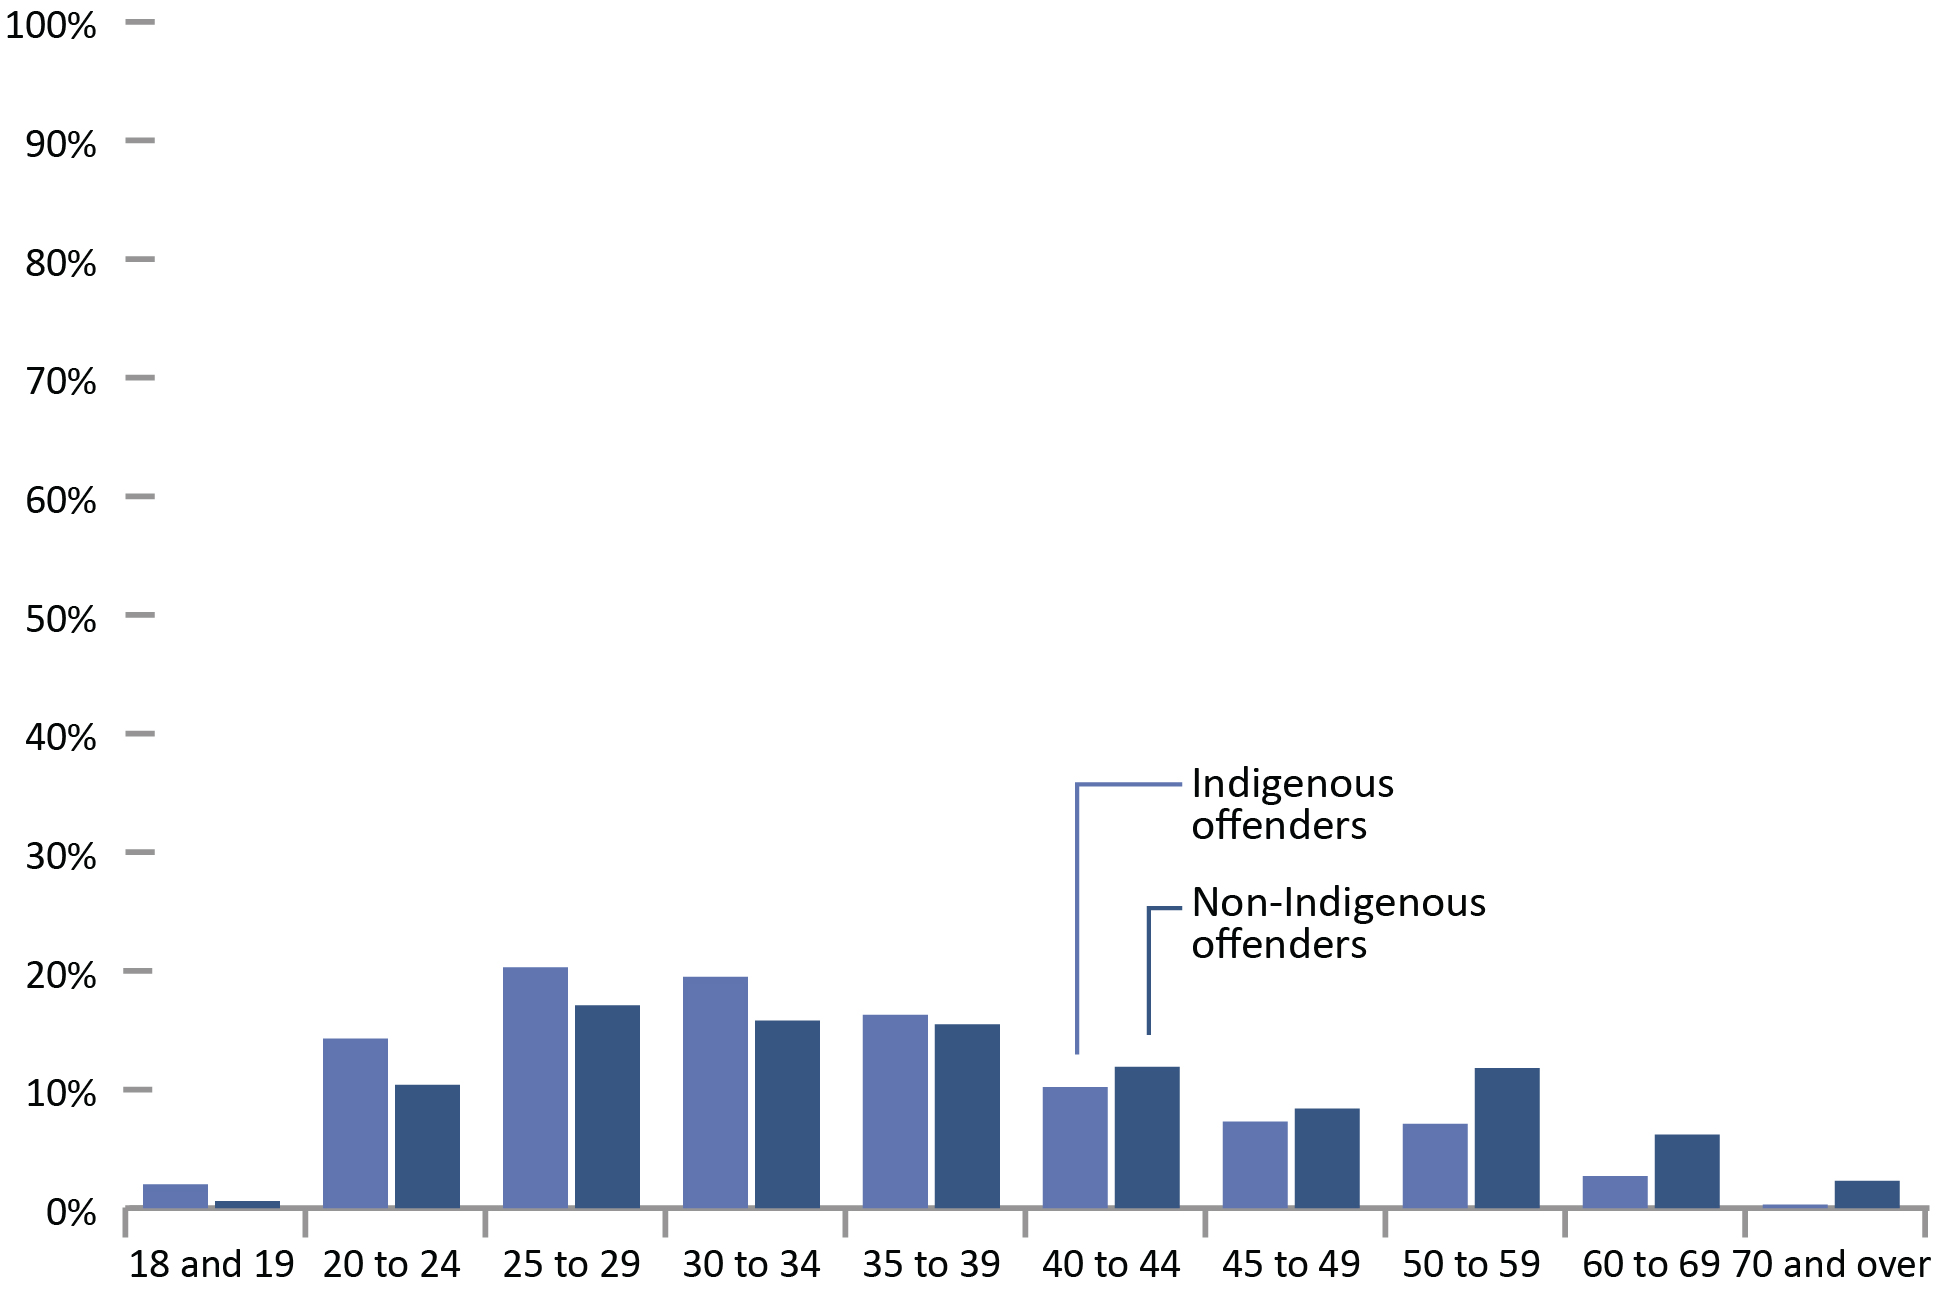
Image description
Bar graph showing the percentage of warrant committal admissions to a Correctional Services of Canada facility by age for Indigenous and non-Indigenous offenders in the 2021 to 2022 fiscal year. There was a higher percentage of Indigenous offenders in the 18 and 19 age group; the 20 to 24 age group; the 25 to 29 age group; the 30 to 34 age group.; and the 35 to 39 age group. There was a higher percentage of non-Indigenous offenders for the 40 to 44 age group; the 45 to 49 age group; the 50 to 59 age group; the 60 to 69 age group; and the 70 plus age group. Full data are available immediately below.
Source: Correctional Service of Canada.
- Of those offenders admitted on a warrant of committal to CSC facilities in 2021-22, 36.6% of Indigenous offenders were under the age of 30, compared to 28.1% of non-Indigenous offenders.
- The median age of Indigenous offenders at admission was 33, compared to a median age of 36 for non-Indigenous offenders.
- The median age of Indigenous female offenders at admission was 33, compared to a median age of 38 for non-Indigenous female offenders.
Figure C11 Notes
A warrant of committal is a new admission to federal jurisdiction from the courts.
These numbers refer to the total number of admissions to a federal institution or Healing Lodge during each fiscal year and may be greater than the actual number of offenders admitted, since an individual offender may be admitted more than once in a given year.
There is a lag in the data entry of admissions into CSC’s Offender Management System. The admission figures for the most recent year are under-reported by 200-400 admissions at the time of year end data extraction. More accurate figures will be available in the next year’s publication. Please use caution when including the most recent year in any trend analysis.
Due to rounding, percentages may not add to 100 percent.
Reported year periods reflect fiscal years. A fiscal year runs from April 1 to March 31 of the following year.
| Age at admission | 2012-13 | 2021-22 | ||||||||||
|---|---|---|---|---|---|---|---|---|---|---|---|---|
| Indigenous | Non- Indigenous | Total | Indigenous | Non- Indigenous | Total | |||||||
| # | % | # | % | # | % | # | % | # | % | # | % | |
| 18 and 19 | 46 | 3.8 | 88 | 2.3 | 134 | 2.7 | 23 | 2.0 | 16 | 0.6 | 39 | 1.0 |
| 20 to 24 | 244 | 20.4 | 649 | 16.9 | 893 | 17.7 | 167 | 14.3 | 282 | 10.4 | 449 | 11.6 |
| 25 to 29 | 265 | 22.2 | 698 | 18.1 | 963 | 19.1 | 236 | 20.3 | 466 | 17.1 | 702 | 18.1 |
| 30 to 34 | 189 | 15.8 | 589 | 15.3 | 778 | 15.4 | 227 | 19.5 | 431 | 15.8 | 658 | 16.9 |
| 35 to 39 | 141 | 11.8 | 445 | 11.6 | 586 | 11.6 | 190 | 16.3 | 423 | 15.5 | 613 | 15.8 |
| 40 to 44 | 123 | 10.3 | 414 | 10.8 | 537 | 10.6 | 119 | 10.2 | 323 | 11.9 | 442 | 11.4 |
| 45 to 49 | 102 | 8.5 | 369 | 9.6 | 471 | 9.3 | 85 | 7.3 | 229 | 8.4 | 314 | 8.1 |
| 50 to 59 | 63 | 5.3 | 415 | 10.8 | 478 | 9.5 | 83 | 7.1 | 321 | 11.8 | 404 | 10.4 |
| 60 to 69 | 22 | 1.8 | 146 | 3.8 | 168 | 3.3 | 31 | 2.7 | 168 | 6.2 | 199 | 5.1 |
| 70 and over | 0 | 0.0 | 37 | 1.0 | 37 | 0.7 | 4 | 0.3 | 63 | 2.3 | 67 | 1.7 |
| Total | 1,195 | 3,850 | 5,045 | 1,165 | 2,722 | 3,887 | ||||||
Source: Correctional Service of Canada.
Table C11 Notes
A warrant of committal is a new admission to federal jurisdiction from the courts.
These numbers refer to the total number of admissions to a federal institution or Healing Lodge during each fiscal year and may be greater than the actual number of offenders admitted, since an individual offender may be admitted more than once in a given year.
There is a lag in the data entry of admissions into CSC’s Offender Management System. The admission figures for the most recent year are under-reported by 200-400 admissions at the time of year end data extraction. More accurate figures will be available in the next year’s publication. Please use caution when including the most recent year in any trend analysis.
Due to rounding, percentages may not add to 100 percent.
Reported year periods reflect fiscal years. A fiscal year runs from April 1 to March 31 of the following year.
Age distribution of the CSC offender population compared to the age distribution of the overall Canadian adult population
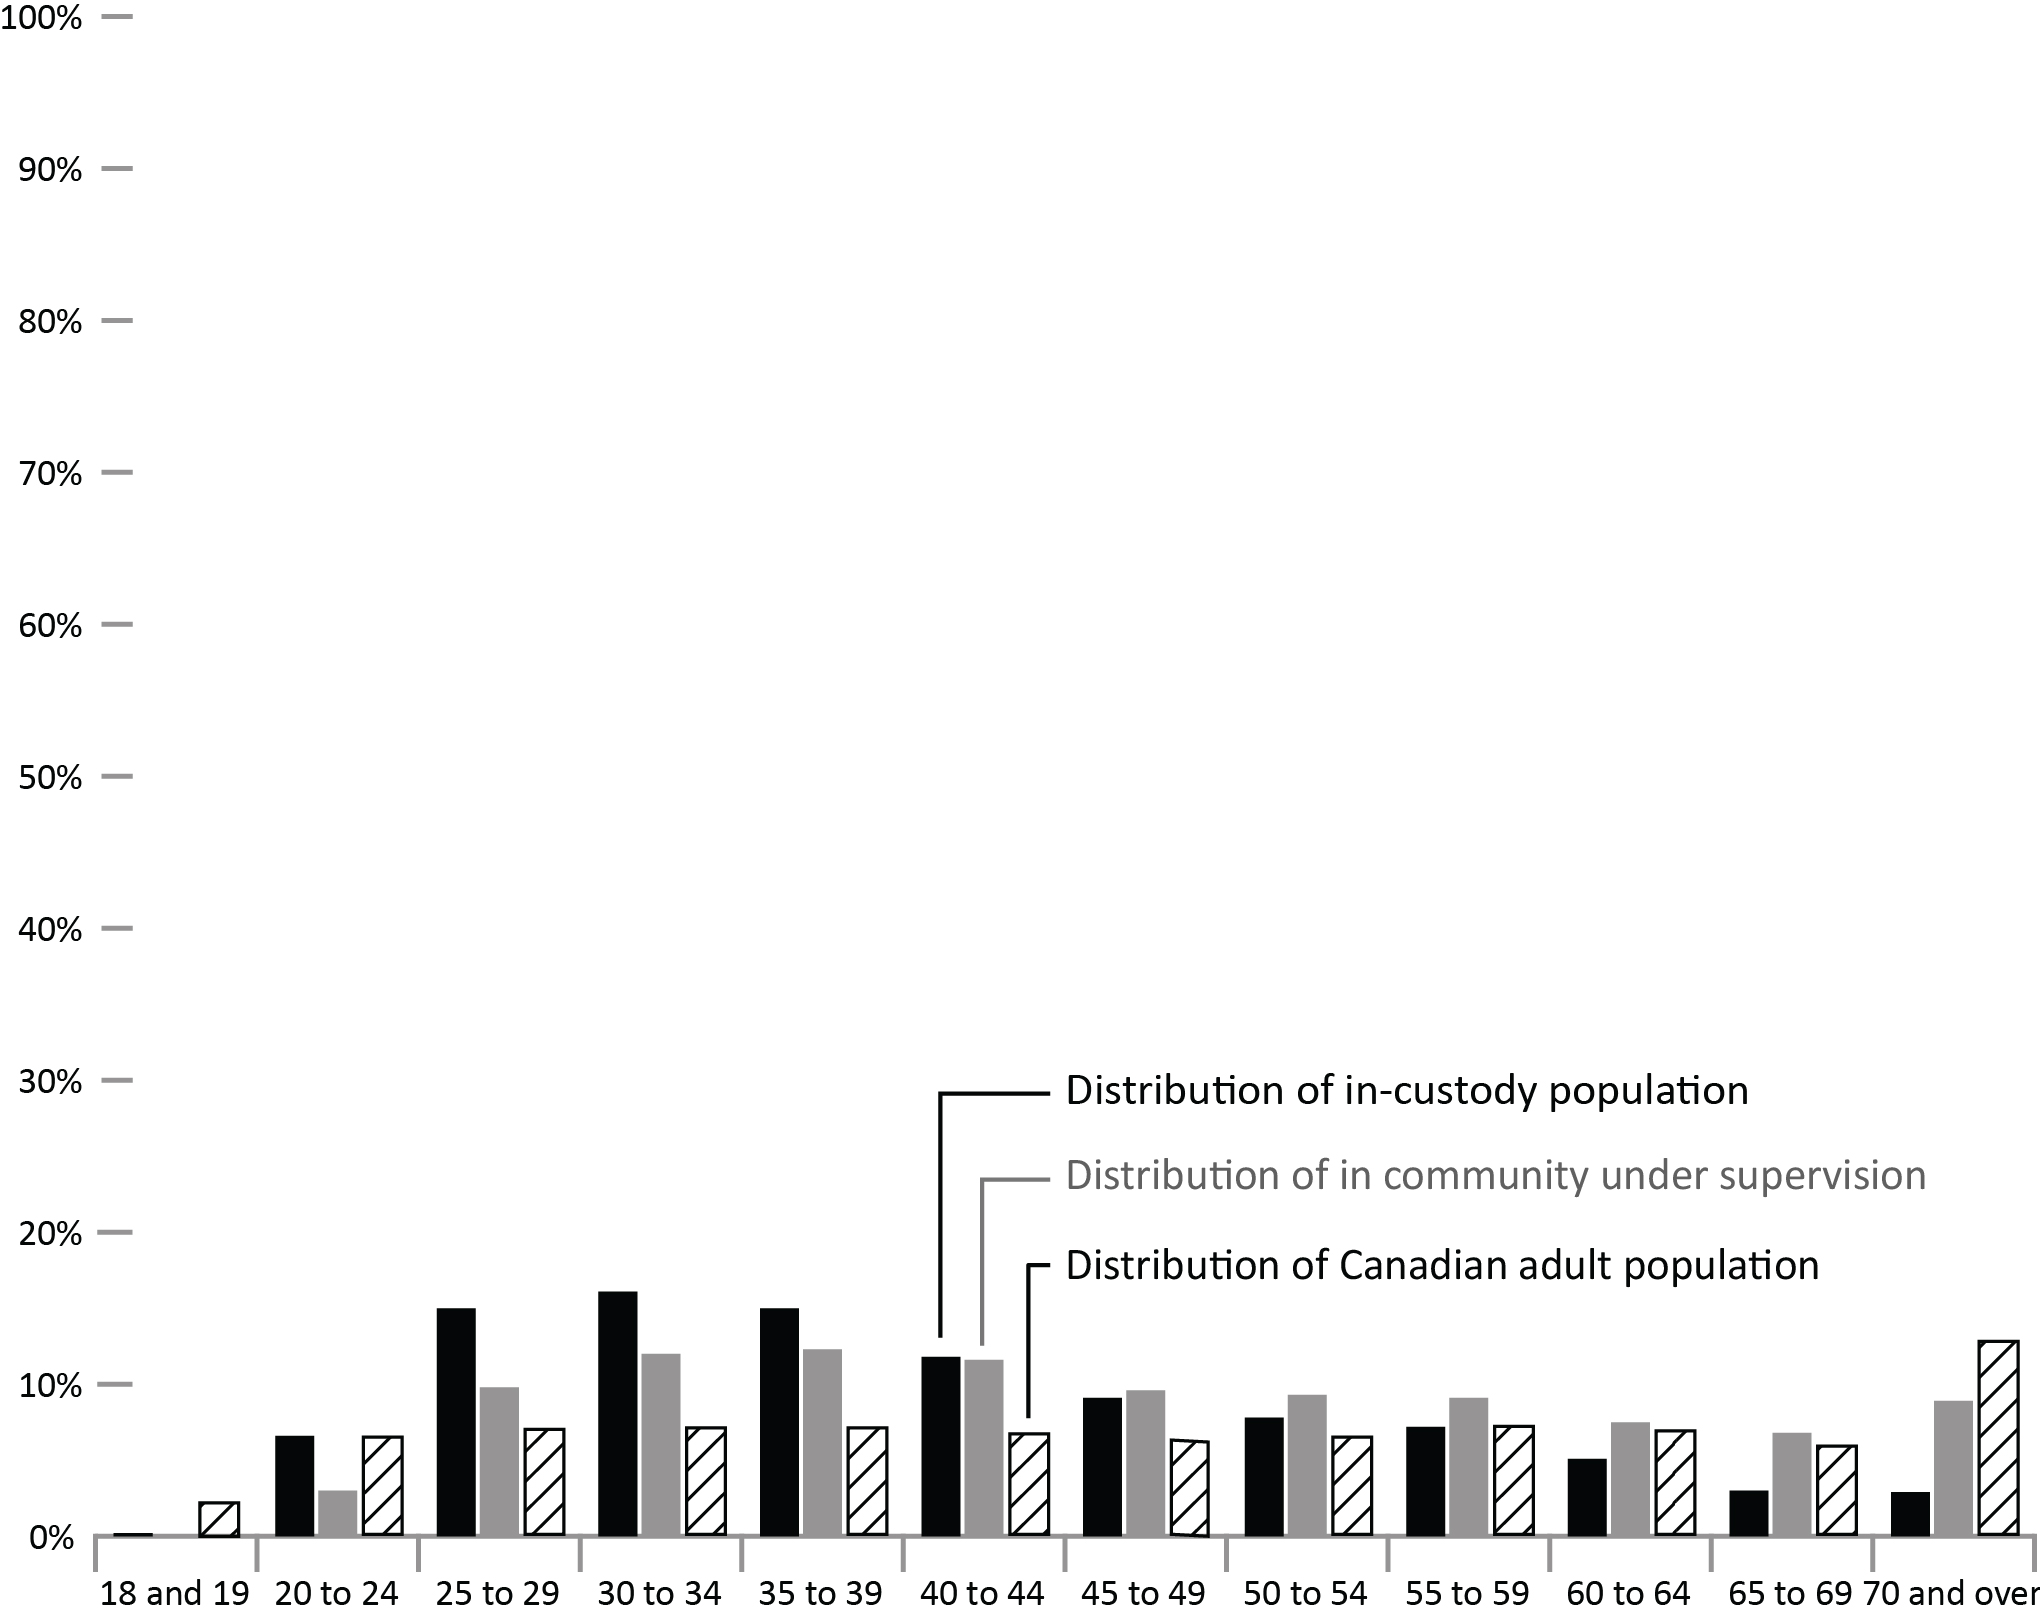
Image description
Bar graph comparing the percentage of the in-custody offender population of fiscal year 2021 to 2022 with the Canadian adult population of the year 2021 by age group. The age group representing the most likely people to be in-custody during the 2021 to 2022 fiscal year are 30 to 34 year olds, an age group that represents about 8 percent of the Canadian population. This is the age grouping that is most over-represented in the in-custody population. The proportion of the in-custody population falls for each age group until reaching a low of about three percent of in-custody population being 70 years old or older. Because there are more Canadians who are 55 to 64 years of age than between ages 40 to 54, overrepresentation by age declines even more rapidly than the proportion in-custody. The proportion of people under community supervision rises quickly from under 6.6 percent for 20 to 24 year olds to a high of about 15 percent amongst 35 to 39 year olds, declining unevenly until a plateau of just under 10 percent of those aged 45 to 59 being under supervision orders in the community. Full data are available immediately below.
Sources: Correctional Service of Canada; Table 17-10-0005-01, Annual Demographic Estimates: Canada, Provinces, and Territories, Centre for Demography, Statistics Canada.
- In 2021-22, 53.0% of in-custody offenders were under the age of 40, compared with 48.5% of the Canadian adult population in the same age range.
- In 2021-22, 26.1% of the in-custody offender population was aged 50 and over, compared with 38.8% of the Canadian adult population in the same age range.
- The community offender population was older than the in-custody population; 41.6% of offenders in the community were aged 50 and over, compared to 26.1% of the in-custody offenders in this age group.
- As of 2021-22, 0.04% of the Canadian adult population are in-custody offenders, and 0.03% of the Canadian adult population are offenders in the community under supervision. Taken together, the total offender population represents 0.07% of the Canadian adult population.
Figure C12 Notes
In-custody population includes all active offenders incarcerated in a CSC facility, offenders on temporary absence from a CSC facility, offenders who are temporarily detained in a CSC facility and offenders on remand in a CSC facility.
In Community Under Supervision includes all active offenders on day parole, full parole, statutory release, or in the community supervised on a long-term supervision order, offenders who are temporarily detained in a non-CSC facility, offenders who are unlawfully at large for less than 90 days, offenders on remand in a non-CSC facility, and offenders supervised and subject to an immigration hold by Canada Border Services Agency.
Due to rounding, percentage may not add to 100 percent.
For offender population data, the reported year period (2021-22) reflects a fiscal year. A fiscal year runs from April 1 to March 31 of the following year.
| Age | In custody | In community under supervision | Total | % of Canadian adult population | |||
|---|---|---|---|---|---|---|---|
| # | % | # | % | # | % | % | |
| 18 and 19 | 26 | 0.2 | 0 | 0.0 | 26 | 0.1 | 2.2 |
| 20 to 24 | 819 | 6.6 | 258 | 3.0 | 1,077 | 5.2 | 6.4 |
| 25 to 29 | 1,847 | 15.0 | 833 | 9.8 | 2,680 | 12.9 | 6.9 |
| 30 to 34 | 1,985 | 16.1 | 1,018 | 12.0 | 3,003 | 14.4 | 7.0 |
| 35 to 39 | 1,855 | 15.0 | 1,047 | 12.3 | 2,902 | 13.9 | 7.0 |
| 40 to 44 | 1,451 | 11.8 | 980 | 11.6 | 2,431 | 11.7 | 6.6 |
| 45 to 49 | 1,128 | 9.1 | 818 | 9.6 | 1,946 | 9.4 | 6.2 |
| 50 to 54 | 964 | 7.8 | 790 | 9.3 | 1,754 | 8.4 | 6.4 |
| 55 to 59 | 892 | 7.2 | 769 | 9.1 | 1,661 | 8.0 | 7.1 |
| 60 to 64 | 625 | 5.1 | 639 | 7.5 | 1,264 | 6.1 | 6.8 |
| 65 to 69 | 376 | 3.0 | 574 | 6.8 | 950 | 4.6 | 5.8 |
| 70 and over | 360 | 2.9 | 753 | 8.9 | 1,113 | 5.3 | 12.7 |
| Total | 12,328 | 100.0 | 8,479 | 100.0 | 20,807 | 100.0 | 100.0 |
Sources: Correctional Service of Canada; Table 17-10-0005-01, Annual Demographic Estimates: Canada, Provinces, and Territories, Centre for Demography, Statistics Canada.
Table C12 Notes
In-custody population includes all active offenders incarcerated in a CSC facility, offenders on temporary absence from a CSC facility, offenders who are temporarily detained in a CSC facility and offenders on remand in a CSC facility.
In Community Under Supervision includes all active offenders on day parole, full parole, statutory release, or in the community supervised on a long-term supervision order, offenders who are temporarily detained in a non-CSC facility, offenders who are unlawfully at large for less than 90 days, offenders on remand in a non-CSC facility, and offenders supervised and subject to an immigration hold by Canada Border Services Agency.
Due to rounding, percentage may not add to 100 percent.
For offender population data, the reported year period (2021-22) reflects a fiscal year. A fiscal year runs from April 1 to March 31 of the following year.
CSC offender population by self-reported race
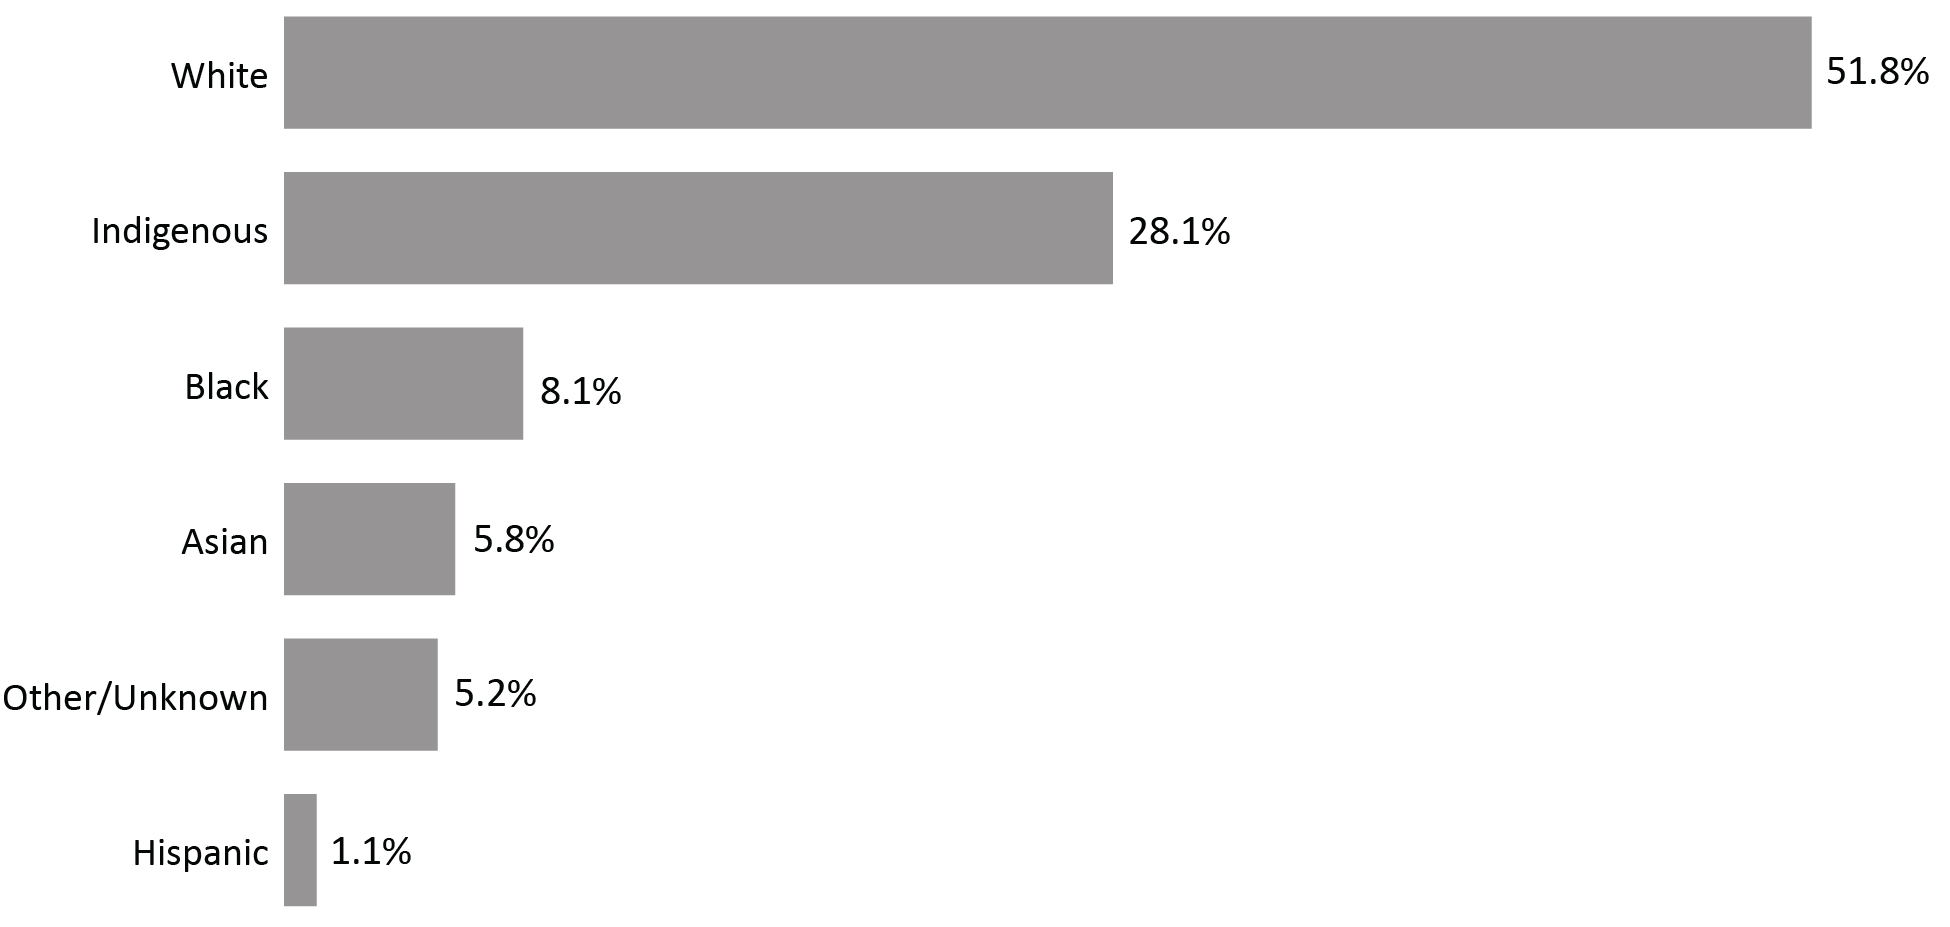
Image description
Bar graph showing the percentage of total Correctional Service of Canada offender population by self-reported race for the fiscal year 2021 to 2022. White-identifying offenders accounted for 51.8 percent of the offender population; followed by Indigenous-identifying offenders which accounted for 28.1 percent; Black offenders which account for 8.1 percent; Asian offenders which account for 5.8 percent; other/unknown offenders which account for 5.2 percent; and Hispanic offenders which account for 1.1 percent. Full data are available immediately below.
Source: Correctional Service of Canada.
- The CSC offender population is becoming more diverse, as evidenced by the decrease in the proportion of White offenders (from 56.3% in 2017-18 to 51.8% in 2021-22). Between 2017-18 and 2021-22, the Indigenous population increased by 4.8% (from 5,572 to 5,840).
- Indigenous offenders represented 28.1% of the 2021-22 total CSC offender population and 30.0% of 2021-22 warrant of committal admissions to CSC facilities.
| 2017-18 | 2021-22 | |||
|---|---|---|---|---|
| # | % | # | % | |
| White | 13,072 | 56.3 | 10,772 | 51.8 |
| Indigenous | 5,572 | 24.0 | 5,840 | 28.1 |
First Nations |
3,750 | 16.1 | 4,002 | 19.2 |
Métis |
1,619 | 7.0 | 1,661 | 8.0 |
Inuit |
203 | 0.9 | 177 | 0.9 |
| Black | 1,700 | 7.3 | 1,679 | 8.1 |
| Asian | 1,268 | 5.5 | 1,210 | 5.8 |
Asiatic |
377 | 1.6 | 371 | 1.8 |
Arab |
189 | 0.8 | 188 | 0.9 |
Arab/West Asian |
171 | 0.7 | 151 | 0.7 |
Southeast Asian |
196 | 0.8 | 166 | 0.8 |
South Asian |
126 | 0.5 | 144 | 0.7 |
Chinese |
97 | 0.4 | 91 | 0.4 |
Filipino |
75 | 0.3 | 72 | 0.3 |
East Indian |
13 | 0.1 | 13 | 0.1 |
Korean |
16 | 0.1 | 9 | 0.0 |
Japanese |
8 | 0.0 | 5 | 0.0 |
| Hispanic | 245 | 1.1 | 220 | 1.1 |
Latin American |
238 | 1.0 | 216 | 1.0 |
Hispanic |
7 | 0.0 | 4 | 0.0 |
| Other/Unknown | 1,366 | 5.9 | 1,086 | 5.2 |
| Total | 23,223 | 100.0 | 20,807 | 100.0 |
Source: Correctional Service of Canada.
Number of registered victims by race
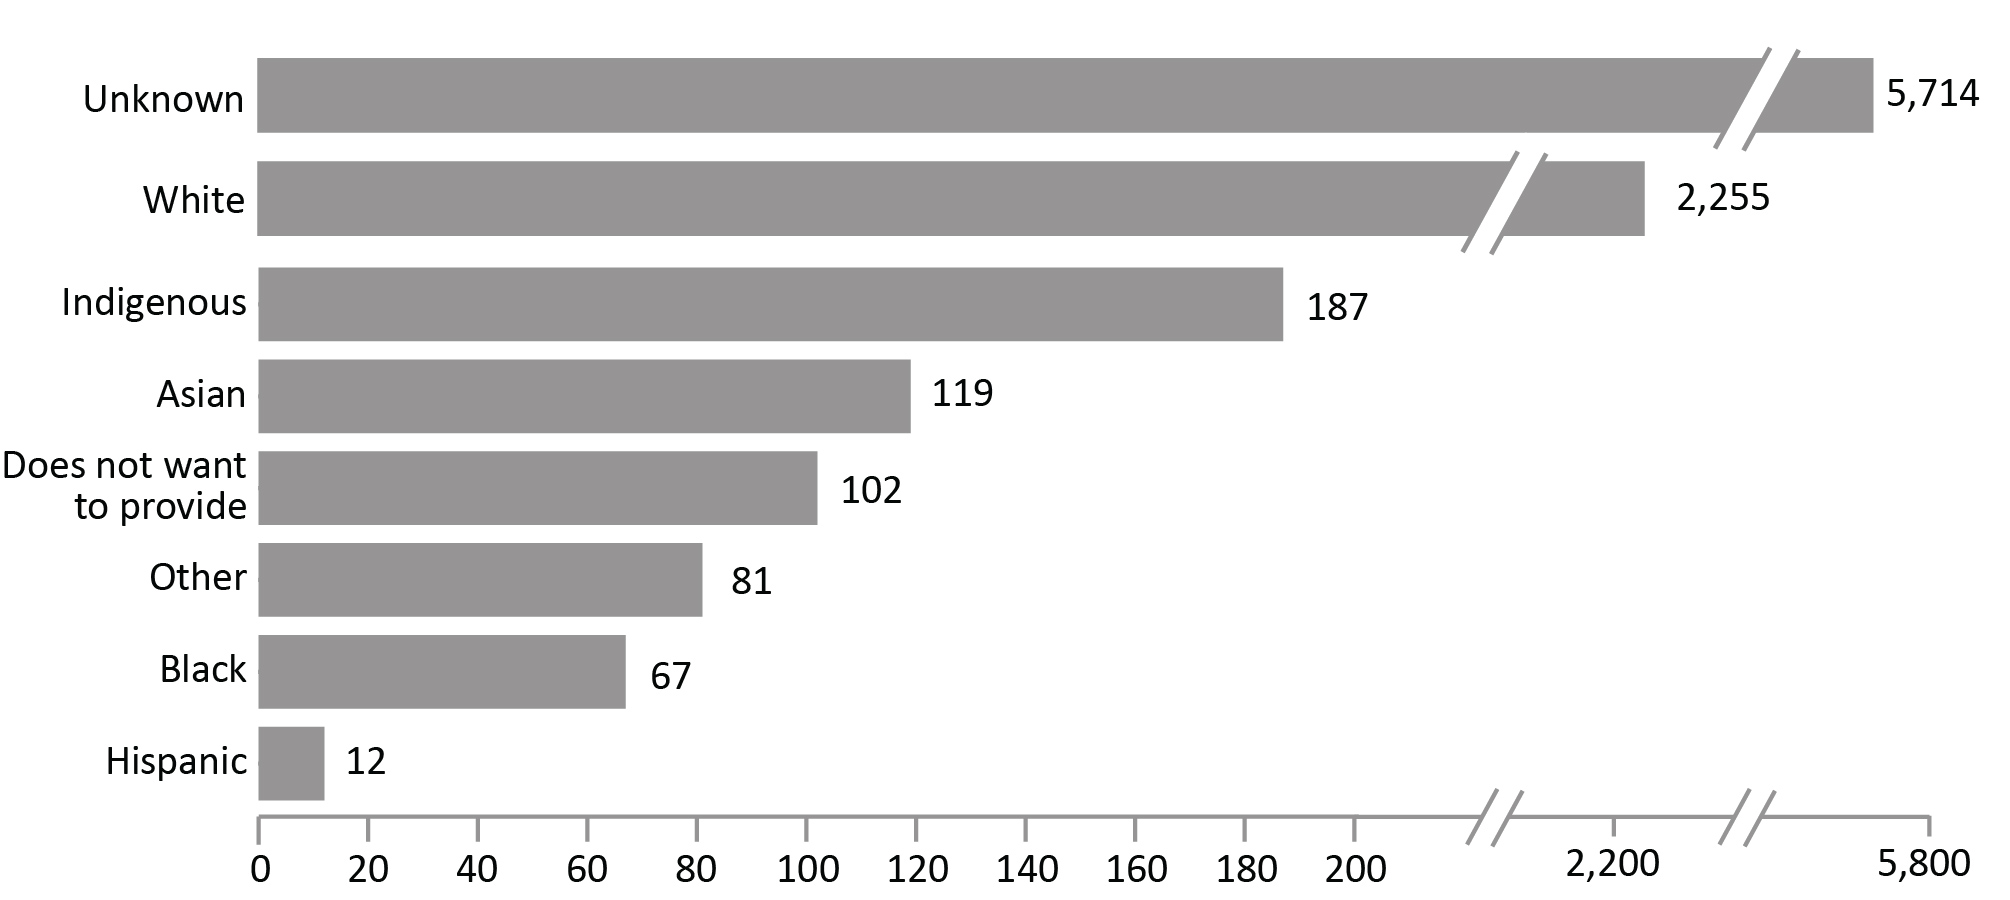
Image description
Bar graph showing the number of registered victims by race in fiscal year 2021 to 2022. There were 5,714 registered victims of unknown race; 2,255 White registered victims; 187 Indigenous registered victims; 119 Asian registered victims; 102 registered victims that did no want to provide race information; 81 registered victims of other, unlisted race(s); 67 Black registered victims; and 12 Hispanic registered victims. Full data are available immediately below.
Source: Correctional Service of Canada.
- Most registered victims (66.9%) were of unknown race. More than a quarter of registered victims (26.4%) identified as White.
Figure C14 Notes
The Canadian Victims Bill of Rights defines a victim as any individual who has suffered physical or emotional harm, property damage, or economic loss as the result of the commission of an offence. The law also allows a spouse, a relative or dependant, an individual who is responsible for the care or support of the victim or the care or support of a dependant of the victim, to act on behalf of a victim, if the victim cannot act on their own behalf. Victims include persons harmed by the offender regardless of whether the offender has been prosecuted or not, as long as an official complaint has been made to the police or to the Crown.
Victims do not automatically receive information about the offender who harmed them. If they have been harmed by an offender serving a sentence of 2 years or more, victims must register with the Correctional Service of Canada (CSC) or the Parole Board of Canada to receive information or access services. Registration allows CSC to verify that the individual meets the definition of victim, which is required by law before sharing protected offender information. https://www.csc-scc.gc.ca/victims/003006-7001-en.shtml
Demographic information is voluntarily self-reported by victims who have registered with CSC to receive information about the offender who harmed them. The information does not represent victims who have not been in contact with CSC or those who choose not to register.
The difference between the total number of registered victims and the number of victims who voluntarily self-reported their race is the result of victims choosing not to report their race or their race is unknown to CSC. The response rate for victim race has remained stable for the past three fiscal years.
The total number of victims for whom CSC has reported race data for 2021-22 is 2,823 whereby it is 5,714 for unknown, which means CSC has self-reported race data for less than a third of registered victims. Therefore, these statistics do not represent the entirety of registered victims.
Reported year periods reflect fiscal years. A fiscal year runs from April 1 to March 31 of the following year.
| 2017-18 | 2018-19 | 2019-20 | 2020-21 | 2021-22 | ||||||
|---|---|---|---|---|---|---|---|---|---|---|
| # | % | # | % | # | % | # | % | # | % | |
| White | 2,721 | 33.8 | 2,487 | 29.3 | 2,382 | 26.9 | 2,241 | 25.8 | 2,255 | 26.4 |
| Indigenous | 191 | 2.4 | 182 | 2.1 | 181 | 2.0 | 180 | 2.1 | 187 | 2.2 |
First Nations |
134 | 1.7 | 128 | 1.5 | 122 | 1.4 | 115 | 1.3 | 118 | 1.4 |
Métis |
31 | 0.4 | 30 | 0.4 | 34 | 0.4 | 38 | 0.4 | 43 | 0.5 |
Inuit |
26 | 0.3 | 24 | 0.3 | 25 | 0.3 | 27 | 0.3 | 26 | 0.3 |
| Black | 77 | 1.0 | 75 | 0.9 | 77 | 0.9 | 72 | 0.8 | 67 | 0.8 |
| Asian | 129 | 1.6 | 109 | 1.3 | 107 | 1.2 | 110 | 1.3 | 119 | 1.4 |
Arab/West Asian |
16 | 0.2 | 16 | 0.2 | 14 | 0.2 | 13 | 0.1 | 14 | 0.2 |
East/Southeast Asian |
30 | 0.4 | 26 | 0.3 | 30 | 0.3 | 33 | 0.4 | 35 | 0.4 |
South Asian |
39 | 0.5 | 24 | 0.3 | 22 | 0.2 | 21 | 0.2 | 25 | 0.3 |
Chinese |
33 | 0.4 | 34 | 0.4 | 34 | 0.4 | 35 | 0.4 | 36 | 0.4 |
Filipino |
8 | 0.1 | 7 | 0.1 | 5 | 0.1 | 4 | 0.0 | 4 | 0.0 |
Japanese |
2 | 0.0 | 1 | 0.0 | 1 | 0.0 | 3 | 0.0 | 4 | 0.0 |
Korean |
1 | 0.0 | 1 | 0.0 | 1 | 0.0 | 1 | 0.0 | 1 | 0.0 |
| Hispanic | 15 | 0.2 | 16 | 0.2 | 14 | 0.2 | 14 | 0.2 | 12 | 0.1 |
Latin American |
15 | 0.2 | 16 | 0.2 | 14 | 0.2 | 14 | 0.2 | 12 | 0.1 |
| Other | 66 | 0.8 | 65 | 0.8 | 68 | 0.8 | 71 | 0.8 | 81 | 0.9 |
| Does not want to provide | 39 | 0.5 | 42 | 0.5 | 45 | 0.5 | 51 | 0.6 | 102 | 1.2 |
| Unknown | 4,803 | 59.7 | 5,501 | 64.9 | 5,983 | 67.6 | 5,956 | 68.5 | 5,714 | 66.9 |
| Total | 8,041 | 100.0 | 8,477 | 100.0 | 8,857 | 100.0 | 8,695 | 100.0 | 8,537 | 100.0 |
Source: Correctional Service of Canada.
Table C14 Notes
The Canadian Victims Bill of Rights defines a victim as any individual who has suffered physical or emotional harm, property damage, or economic loss as the result of the commission of an offence. The law also allows a spouse, a relative or dependant, an individual who is responsible for the care or support of the victim or the care or support of a dependant of the victim, to act on behalf of a victim, if the victim cannot act on their own behalf. Victims include persons harmed by the offender regardless of whether the offender has been prosecuted or not, as long as an official complaint has been made to the police or to the Crown.
Victims do not automatically receive information about the offender who harmed them. If they have been harmed by an offender serving a sentence of 2 years or more, victims must register with the Correctional Service of Canada (CSC) or the Parole Board of Canada to receive information or access services. Registration allows CSC to verify that the individual meets the definition of victim, which is required by law before sharing protected offender information. https://www.csc-scc.gc.ca/victims/003006-7001-en.shtml
Demographic information is voluntarily self-reported by victims who have registered with CSC to receive information about the offender who harmed them. The information does not represent victims who have not been in contact with CSC or those who choose not to register.
The difference between the total number of registered victims and the number of victims who voluntarily self-reported their race is the result of victims choosing not to report their race or their race is unknown to CSC. The response rate for victim race has remained stable for the past three fiscal years.
The total number of victims for whom CSC has reported race data for 2021-22 is 2,823 whereby it is 5,714 for unknown, which means CSC has self-reported race data for less than a third of registered victims. Therefore, these statistics do not represent the entirety of registered victims.
Reported data is current up to the end of each fiscal year. A fiscal year runs from April 1 to March 31 of the following year.
CSC offender population by religion
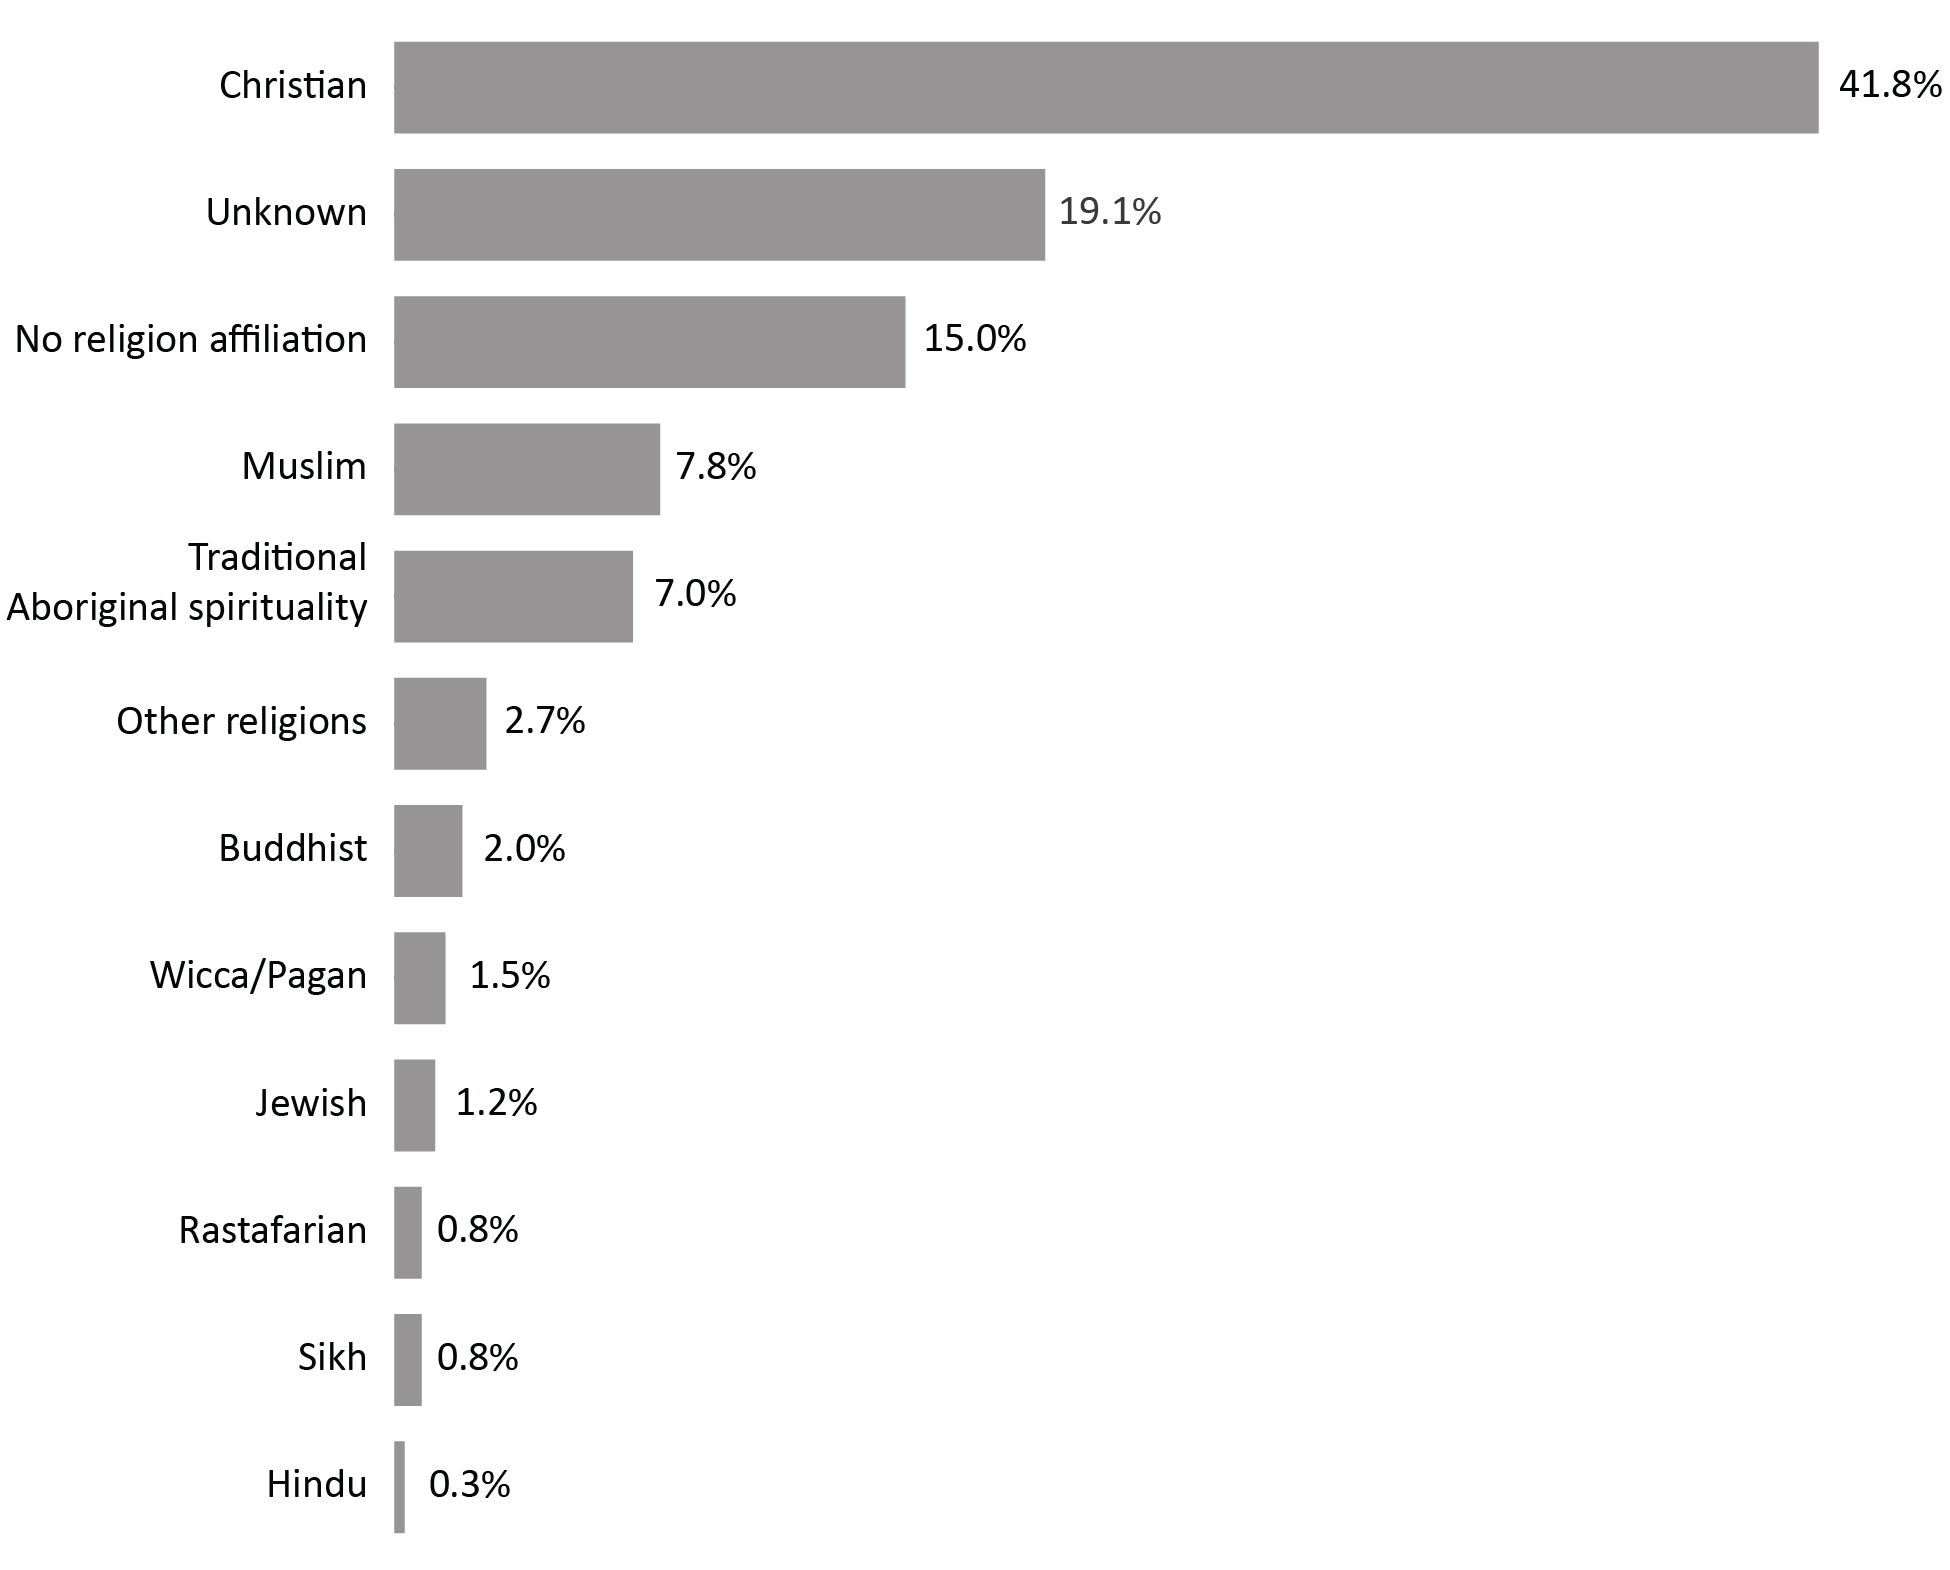
Image description
Bar graph showing the percentage of total Correctional Service of Canada offender population by religious identification in fiscal year 2021 to 2022. Christian offenders accounted for 41.8 percent of the offender population; the religious affiliation for 19.1 percent of offenders was not known; offenders with no religious affiliation accounted for 15 percent of offenders; Muslim offenders account for 7.8 percent; offenders reporting following the teachings of Traditional Aboriginal Spirituality accounted for 7 percent; offenders of the category of “other religions” accounted for 2.7 percent; Buddhist offenders accounted for 2 percent; Wiccan and Pagan offenders accounted for 1.5 percent; Jewish offenders accounted for 1.2 percent; Sikh offenders accounted for 0.8 percent; Rastafarian offenders accounted for 0.8 percent; and, Hindu offenders accounted for 0.3 percent. Full data are available immediately below.
Source: Correctional Service of Canada.
- The religious identification of the CSC offender population is diverse. While the proportion of offenders who identified as Christian still represented the majority, their proportions decreased from 49.5% in 2017-18 to 41.8% in 2021-22.
- Religious identification was unknown for 19.1% of offenders, whereas 15.0% stated they had no religion.
- Note that the religion groupings were changed starting in the 2018 publication to reflect the same groupings as Statistics Canada.
Figure C15 Notes
Religious identification is self-reported by offenders while they are incarcerated, and the categories are not comprehensive; therefore, the reader should interpret these data with caution.
Buddhist includes offenders who belong to the following group: Buddhist, Mahayana Buddhist, Theravadan Buddhist and Vajrayana Buddhist.
Christian includes offenders who belong to the following group: Amish, Anglican (Episcopal Church of England), Antiochian Orthodox, Apostolic Christian Church, Armenian Orthodox/Apostolic, Associated Gospel, Assyrian Chaldean Catholic, Baptist, Brethren In Christ, Bulgarian Orthodox, Canadian Reformed Church, Catholic- Greek, Catholic-Roman, Catholic-Ukranian, Catholic Non-Specific, Churches of Christ/Christian Churches, Charismatic, Christadelphian, Christian & Missionary Alliance, Christian Congregational, Christian Non Specific, Christian Or Plymouth Brethren, Christian Orthodox, Christian Reformed, Christian Reformed Church, Christian Science, Church of Christ Scientist, Church of God, Church of Jesus Christ of Latter-Day Saint, Community of Christ, Coptic Orthodox, Doukhobor, Dutch Reformed Church, Ethiopian Orthodox, Evangelical, Evangelical Free Church , Evangelical Missionary Church, Free Methodist, Free Reformed Church, Grace Communion International, Greek Orthodox, Hutterite, Iglesia Ni Cristo, Jehovah's Witnesses, Lutheran, Macedonian Orthodox, Maronite, Melkite, Mennonite, Messianic Jew, Methodist Christian, Metropolitan Community Church, Mission de l'Esprit Saint, Moravian, Mormon (Latter Day Saints), Nazarene Christian, Netherlands Reformed, New Apostolic, Pentecostal (4-Square), Pentecostal Assembly of God, Pentecôtiste, Philadelphia Church of God, Presbyterian, Protestant Non-Specific, Quaker (Society of Friends), Reformed Christian, Romanian Orthodox, Russian Orthodox, Salvation Army, Serbian Orthodox, Seventh Day Adventist, Shaker, Swedenborgian (New Church), Syrian/Syriac Orthodox, Ukrainian Catholic, Ukrainian Orthodox, United Church, United Reformed Church, Vineyard Christian Fellowship, Wesleyan Christian and Worldwide Church of God.
Hindu includes offenders who belong to the following group: Hindu and Siddha Yoga.
Jewish includes offenders who belong to the following group: Jewish Orthodox, Jewish Reformed and Judaism.
Muslim includes offenders who belong to the following group: Muslim and Sufism.
Rastafarian includes offenders who belong to the following group: Rastafarian.
Sikh includes offenders who belong to the following group: Sikh.
Traditional Indigenous Spirituality includes offenders who belong to the following group: Indigenous Spirituality Catholic, Traditional Indigenous Protestant, Native Spirituality, Catholic - Native Spirituality, Native Spirituality Protestant and Indigenous Spirituality.
Wiccan/Pagan includes offenders who belong to the following group: Asatru Paganism, Druidry Paganism, Pagan and Wicca.
Other Religion includes offenders who belong to the following group: Baha'i, Eckankar, Independent Spirituality, Jain, Krishna, New Age, New Thought-Unity-Religious Science, Other, Pantheist, Rosicrucian, Satanist, Scientology, Shintoïste, Spiritualist, Taoism, Transcendental Meditation, Unification Church, Unitarian, Visnabha and Zoroastrian.
No religion affiliation includes offenders who belong to the following group: Agnostic, Atheist, Gnostic, Humanist and offenders who have no religion affiliation.
Unknown includes offenders who belong to the following group: Unknown, not stated as well as those offenders who have no religion specified.
The data reflect all active offenders, who are incarcerated in a CSC facility, offenders on temporary absence from a CSC facility, offenders who are temporarily detained, offenders who are actively supervised, and offenders who are unlawfully at large for less than 90 days.
The data reflect the number of offenders active at the end of each fiscal year. A fiscal year runs from April 1 to March 31 of the following year.
Due to rounding, percentages may not add to 100 percent.
| 2017-18 | 2021-22 | |||
|---|---|---|---|---|
| # | % | # | % | |
| Buddhist | 508 | 2.2 | 425 | 2.0 |
| Christian | 11,503 | 49.5 | 8,688 | 41.8 |
| Hindu | 63 | 0.3 | 59 | 0.3 |
| Jewish | 220 | 0.9 | 252 | 1.2 |
| Muslim | 1,539 | 6.6 | 1,627 | 7.8 |
| Rastafarian | 178 | 0.8 | 158 | 0.8 |
| Sikh | 188 | 0.8 | 170 | 0.8 |
| Traditional Aboriginal spirituality | 1,338 | 5.8 | 1,465 | 7.0 |
| Wicca/Pagan | 318 | 1.4 | 306 | 1.5 |
| Other religions | 442 | 1.9 | 561 | 2.7 |
| No religion affiliation | 3,480 | 15.0 | 3,117 | 15.0 |
| Unknown | 3,446 | 14.8 | 3,979 | 19.1 |
| Total | 23,223 | 100.0 | 20,807 | 100.0 |
Source: Correctional Service of Canada.
Table C15 Notes
Religious identification is self-reported by offenders while they are incarcerated, and the categories are not comprehensive; therefore, the reader should interpret these data with caution.
Buddhist includes offenders who belong to the following group: Buddhist, Mahayana Buddhist, Theravadan Buddhist and Vajrayana Buddhist.
Christian includes offenders who belong to the following group: Amish, Anglican (Episcopal Church of England), Antiochian Orthodox, Apostolic Christian Church, Armenian Orthodox/Apostolic, Associated Gospel, Assyrian Chaldean Catholic, Baptist, Brethren In Christ, Bulgarian Orthodox, Canadian Reformed Church, Catholic- Greek, Catholic-Roman, Catholic-Ukranian, Catholic Non-Specific, Churches of Christ/Christian Churches, Charismatic, Christadelphian, Christian & Missionary Alliance, Christian Congregational, Christian Non Specific, Christian Or Plymouth Brethren, Christian Orthodox, Christian Reformed, Christian Reformed Church, Christian Science, Church of Christ Scientist, Church of God, Church of Jesus Christ of Latter-Day Saint, Community of Christ, Coptic Orthodox, Doukhobor, Dutch Reformed Church, Ethiopian Orthodox, Evangelical, Evangelical Free Church , Evangelical Missionary Church, Free Methodist, Free Reformed Church, Grace Communion International, Greek Orthodox, Hutterite, Iglesia Ni Cristo, Jehovah's Witnesses, Lutheran, Macedonian Orthodox, Maronite, Melkite, Mennonite, Messianic Jew, Methodist Christian, Metropolitan Community Church, Mission de l'Esprit Saint, Moravian, Mormon (Latter Day Saints), Nazarene Christian, Netherlands Reformed, New Apostolic, Pentecostal (4-Square), Pentecostal Assembly of God, Pentecôtiste, Philadelphia Church of God, Presbyterian, Protestant Non-Specific, Quaker (Society of Friends), Reformed Christian, Romanian Orthodox, Russian Orthodox, Salvation Army, Serbian Orthodox, Seventh Day Adventist, Shaker, Swedenborgian (New Church), Syrian/Syriac Orthodox, Ukrainian Catholic, Ukrainian Orthodox, United Church, United Reformed Church, Vineyard Christian Fellowship, Wesleyan Christian and Worldwide Church of God.
Hindu includes offenders who belong to the following group: Hindu and Siddha Yoga.
Jewish includes offenders who belong to the following group: Jewish Orthodox, Jewish Reformed and Judaism.
Muslim includes offenders who belong to the following group: Muslim and Sufism.
Rastafarian includes offenders who belong to the following group: Rastafarian.
Sikh includes offenders who belong to the following group: Sikh.
Traditional Indigenous Spirituality includes offenders who belong to the following group: Indigenous Spirituality Catholic, Traditional Indigenous Protestant, Native Spirituality, Catholic - Native Spirituality, Native Spirituality Protestant and Indigenous Spirituality.
Wiccan/Pagan includes offenders who belong to the following group: Asatru Paganism, Druidry Paganism, Pagan and Wicca.
Other Religion includes offenders who belong to the following group: Baha'i, Eckankar, Independent Spirituality, Jain, Krishna, New Age, New Thought-Unity-Religious Science, Other, Pantheist, Rosicrucian, Satanist, Scientology, Shintoïste, Spiritualist, Taoism, Transcendental Meditation, Unification Church, Unitarian, Visnabha and Zoroastrian.
No religion affiliation includes offenders who belong to the following group: Agnostic, Atheist, Gnostic, Humanist and offenders who have no religion affiliation.
Unknown includes offenders who belong to the following group: Unknown, not stated as well as those offenders who have no religion specified.
The data reflect all active offenders, who are incarcerated in a CSC facility, offenders on temporary absence from a CSC facility, offenders who are temporarily detained, offenders who are actively supervised, and offenders who are unlawfully at large for less than 90 days.
The data reflect the number of offenders active at the end of each fiscal year. A fiscal year runs from April 1 to March 31 of the following year.
Due to rounding, percentages may not add to 100 percent.
CSC offenders by Indigenous and non-Indigenous self-identification
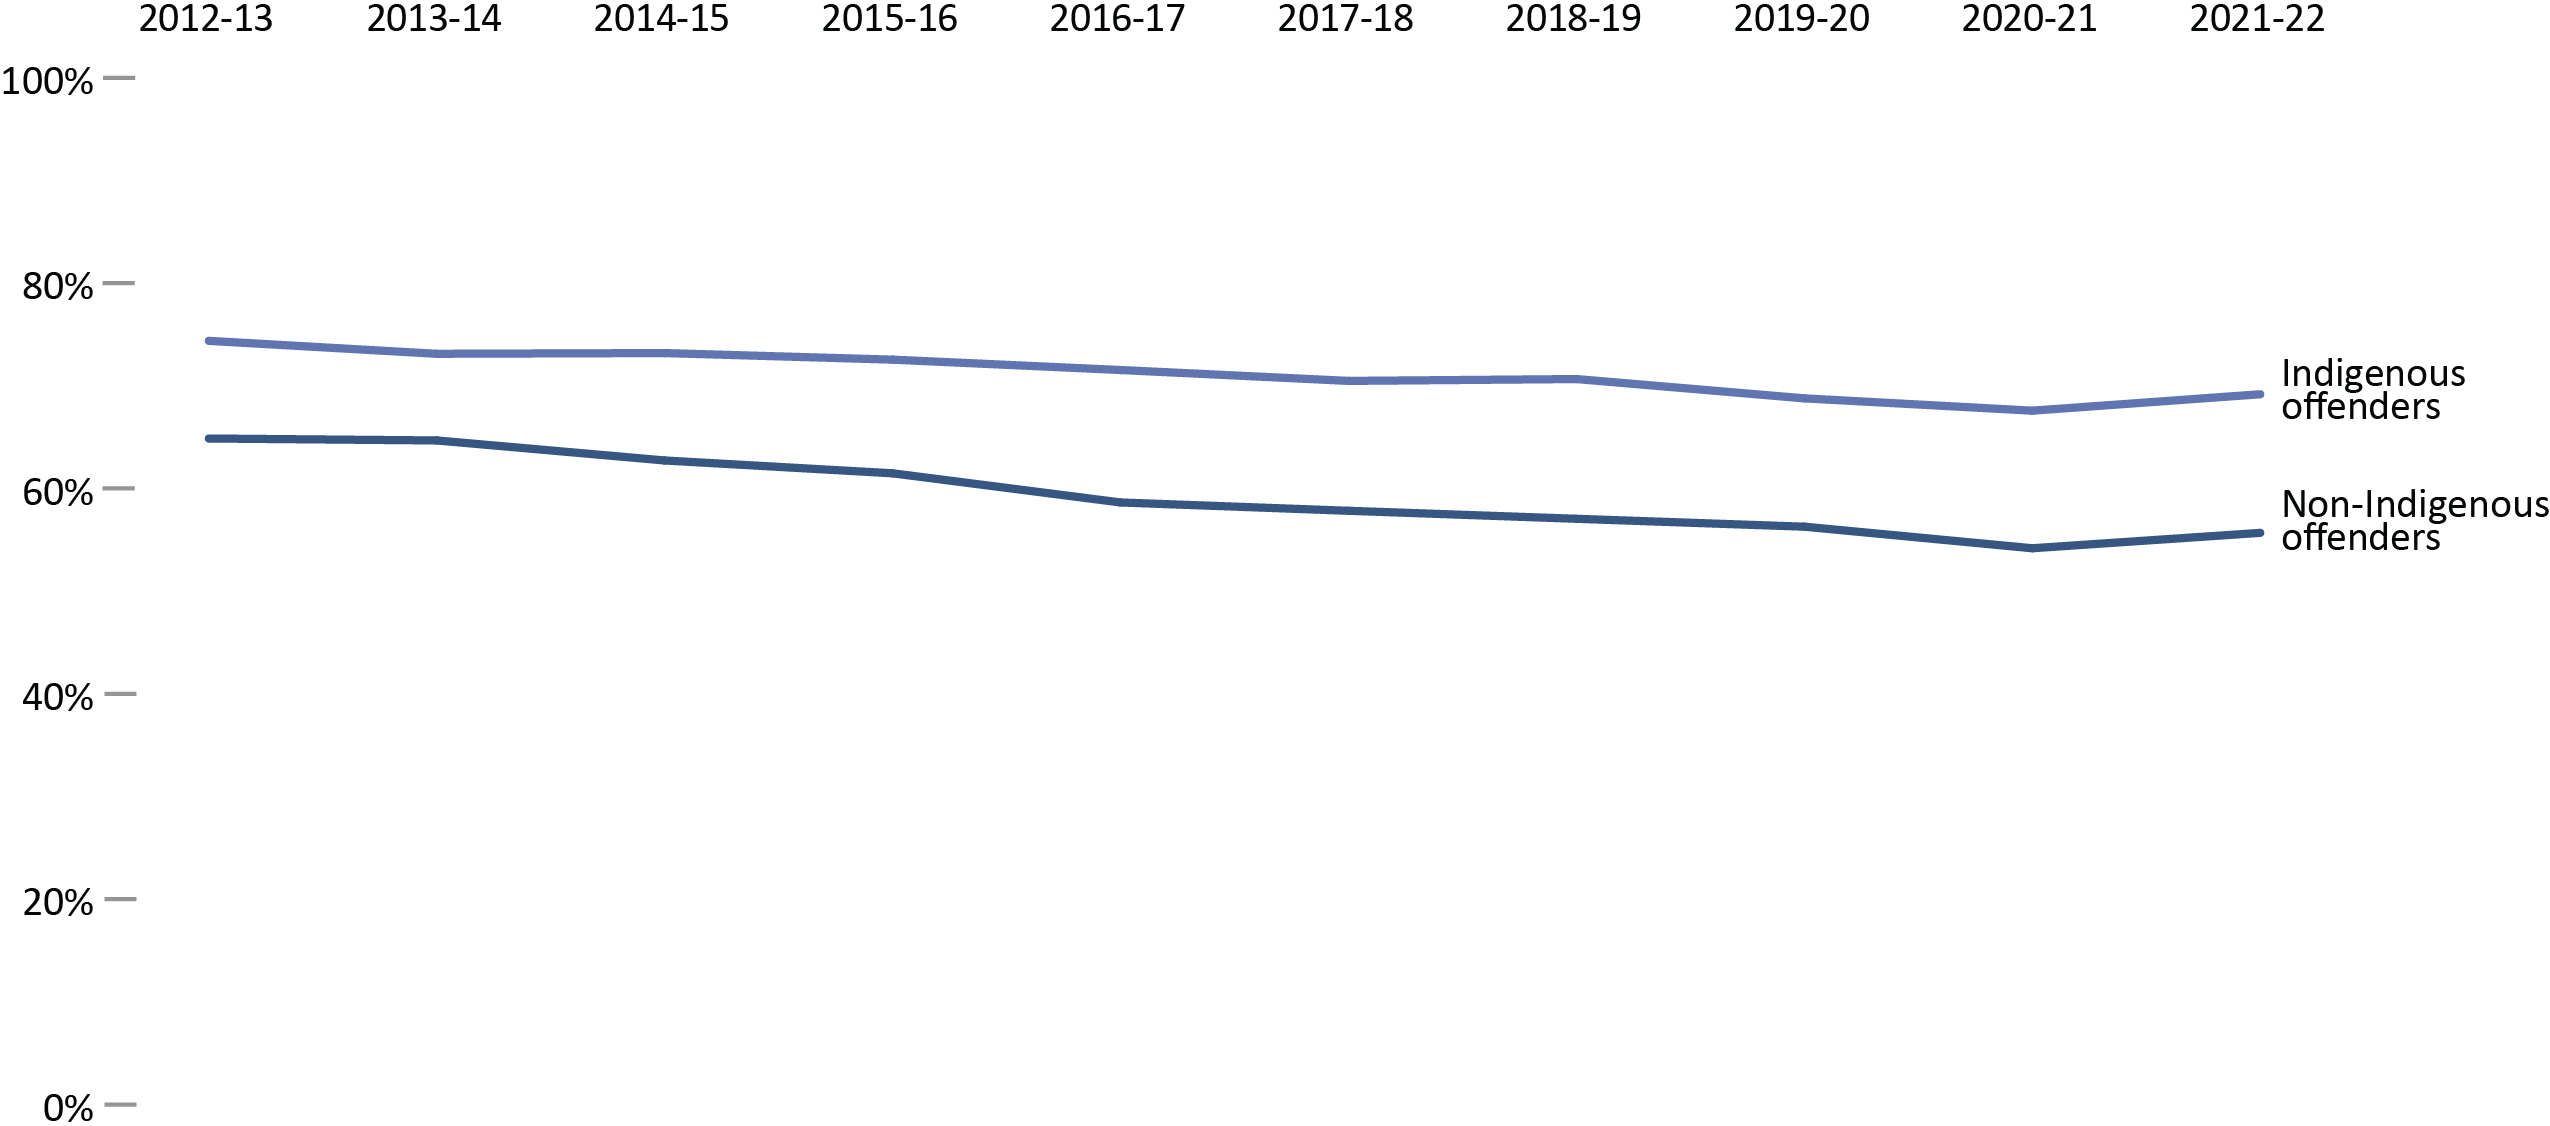
Image description
Line graph showing the proportion of self-identified Indigenous and self-identified non-Indigenous offenders in custody from fiscal year 2012 to 2013 until fiscal year 2021 to 2022. The percentage of self-identified Indigenous offenders decreased from fiscal year 2011 to 2012, experiencing a slight rise in fiscal year 2018 to 2019 to 71.5 percent, then ending at its lowest point of 67.4 percent in fiscal year 2020 to 2021 before rising slightly during 2021 to 2022 at 69.9 percent. The percentage of self-identified non-Indigenous offenders dropped steadily to fiscal year 2020 to 2021 at 54.8 percent before increasing slightly to 56.3 in 2021 to 2022. Full data are immediately below.
Source: Correctional Service of Canada.
- At the end of fiscal year 2021-22, the proportion of offenders in custody was 13.5% greater for Indigenous offenders (69.0%) than for non-Indigenous offenders (55.5%).
- Indigenous females in custody represent 49.5% of all in-custody females while Indigenous males who were in custody represented 31.8% of all males in custody.
- In 2021-22, Indigenous offenders represented 28.1% of the total offender population.
- Per Table C16, Indigenous offenders accounted for 32.7% of the in-custody population and 21.4% of the community population in 2021-22.
Figure C16 Notes
Total Offender Population includes all active offenders, who are incarcerated in a CSC facility, offenders on temporary absence from a CSC facility, offenders who are temporarily detained, offenders who are actively supervised, and offenders who are unlawfully at large for less than 90 days.
In Custody includes all active offenders incarcerated in a CSC facility, offenders on temporary absence from a CSC facility, offenders who are temporarily detained in a CSC facility and offenders on remand in a CSC facility.
In Community Under Supervision includes all active offenders on day parole, full parole, statutory release, in the community supervised on a long-term supervision order, offenders who are temporarily detained in a non-CSC facility, offenders who are unlawfully at large for less than 90 days, offenders on remand in a non-CSC facility, and offenders supervised and subject to an immigration hold by Canada Border Services Agency.
Indigenous identity is self-reported. Non-indigenous offenders includes offenders who do not identify as Indigenous. See Table C9 for the ethnic diversity of CSC’s offender population.
The data reflect the number of offenders active at the end of each fiscal year. A fiscal year runs from April 1 to March 31 of the following year.
| In-custody population | In community under supervision | Total | |||||
|---|---|---|---|---|---|---|---|
| # | % | # | % | ||||
| Males | 2017-18 | Indigenous | 3,647 | 71.4 | 1,464 | 28.6 | 5,111 |
| Non-Indigenous | 9,769 | 58.4 | 6,946 | 41.6 | 16,715 | ||
| Total | 13,416 | 61.5 | 8,410 | 38.5 | 21,826 | ||
| 2018-19 | Indigenous | 3,877 | 71.5 | 1,548 | 28.5 | 5,425 | |
| Non-Indigenous | 9,571 | 57.6 | 7,036 | 42.4 | 16,607 | ||
| Total | 13,448 | 61.0 | 8,584 | 39.0 | 22,032 | ||
| 2019-20 | Indigenous | 3,855 | 69.6 | 1,684 | 30.4 | 5,539 | |
| Non-Indigenous | 9,177 | 56.8 | 6,966 | 43.2 | 16,143 | ||
| Total | 13,032 | 60.1 | 8,650 | 39.9 | 21,682 | ||
| 2020-21 | Indigenous | 3,646 | 68.5 | 1,678 | 31.5 | 5,324 | |
| Non-Indigenous | 8,132 | 54.8 | 6,718 | 45.2 | 14,850 | ||
| Total | 11,778 | 58.4 | 8,396 | 41.6 | 20,174 | ||
| 2021-22 | Indigenous | 3,737 | 69.9 | 1,613 | 30.1 | 5,350 | |
| Non-Indigenous | 8,003 | 56.3 | 6,223 | 43.7 | 14,226 | ||
| Total | 11,740 | 60.0 | 7,836 | 40.0 | 19,576 | ||
| Females | 2017-18 | Indigenous | 270 | 58.6 | 191 | 41.4 | 461 |
| Non-Indigenous | 406 | 43.4 | 530 | 56.6 | 936 | ||
| Total | 676 | 48.4 | 721 | 51.6 | 1,397 | ||
| 2018-19 | Indigenous | 291 | 59.5 | 198 | 40.5 | 489 | |
| Non-Indigenous | 410 | 43.5 | 533 | 56.5 | 943 | ||
| Total | 701 | 49.0 | 731 | 51.0 | 1,432 | ||
| 2019-20 | Indigenous | 279 | 57.3 | 208 | 42.7 | 487 | |
| Non-Indigenous | 406 | 43.7 | 523 | 56.3 | 929 | ||
| Total | 685 | 48.4 | 731 | 51.6 | 1,416 | ||
| 2020-21 | Indigenous | 267 | 55.2 | 217 | 44.8 | 484 | |
| Non-Indigenous | 351 | 41.2 | 500 | 58.8 | 851 | ||
| Total | 618 | 46.3 | 717 | 53.7 | 1,335 | ||
| 2021-22 | Indigenous | 291 | 59.4 | 199 | 40.6 | 490 | |
| Non-Indigenous | 297 | 40.1 | 444 | 59.9 | 741 | ||
| Total | 588 | 47.8 | 643 | 52.2 | 1,231 | ||
| Another sex | 2019-20 | Indigenous | 1 | 100.0 | 0 | 0.0 | 1 |
| Non-Indigenous | 2 | 66.7 | 1 | 33.3 | 3 | ||
| Total | 3 | 75.0 | 1 | 25.0 | 4 | ||
| 2020-21 | Indigenous | 1 | 100.0 | 0 | 0.0 | 1 | |
| Non-Indigenous | 2 | 100.0 | 0 | 0.0 | 2 | ||
| Total | 3 | 100.0 | 0 | 0.0 | 3 | ||
| 2021-22 | Indigenous | 0 | 0 | 0 | 0 | 0 | |
| Non-Indigenous | 0 | 0 | 0 | 0 | 0 | ||
| Total | 0 | 0 | 0 | 0 | 0 | ||
Source: Correctional Service of Canada.
Table C16 Notes
Results for “Another sex” were unavailable prior to 2019-20.
Total Offender Population includes all active offenders, who are incarcerated in a CSC facility, offenders on temporary absence from a CSC facility, offenders who are temporarily detained, offenders who are actively supervised, and offenders who are unlawfully at large for less than 90 days.
In Custody includes all active offenders incarcerated in a CSC facility, offenders on temporary absence from a CSC facility, offenders who are temporarily detained in a CSC facility and offenders on remand in a CSC facility.
In Community Under Supervision includes all active offenders on day parole, full parole, statutory release, in the community supervised on a long-term supervision order, offenders who are temporarily detained in a non-CSC facility, offenders who are unlawfully at large for less than 90 days, offenders on remand in a non-CSC facility, and offenders supervised and subject to an immigration hold by Canada Border Services Agency.
Indigenous identity is self-reported. Non-indigenous offenders includes offenders who do not identify as Indigenous. See Table C9 for the ethnic diversity of CSC’s offender population.
The data reflect the number of offenders active at the end of each fiscal year. A fiscal year runs from April 1 to March 31 of the following year.
Offenders in custody at a CSC facility by security risk classification
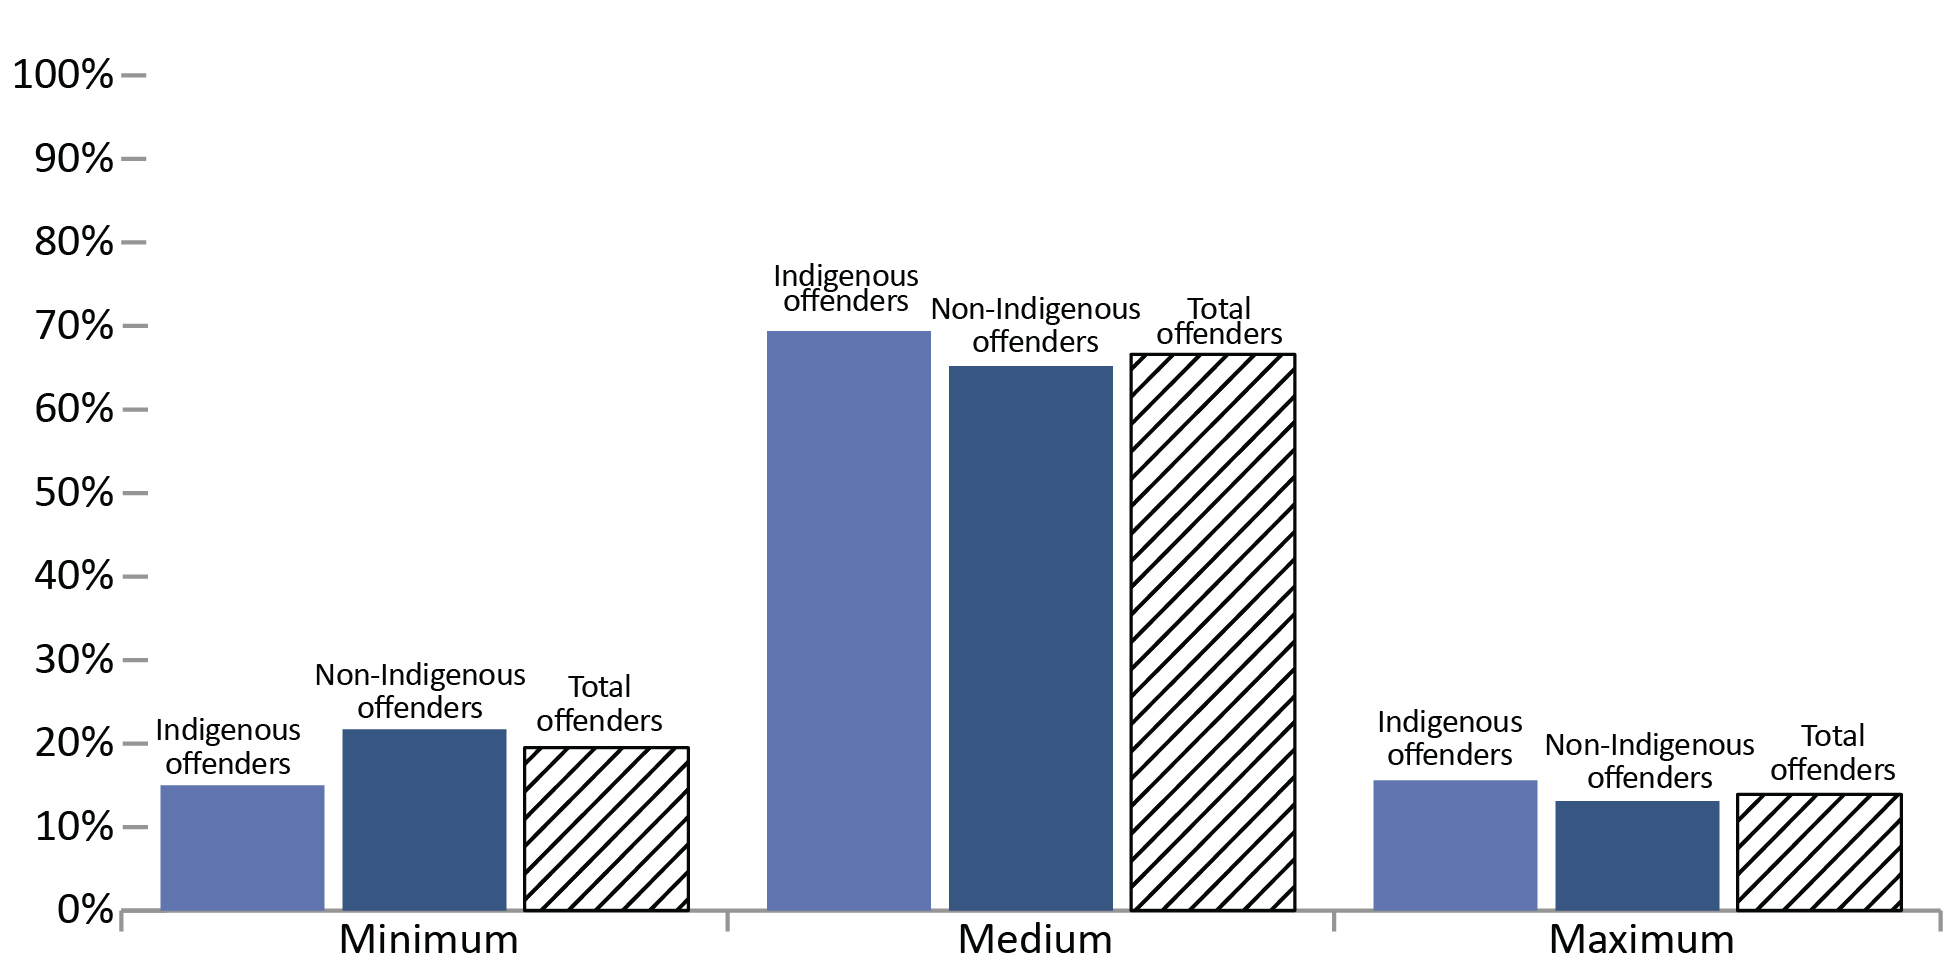
Image description
Bar graph comparing the percentage of in-custody offenders at a Correctional Service Canada facility by security risk classification and Indigeneity for fiscal year 2021 to 2022. Minimum security facilities had fewer Indigenous offenders at 15 percent than non-Indigenous offenders at 21.7 percent. Medium security facilities had the most offenders in both identity categories. Medium security facilities had larger proportion of Indigenous offenders at 69.4 percent, than non-Indigenous offenders at 65.2 percent. Finally maximum security facilities also had more Indigenous offenders at 15.6 percent than non-Indigenous offenders at 13.1 percent. Full data are available immediately below.
Source: Correctional Service of Canada.
- In 2021-22, two-thirds (66.6%) of offenders were classified as medium security risk. Indigenous offenders were more likely to be classified to a medium or maximum security risk compared to non-Indigenous offenders.
- Compared to non-Indigenous offenders, a lower percentage of Indigenous offenders were classified as minimum security risk (15.0% vs. 21.7%) and a higher percentage were classified as medium (69.4% vs. 65.2%) and maximum (15.6% vs. 13.1%) security risk.
Figure C17 Notes
In Custody includes all active offenders incarcerated in a CSC facility, offenders on temporary absence from a CSC facility, offenders who are temporarily detained in a CSC facility and offenders on remand in a CSC facility.
The data represent the offender security level decision as of end of fiscal year 2021-22. A fiscal year runs from April 1 to March 31 of the following year.
| Security risk level | Indigenous | Non-Indigenous | Total | |||
|---|---|---|---|---|---|---|
| # | % | # | % | # | % | |
| Minimum | 564 | 15.0 | 1,622 | 21.7 | 2,186 | 19.5 |
| Medium | 2,601 | 69.4 | 4,867 | 65.2 | 7,468 | 66.6 |
| Maximum | 585 | 15.6 | 974 | 13.1 | 1,559 | 13.9 |
| Total | 3,750 | 100.0 | 7,463 | 100.0 | 11,213 | 100.0 |
| Not yet determined | 278 | 100.0 | 837 | 100.0 | 1,115 | 100.0 |
| Total | 4,028 | 8,300 | 12,328 | |||
Source: Correctional Service of Canada.
Table C17 Notes
The "Not yet determined" category includes offenders who have not yet been classified.
In Custody includes all active offenders incarcerated in a CSC facility, offenders on temporary absence from a CSC facility, offenders who are temporarily detained in a CSC facility and offenders on remand in a CSC facility.
The data represent the offender security level decision as of end of fiscal year 2021-22. A fiscal year runs from April 1 to March 31 of the following year.
Admissions to federal jurisdiction with a life and/or indeterminate sentenceFootnote *: 10-year trend
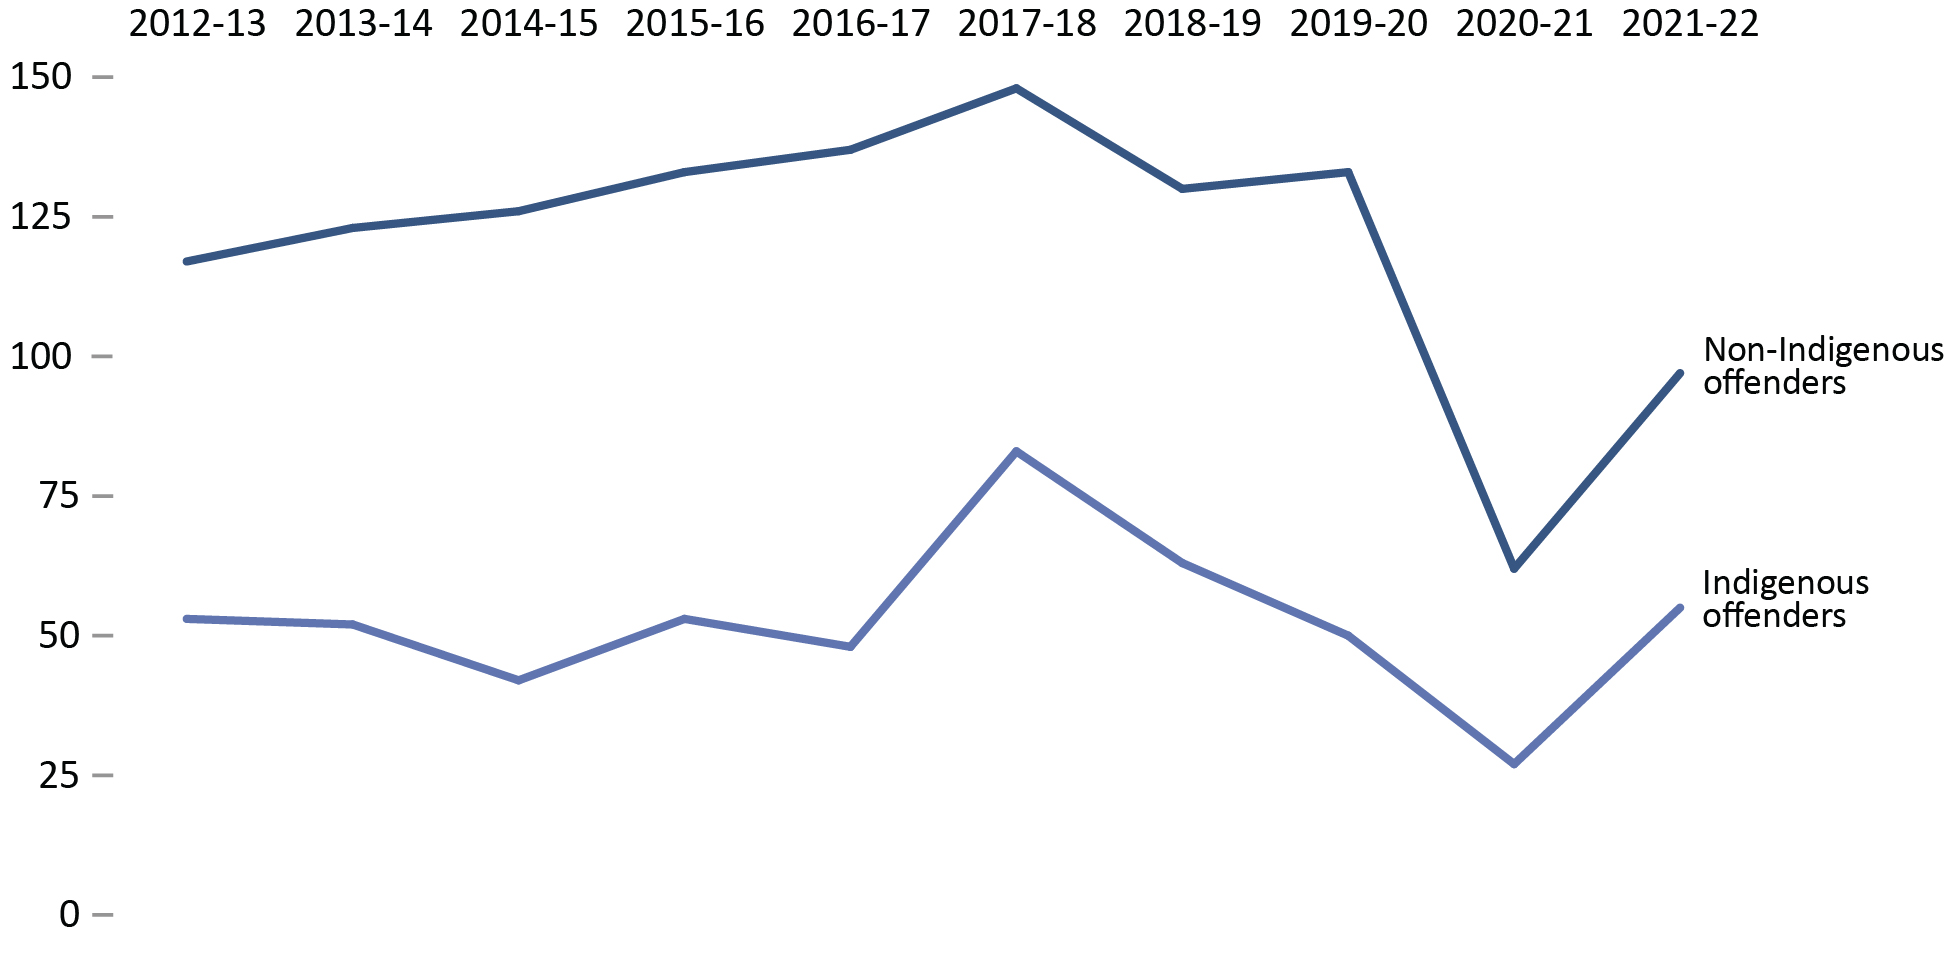
Image description
Line graph showing the number of warrant of committal admissions to federal jurisdiction with life and/or indeterminate sentences from fiscal year 2012 to 2013 until fiscal year 2021 to 2022. Non-Indigenous offenders had a higher number of admissions than Indigenous offenders over time. Non-Indigenous offenders began with 117 admissions in fiscal year 2012 to 2013, rising to a peak of 148 admissions in fiscal year 2017 to 2018, then dropping to its lowest point of 62 admissions in fiscal year 2020 to 2021, and rising again to 97 admissions in 2021 to 2022. Indigenous offenders had 53 admissions in fiscal year 2012 to 2013, dropping to 42 admissions in fiscal year 2014 to 2015, rising to 53 admissions in fiscal year 2015 to 2016, dropping briefly to 48 admissions in fiscal year 2016 to 2017, rising to a peak of 83 admissions in fiscal year 2017 to 2018, dropping gradually to 27 admissions in fiscal year 2020 to 2021, and increasing again to 55 admissions in 2021 to 2022. Full data are available immediately below.
Source: Correctional Service of Canada.
- From 2012-13 to 2021-22, there was a decrease of 10.6% in the number of warrant of committal admissions to CSC facilities with a life and/or indeterminate sentenceFootnote * from 170 to 152. Much of this decrease occurred between 2019-20 and 2020-21.
- In 2021-22, the number of warrant of committal admissions to CSC facilities with a life and/or indeterminate sentenceFootnote * increased by 70.8% (from 89 to 152) compared to 2020-21.
- At the end of fiscal year 2021-22, there were a total of 3,574 offenders in custody with a life and/or indeterminate sentenceFootnote *. Of these, 3,452 (96.6%) were male, 122 (3.4%) were female; 1,031 (28.8%) were Indigenous and 2,543 (71.2%) were non-Indigenous.
- At the end of fiscal year 2021-22, 27.8% of the total population was serving a life and/or indeterminate sentenceFootnote *. Of these offenders, 61.7% were in custody and 38.3% were in the community under supervision.
| Fiscal year | Indigenous offenders | Non-Indigenous offenders | Total | ||||||
|---|---|---|---|---|---|---|---|---|---|
| Females | Males | Total | Females | Males | Total | Females | Males | Total | |
| 2012-13 | 6 | 47 | 53 | 2 | 115 | 117 | 8 | 162 | 170 |
| 2013-14 | 7 | 45 | 52 | 7 | 116 | 123 | 14 | 161 | 175 |
| 2014-15 | 1 | 41 | 42 | 8 | 118 | 126 | 9 | 159 | 168 |
| 2015-16 | 5 | 48 | 53 | 6 | 127 | 133 | 11 | 175 | 186 |
| 2016-17 | 2 | 46 | 48 | 11 | 126 | 137 | 13 | 172 | 185 |
| 2017-18 | 6 | 77 | 83 | 12 | 136 | 148 | 18 | 213 | 231 |
| 2018-19 | 7 | 56 | 63 | 3 | 127 | 130 | 10 | 183 | 193 |
| 2019-20 | 1 | 49 | 50 | 8 | 125 | 133 | 9 | 174 | 183 |
| 2020-21 | 2 | 25 | 27 | 0 | 62 | 62 | 2 | 87 | 89 |
| 2021-22 | 4 | 51 | 55 | 4 | 93 | 97 | 8 | 144 | 152 |
Source: Correctional Service of Canada.
Proportion of offenders with life and/or indeterminate sentences
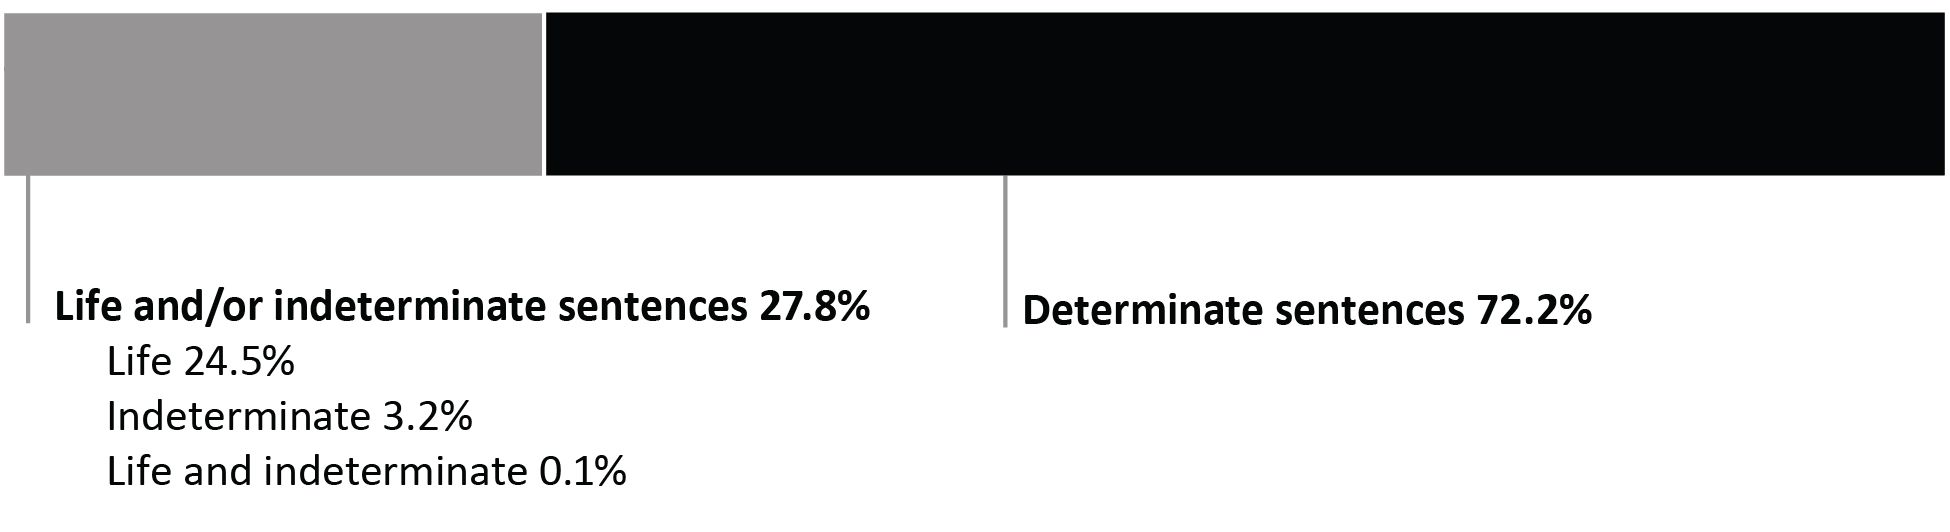
Image description
Bar illustration of the proportion of offenders with life and/or indeterminate sentences in fiscal year 2021 to 2022. Of sentences imposed for the total offender population in fiscal year 2021 to 2022, offenders with life and/or indeterminate sentences accounted for 27.8 percent of the sentences that were imposed. This includes 24.5 percent that were life sentences, 3.2 percent that were indeterminate sentences, and 0.1 percent that were both life and indeterminate sentences. Determinate sentences accounted for 72.2 percent of sentences that are imposed. Full data are available immediately below.
Source: Correctional Service of Canada.
- At the end of fiscal year 2021-22, there were 5,792 offenders serving a life sentence and/or an indeterminate sentence. This represents 27.8% of the total offender population. The majority (61.7%) of these offenders were in custody. Of the 2,218 offenders who were serving a life sentence and/or an indeterminate sentence in the community under supervision, the majority (79.4%) were serving a life sentence for 2nd Degree Murder.
- There were 20 offenders who were serving both a life sentence and an indeterminate sentence.
- There were 666 offenders who were serving an indeterminate sentence as a result of a special designation. The remaining 5,106 offenders did not receive a special designation, but were serving a life sentence.
- 93.0% of the 656 Dangerous Offenders with indeterminate sentences were in custody and 7.0% were in the community under supervision.
- In contrast, 44.4% of the 9 Dangerous Sexual Offenders were in custody and the offender with an Habitual Offender designation was in the community under supervision (in this table there is 1 offender with an Habitual Offender designation included in the Designation and Life grouping, this offender was in the community under supervision as well).
Figure C19 Notes
Although life sentences and indeterminate sentences both may result in imprisonment for life, they are different. A life sentence is a sentence of life imprisonment, imposed by a judge at the time of sentencing. An indeterminate sentence is a result of a designation, where an application is made to the court to declare an offender a Dangerous Offender, and the consequence of this designation is imprisonment for an indeterminate period. The Dangerous Sexual Offender and Habitual Offender designations were replaced with Dangerous Offender legislation in 1977.
Total Offender Population includes all active offenders, who are incarcerated in a CSC facility, offenders on temporary absence from a CSC facility, offenders who are temporarily detained, offenders who are actively supervised, and offenders who are unlawfully at large for less than 90 days.
In Custody includes all active offenders incarcerated in a CSC facility, offenders on temporary absence from a CSC facility, offenders who are temporarily detained in a CSC facility and offenders on remand in a CSC facility.
In Community Under Supervision includes all active offenders on day parole, full parole, statutory release, in the community supervised on a long-term supervision order, offenders who are temporarily detained in a non-CSC facility, offenders who are unlawfully at large for less than 90 days, offenders on remand in a non-CSC facility, and offenders supervised and subject to an immigration hold by Canada Border Services Agency.
Reported year periods reflect fiscal years. A fiscal year runs from April 1 to March 31 of the following year.
| Total offender population | In custody in a CSC facility | In community under supervision | ||||
|---|---|---|---|---|---|---|
| # | % | Incarcerated | Day parole | Full parole | OtherFootnote *** | |
| Offenders with a life sentence for: | ||||||
1st degree murder |
1,303 | 6.3 | 986 | 78 | 239 | 0 |
2nd degree murder |
3,613 | 17.4 | 1,853 | 239 | 1,521 | 0 |
Other offencesFootnote * |
190 | 0.9 | 104 | 11 | 75 | 0 |
Total |
5,106 | 24.5 | 2,943 | 328 | 1,835 | 0 |
| Offenders with indeterminate sentencesFootnote * resulting from the special designation of: | ||||||
Dangerous Offender |
656 | 3.2 | 610 | 22 | 24 | 0 |
Dangerous Sexual Offender |
9 | 0.0 | 4 | 1 | 4 | 0 |
Habitual Offender |
1 | 0.0 | 0 | 0 | 1 | 0 |
Total |
666 | 3.2 | 614 | 23 | 29 | 0 |
| Offenders serving an indeterminate sentence (due to a special designation) and a life sentence (due to an offence) | 20 | 0.1 | 17 | 1 | 2 | 0 |
| Total offenders with life and/or indeterminate sentence | 5,792 | 27.8 | 3,574 | 352 | 1,866 | 0 |
| Offenders serving determinate sentencesFootnote ** | 15,014 | 72.2 | 8,754 | 1,039 | 2,258 | 2,963 |
| TotalFootnote **** | 20,806 | 100.0 | 12,328 | 1,391 | 4,124 | 2,963 |
Source: Correctional Service of Canada.
Percentage of total offender population serving a sentence for a violent offence
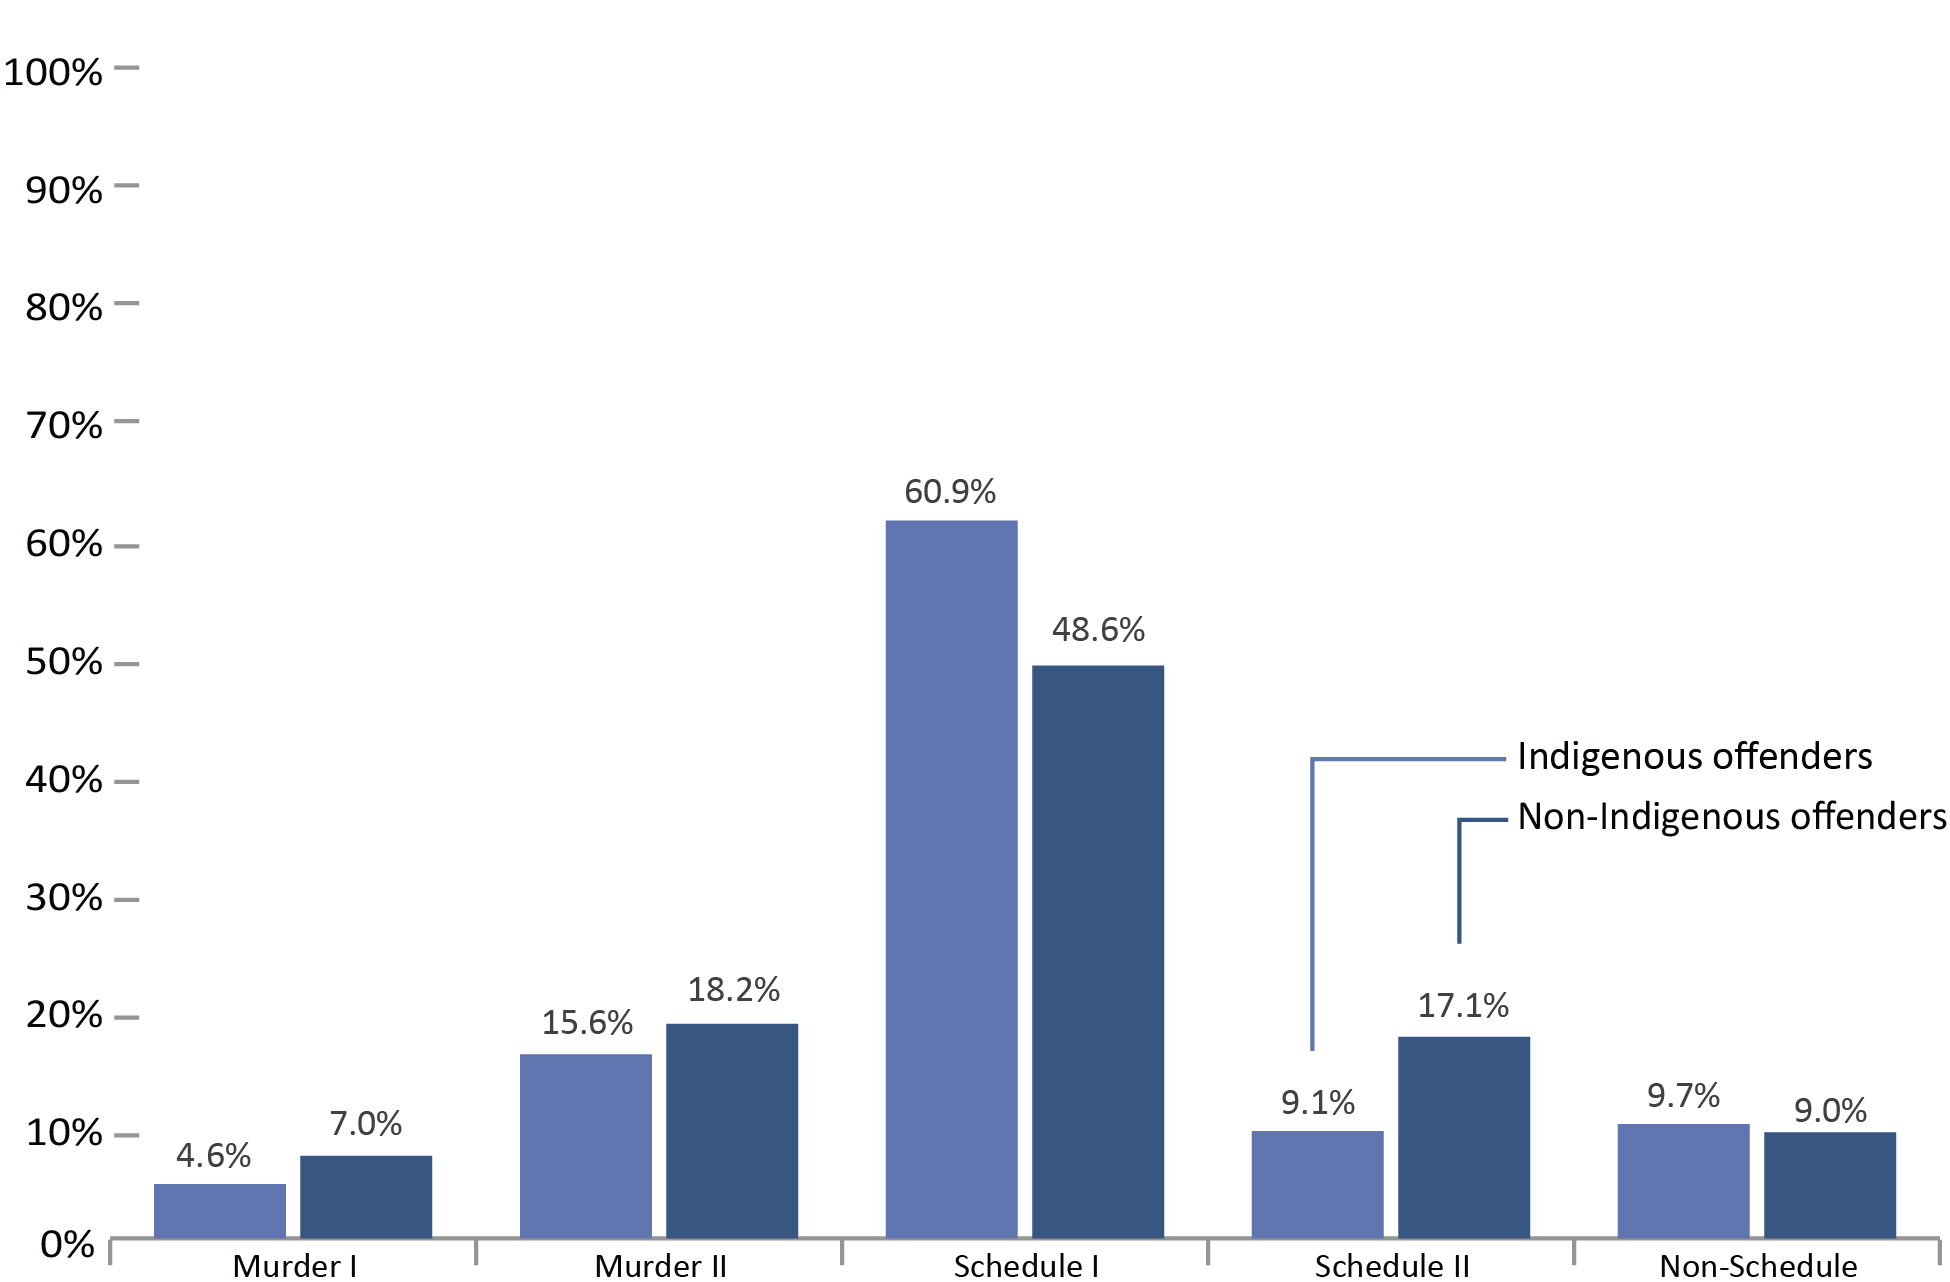
Image description
Bar graph showing the percentage of the total offender population serving a sentence for a violent offence, for Indigenous and non-Indigenous identities, in fiscal year 2021 to 2022. There was a higher percentage of non-Indigenous offenders for Murder I, Murder II, and Schedule II offences. Meanwhile, there was a higher percentage of Indigenous offenders for Schedule I and non-Schedule offences. Full data are available immediately below.
Source: Correctional Service of Canada.
- At the end of fiscal year 2021-22, Indigenous offenders were more likely to be serving a sentence for a violent offence (81.1% for Indigenous versus 73.8% for non-Indigenous).
- 67.3% of Indigenous female offenders were serving a sentence for a violent offence compared to 52.5% of non-Indigenous female offenders.
- Of the total number of offenders serving a sentence for Murder, 4.8% were female and 23.8% were Indigenous.
- A greater proportion of Indigenous offenders than non-Indigenous offenders were serving a sentence for a Schedule I offence (60.9% versus 48.6%, respectively).
- 9.1% of Indigenous offenders were serving a sentence for a Schedule II offence compared to 17.1% of non-Indigenous offenders.
- 28.0% of females were serving a sentence for a Schedule II offence compared to 14.1% for male.
Figure C20 Notes
Violent offences include first degree murder, second degree murder, and Schedule I offences.
Schedule I is comprised of sexual offences and other violent crimes excluding first and second degree murder (see the Corrections and Conditional Release Act).
Schedule II is comprised of serious drug offences or conspiracy to commit serious drug offences (see the Corrections and Conditional Release Act).
In cases where the offender is serving a sentence for more than 1 offence, the data reflect the most serious offence.
Total Offender Population includes all active offenders, who are incarcerated in a CSC facility, offenders on temporary absence from a CSC facility, offenders who are temporarily detained, offenders who are actively supervised, and offenders who are unlawfully at large for less than 90 days.
Reported year periods reflect fiscal years. A fiscal year runs from April 1 to March 31 of the following year.
| Offence category | Indigenous | Non-Indigenous | Total | |||||||||
|---|---|---|---|---|---|---|---|---|---|---|---|---|
| Female | Male | Another sex | Total | Female | Male | Another sex | Total | Female | Male | Another sex | Total | |
| Murder I | 11 | 256 | 0 | 267 | 43 | 1,008 | 0 | 1,051 | 54 | 1,264 | 0 | 1,318 |
| % | 2.2 | 4.8 | 0 | 4.6 | 5.8 | 7.1 | 0 | 7.0 | 4.4 | 6.5 | 0 | 6.3 |
| Murder II | 72 | 840 | 0 | 912 | 114 | 2,612 | 0 | 2,726 | 186 | 3,452 | 0 | 3,638 |
| % | 14.7 | 15.7 | 0 | 15.6 | 15.4 | 18.4 | 0 | 18.2 | 15.1 | 17.6 | 0 | 17.5 |
| Schedule I | 247 | 3,311 | 0 | 3,558 | 232 | 7,044 | 0 | 7,276 | 479 | 10,355 | 0 | 10,834 |
| % | 50.4 | 61.9 | 0 | 60.9 | 31.3 | 49.5 | 0 | 48.6 | 38.9 | 52.9 | 0 | 52.1 |
| Schedule II | 105 | 429 | 0 | 534 | 240 | 2,325 | 0 | 2,565 | 345 | 2,754 | 0 | 3,099 |
| % | 21.4 | 8.0 | 0 | 9.1 | 32.4 | 16.3 | 0 | 17.1 | 28.0 | 14.1 | 0 | 14.9 |
| Non-schedule | 55 | 514 | 0 | 569 | 112 | 1,237 | 0 | 1,349 | 167 | 1,751 | 0 | 1,918 |
| % | 11.2 | 9.6 | 0 | 9.7 | 15.1 | 8.7 | 0 | 9.0 | 13.6 | 8.9 | 0 | 9.2 |
| Total | 490 | 5,350 | 0 | 5,840 | 741 | 14,226 | 0 | 14,967 | 1,231 | 19,576 | 0 | 20,807 |
Source: Correctional Service of Canada.
Table C20 Notes
Violent offences include first degree murder, second degree murder, and Schedule I offences.
Schedule I is comprised of sexual offences and other violent crimes excluding first and second degree murder (see the Corrections and Conditional Release Act).
Schedule II is comprised of serious drug offences or conspiracy to commit serious drug offences (see the Corrections and Conditional Release Act).
In cases where the offender is serving a sentence for more than 1 offence, the data reflect the most serious offence.
Total Offender Population includes all active offenders, who are incarcerated in a CSC facility, offenders on temporary absence from a CSC facility, offenders who are temporarily detained, offenders who are actively supervised, and offenders who are unlawfully at large for less than 90 days.
Reported year periods reflect fiscal years. A fiscal year runs from April 1 to March 31 of the following year.
Indigenous offenders under the responsibility of CSC
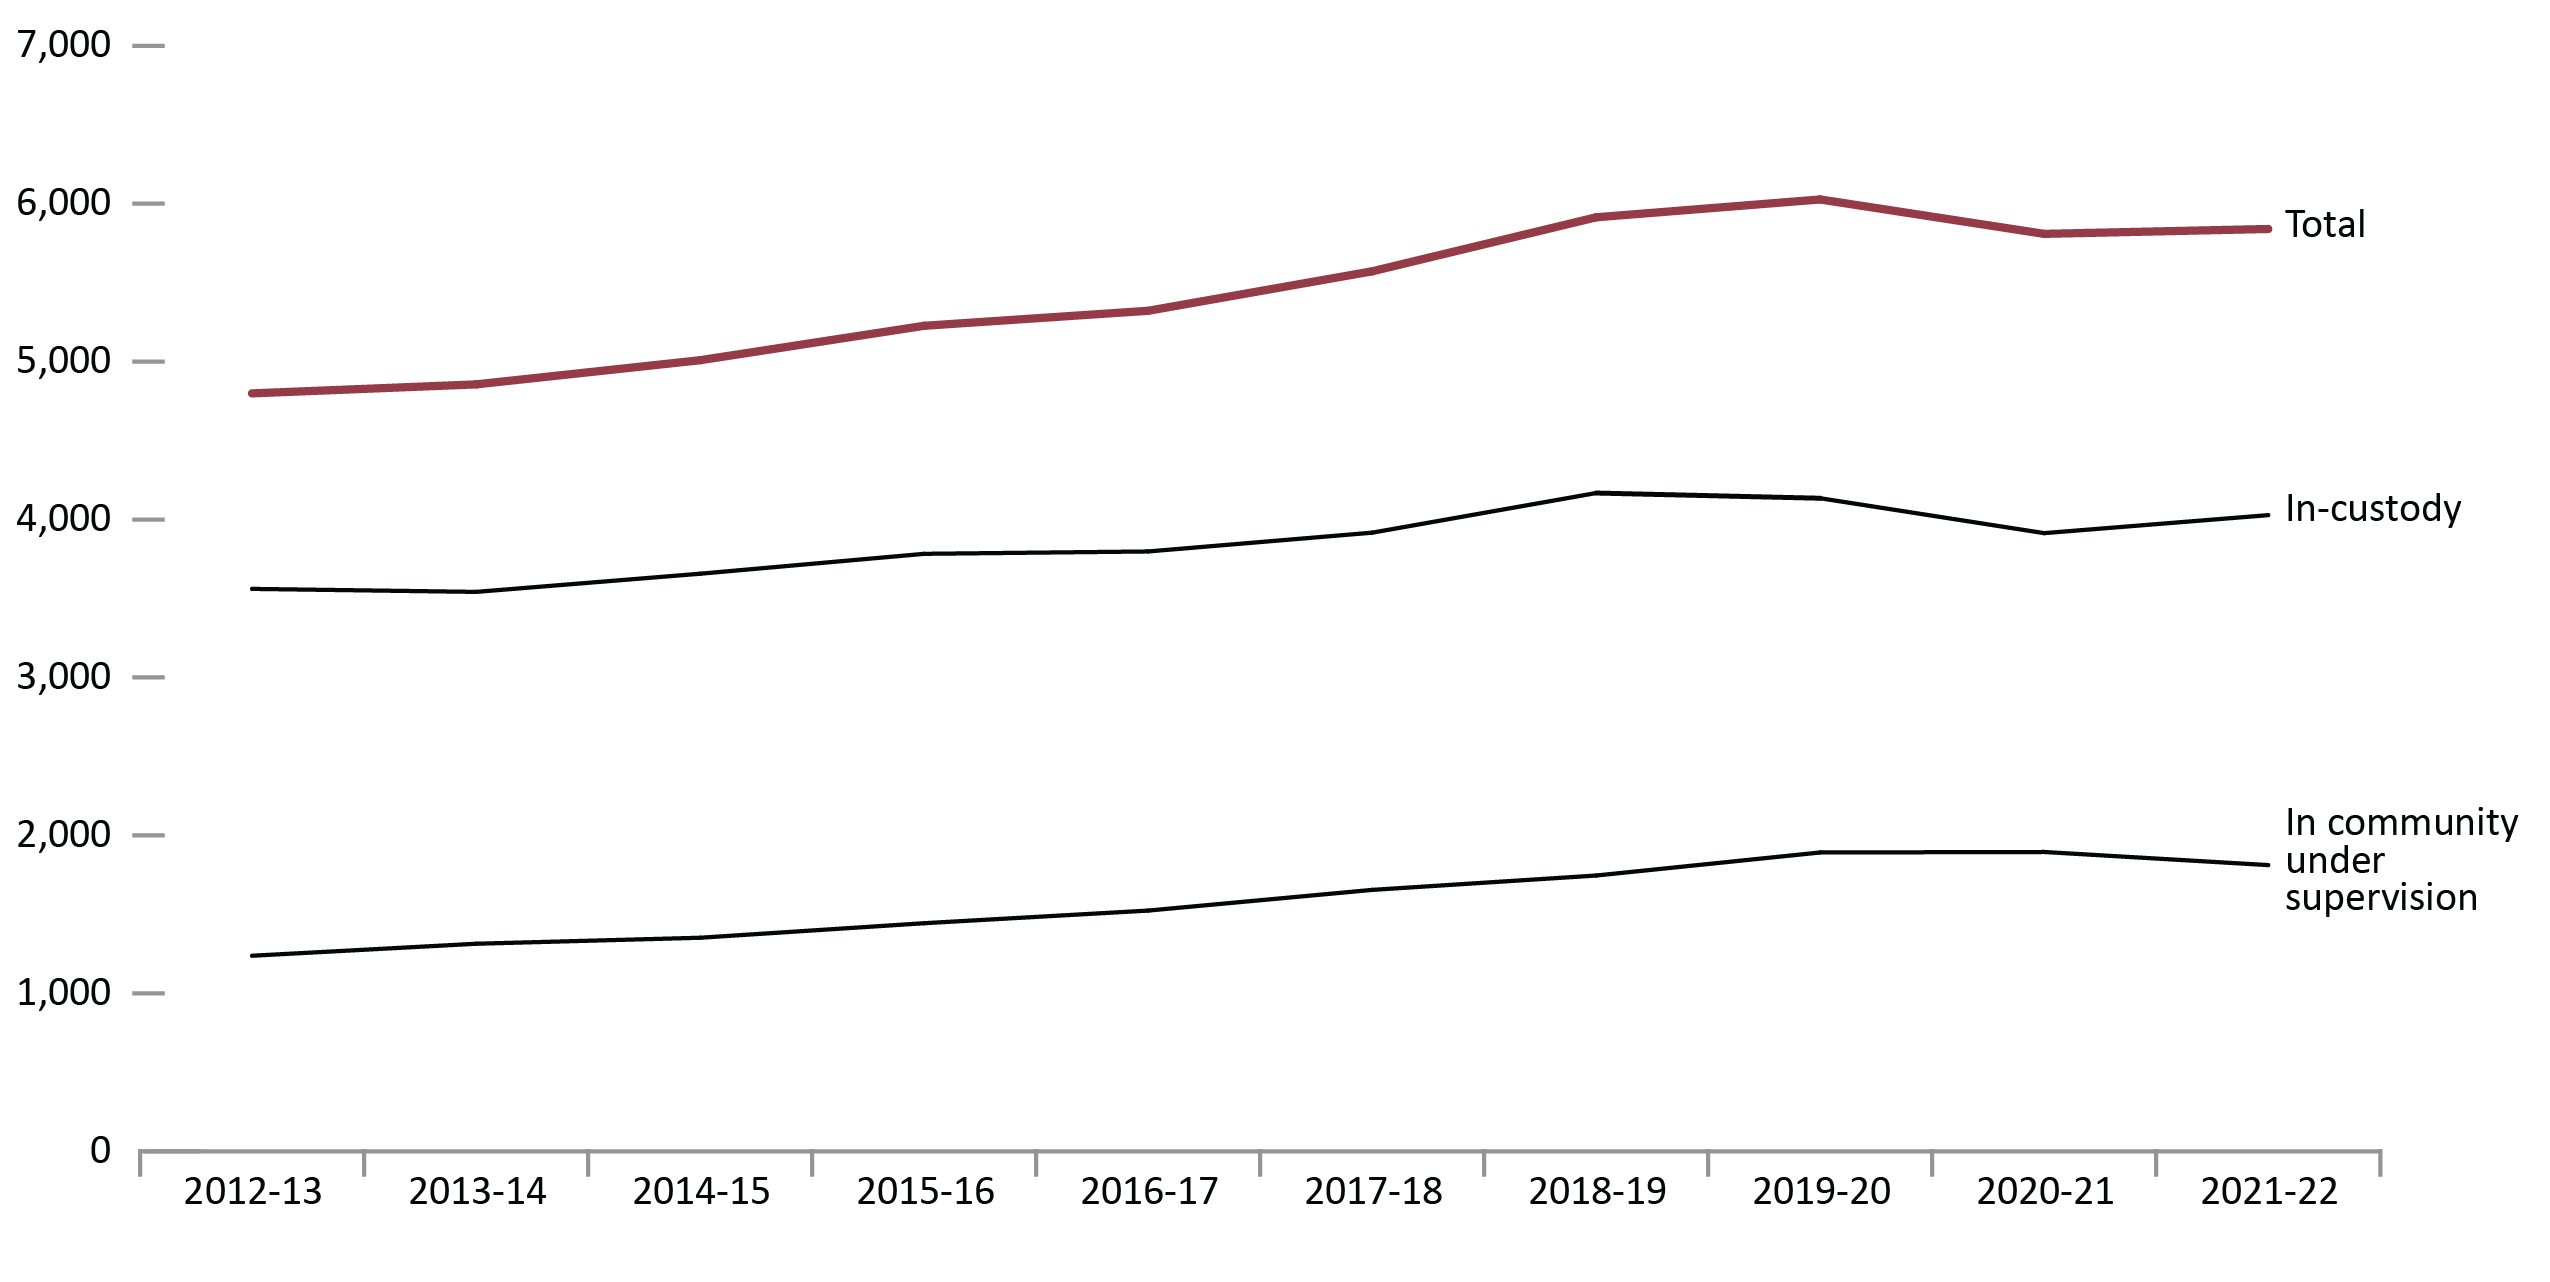
Image description
Line graph showing the Indigenous offender population under the responsibility of the Correctional Service Canada between fiscal years 2012 to 2013 and 2021 to 2022. The total Indigenous offender population rose steadily from just under 5,000 offenders in fiscal year 2012 to 2013 to a peak of 6,027 offenders in fiscal year 2019 to 2020, then dropping gradually to 5,840 offenders in fiscal year 2021 to 2022. Indigenous in-custody offenders rose steadily from around 3,600 offenders in fiscal year 2012 to 2013 to a peak of 4,168 offenders in fiscal year 2018 to 2019, dropping to 3,914 offenders in fiscal year 2020 to 2021, and then increasing to 4,028 offenders in 2021 to 2022. Indigenous in community under supervision offenders rose gradually from just over 1,000 offenders in fiscal year 2012 to 2013 to a peak of 1,895 offenders in fiscal year 2020 to 2021, and then decreasing slightly to 1,812 offenders in 2021 to 2022. Full data are available immediately below.
Source: Correctional Service of Canada.
- From 2012-13 to 2021-22, the in-custody Indigenous offender population increased by 13.1%, while the total Indigenous offender population increased 21.7% over the same period of time.
- The number of in-custody Indigenous female offenders increased steadily from 203 in 2012-13 to 291 in 2021-22, representing an increase of 43.3%. The increase for in-custody Indigenous male offenders was 11.3% for the same period, increasing from 3,358 to 3,737.
- From 2012-13 to 2021-22 the number of Indigenous offenders on community supervision increased 46.4%, from 1,238 to 1,812. The Indigenous community population accounted for 21.4% of the total community population in 2021-22.
Figure C21 Notes
Total Offender Population includes all active offenders who are incarcerated in a CSC facility, offenders on temporary absence from a CSC facility, offenders who are temporarily detained, offenders who are actively supervised, and offenders who are unlawfully at large for less than 90 days.
In Custody includes all active offenders incarcerated in a CSC facility, offenders on temporary absence from a CSC facility, offenders who are temporarily detained in a CSC facility and offenders on remand in a CSC facility.
In Community Under Supervision includes all active offenders on day parole, full parole, statutory release, or in the community supervised on a long-term supervision order, offenders who are temporarily detained in a non-CSC facility, offenders who are unlawfully at large for less than 90 days, offenders on remand in a non-CSC facility, and offenders supervised and subject to an immigration hold by Canada Border Services Agency.
Regional statistics for the Correctional Service of Canada account for data relating to the northern territories in the following manner: data for Nunavut are reported in the Ontario Region, data for the Northwest Territories are reported in the Prairies Region, and data for the Yukon Territories are reported in the Pacific Region.
Reported year periods reflect fiscal years. A fiscal year runs from April 1 to March 31 of the following year.
| Indigenous offenders | Fiscal year | |||||
|---|---|---|---|---|---|---|
| 2017-18 | 2018-19 | 2019-20 | 2020-21 | 2021-22 | ||
| In custody | ||||||
| Atlantic Region | Male | 184 | 224 | 234 | 211 | 208 |
| Female | 14 | 19 | 18 | 25 | 19 | |
| Another sex | NR | NR | 0 | 0 | 0 | |
| Quebec Region | Male | 392 | 449 | 370 | 352 | 389 |
| Female | 11 | 16 | 13 | 14 | 19 | |
| Another sex | NR | NR | 0 | 0 | 0 | |
| Ontario Region | Male | 534 | 558 | 612 | 528 | 606 |
| Female | 43 | 50 | 49 | 53 | 60 | |
| Another sex | NR | NR | 0 | 0 | 0 | |
| Prairie Region | Male | 1,879 | 1,955 | 1,968 | 1,925 | 1,943 |
| Female | 163 | 158 | 152 | 127 | 156 | |
| Another sex | NR | NR | 0 | 0 | 0 | |
| Pacific Region | Male | 658 | 691 | 671 | 630 | 591 |
| Female | 39 | 48 | 47 | 48 | 37 | |
| Another sex | NR | NR | 1 | 1 | 0 | |
| National total | Male | 3,647 | 3,877 | 3,855 | 3,646 | 3,737 |
| Female | 270 | 291 | 279 | 267 | 291 | |
| Another sex | NR | NR | 1 | 1 | 0 | |
| Total | 3,917 | 4,168 | 4,135 | 3,914 | 4,028 | |
| In community under supervision | ||||||
| Atlantic Region | Male | 88 | 83 | 106 | 97 | 99 |
| Female | 9 | 10 | 13 | 13 | 10 | |
| Another sex | NR | NR | 0 | 0 | 0 | |
| Quebec Region | Male | 181 | 162 | 182 | 182 | 150 |
| Female | 6 | 9 | 8 | 9 | 6 | |
| Another sex | NR | NR | 0 | 0 | 0 | |
| Ontario Region | Male | 231 | 239 | 277 | 291 | 304 |
| Female | 29 | 31 | 28 | 34 | 39 | |
| Another sex | NR | NR | 0 | 0 | 0 | |
| Prairie Region | Male | 645 | 720 | 750 | 756 | 687 |
| Female | 111 | 113 | 119 | 123 | 103 | |
| Another sex | NR | NR | 0 | 0 | 0 | |
| Pacific Region | Male | 319 | 344 | 369 | 352 | 373 |
| Female | 36 | 35 | 40 | 38 | 41 | |
| Another sex | NR | NR | 0 | 0 | 0 | |
| National total | Male | 1,464 | 1,548 | 1,684 | 1,678 | 1,613 |
| Female | 191 | 198 | 208 | 217 | 199 | |
| Another sex | NR | NR | 0 | 0 | 0 | |
| Total | 1,655 | 1,746 | 1,892 | 1,895 | 1,812 | |
| Total offender population | 5,572 | 5,914 | 6,027 | 5,809 | 5,840 | |
Source: Correctional Service of Canada.
Table C21 Notes
Results for “Another sex” were unavailable prior to 2019-20. “Not reported” is abbreviated to “NR” in this table due to formatting.
Total Offender Population includes all active offenders who are incarcerated in a CSC facility, offenders on temporary absence from a CSC facility, offenders who are temporarily detained, offenders who are actively supervised, and offenders who are unlawfully at large for less than 90 days.
In Custody includes all active offenders incarcerated in a CSC facility, offenders on temporary absence from a CSC facility, offenders who are temporarily detained in a CSC facility and offenders on remand in a CSC facility.
In Community Under Supervision includes all active offenders on day parole, full parole, statutory release, or in the community supervised on a long-term supervision order, offenders who are temporarily detained in a non-CSC facility, offenders who are unlawfully at large for less than 90 days, offenders on remand in a non-CSC facility, and offenders supervised and subject to an immigration hold by Canada Border Services Agency.
Regional statistics for the Correctional Service of Canada account for data relating to the northern territories in the following manner: data for Nunavut are reported in the Ontario Region, data for the Northwest Territories are reported in the Prairies Region, and data for the Yukon Territories are reported in the Pacific Region.
Reported year periods reflect fiscal years. A fiscal year runs from April 1 to March 31 of the following year.
Number of authorizations for transfer to Structured Intervention Units in federal institutions
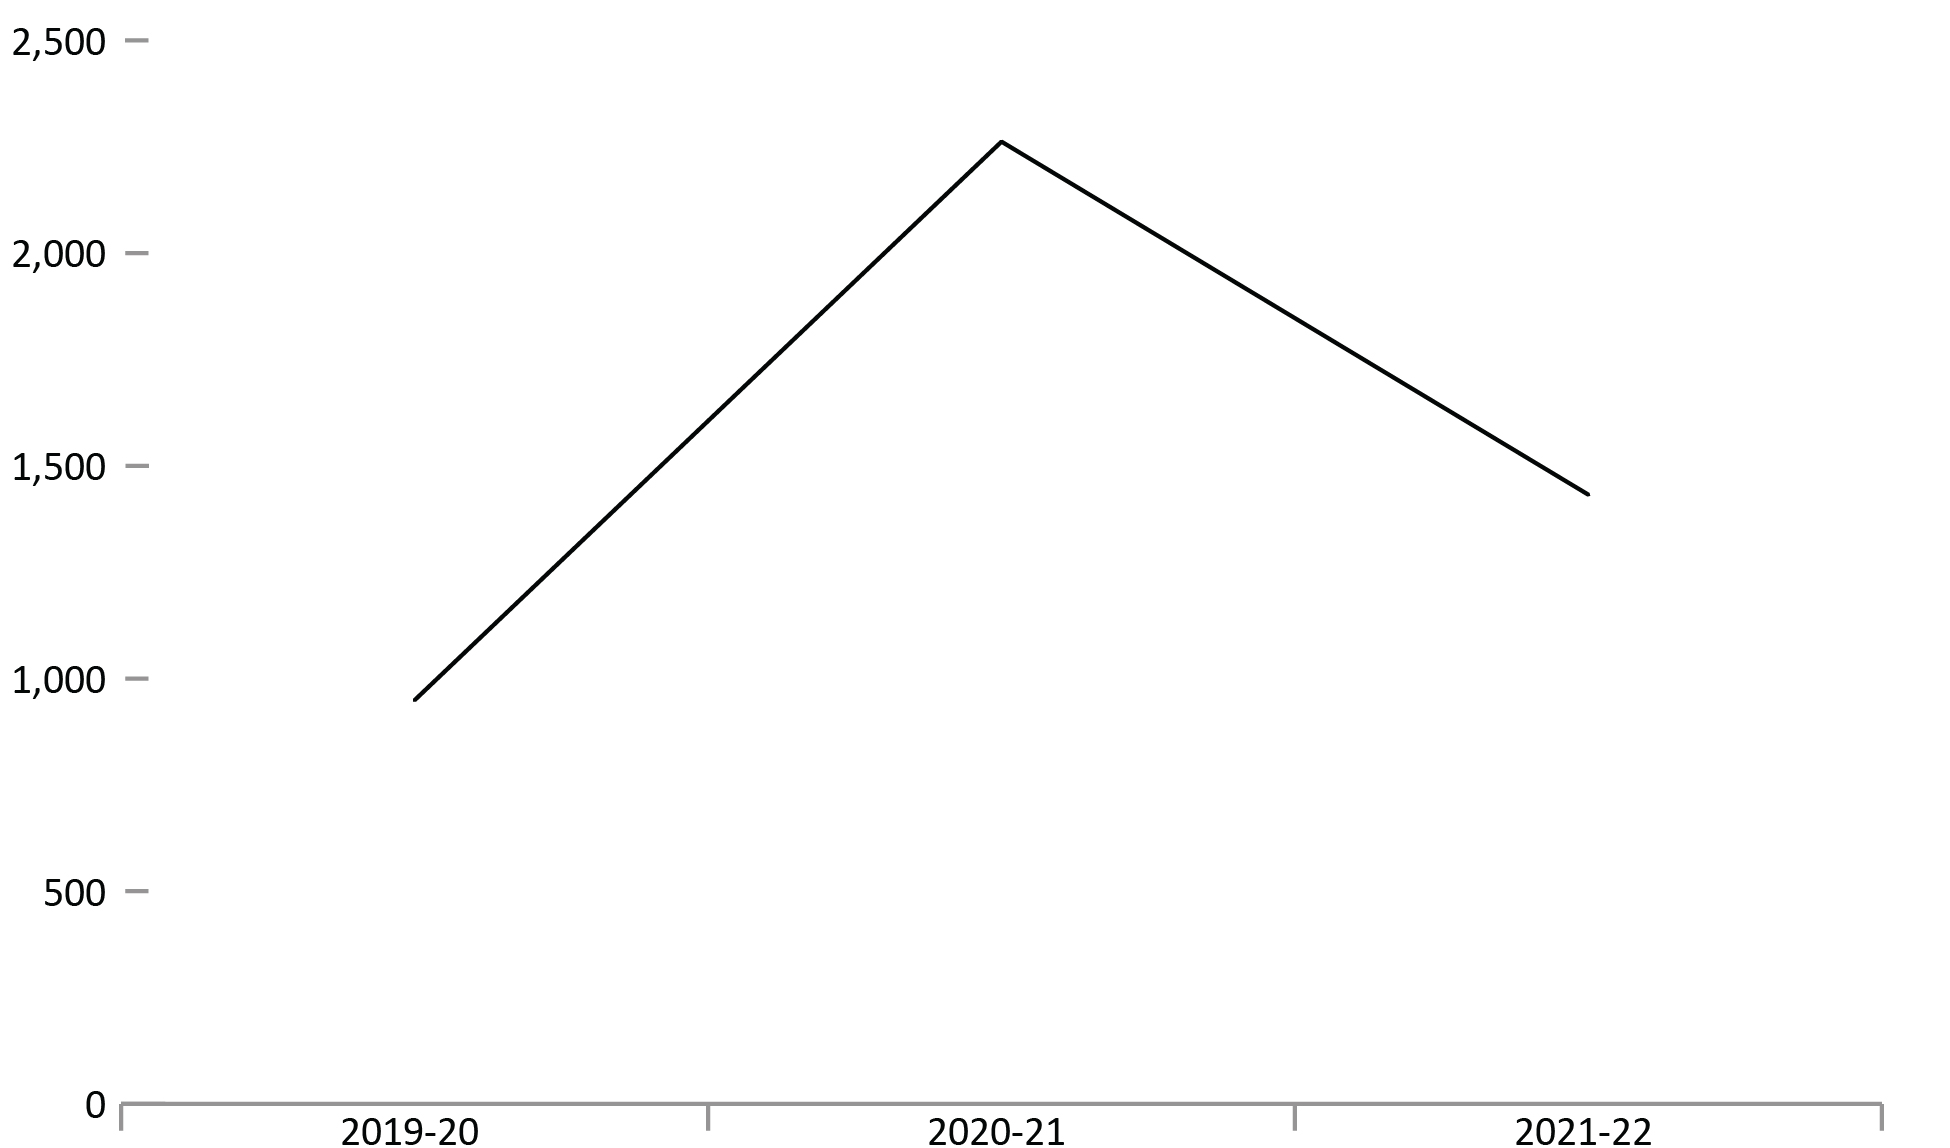
Image description
Line graph showing the number of authorizations for transfer to Structured Intervention Units in a federal institution from fiscal year 2019 to 2020 until fiscal year 2021 to 2021. The number of authorizations increased from 949 authorizations in fiscal year 2019 to 2020 to a peak of 2,262 authorizations in fiscal year 2020 to 2021, then decreasing to 1,432 authorizations in fiscal year 2021 to 2022. Full data are available immediately below.
Source: Correctional Service of Canada.
- The number of authorizations for transfer to Structured Intervention Units in federal institutions has fluctuated over the past 3 years. In fiscal year 2021-22, there were 1,432 authorizations for transfer to a Structured Intervention Unit, which is a 36.7% decrease (from 2,262 to 1,432) compared to the previous fiscal year.
Figure C22 Notes
Reported year periods reflect fiscal years. A fiscal year runs from April 1 to March 31 of the following year.
Figure C22 in the 2021 CCRSO includes data on administrative segregation. Changes to the Corrections and Conditional Release Act abolished administrative segregation as of November 30, 2019.
| Fiscal year | Total |
|---|---|
| 2019-20 | 949 |
| 2020-21 | 2,262 |
| 2021-22 | 1,432 |
Source: Correctional Service of Canada.
Table C22 Notes
Reported year periods reflect fiscal years. A fiscal year runs from April 1 to March 31 of the following year.
Table C22 in the 2021 CCRSO includes data on administrative segregation. Changes to the Corrections and Conditional Release Act abolished administrative segregation as of November 30, 2019.
Percentage of successful transfers out of Structured Intervention Units in federal institutions
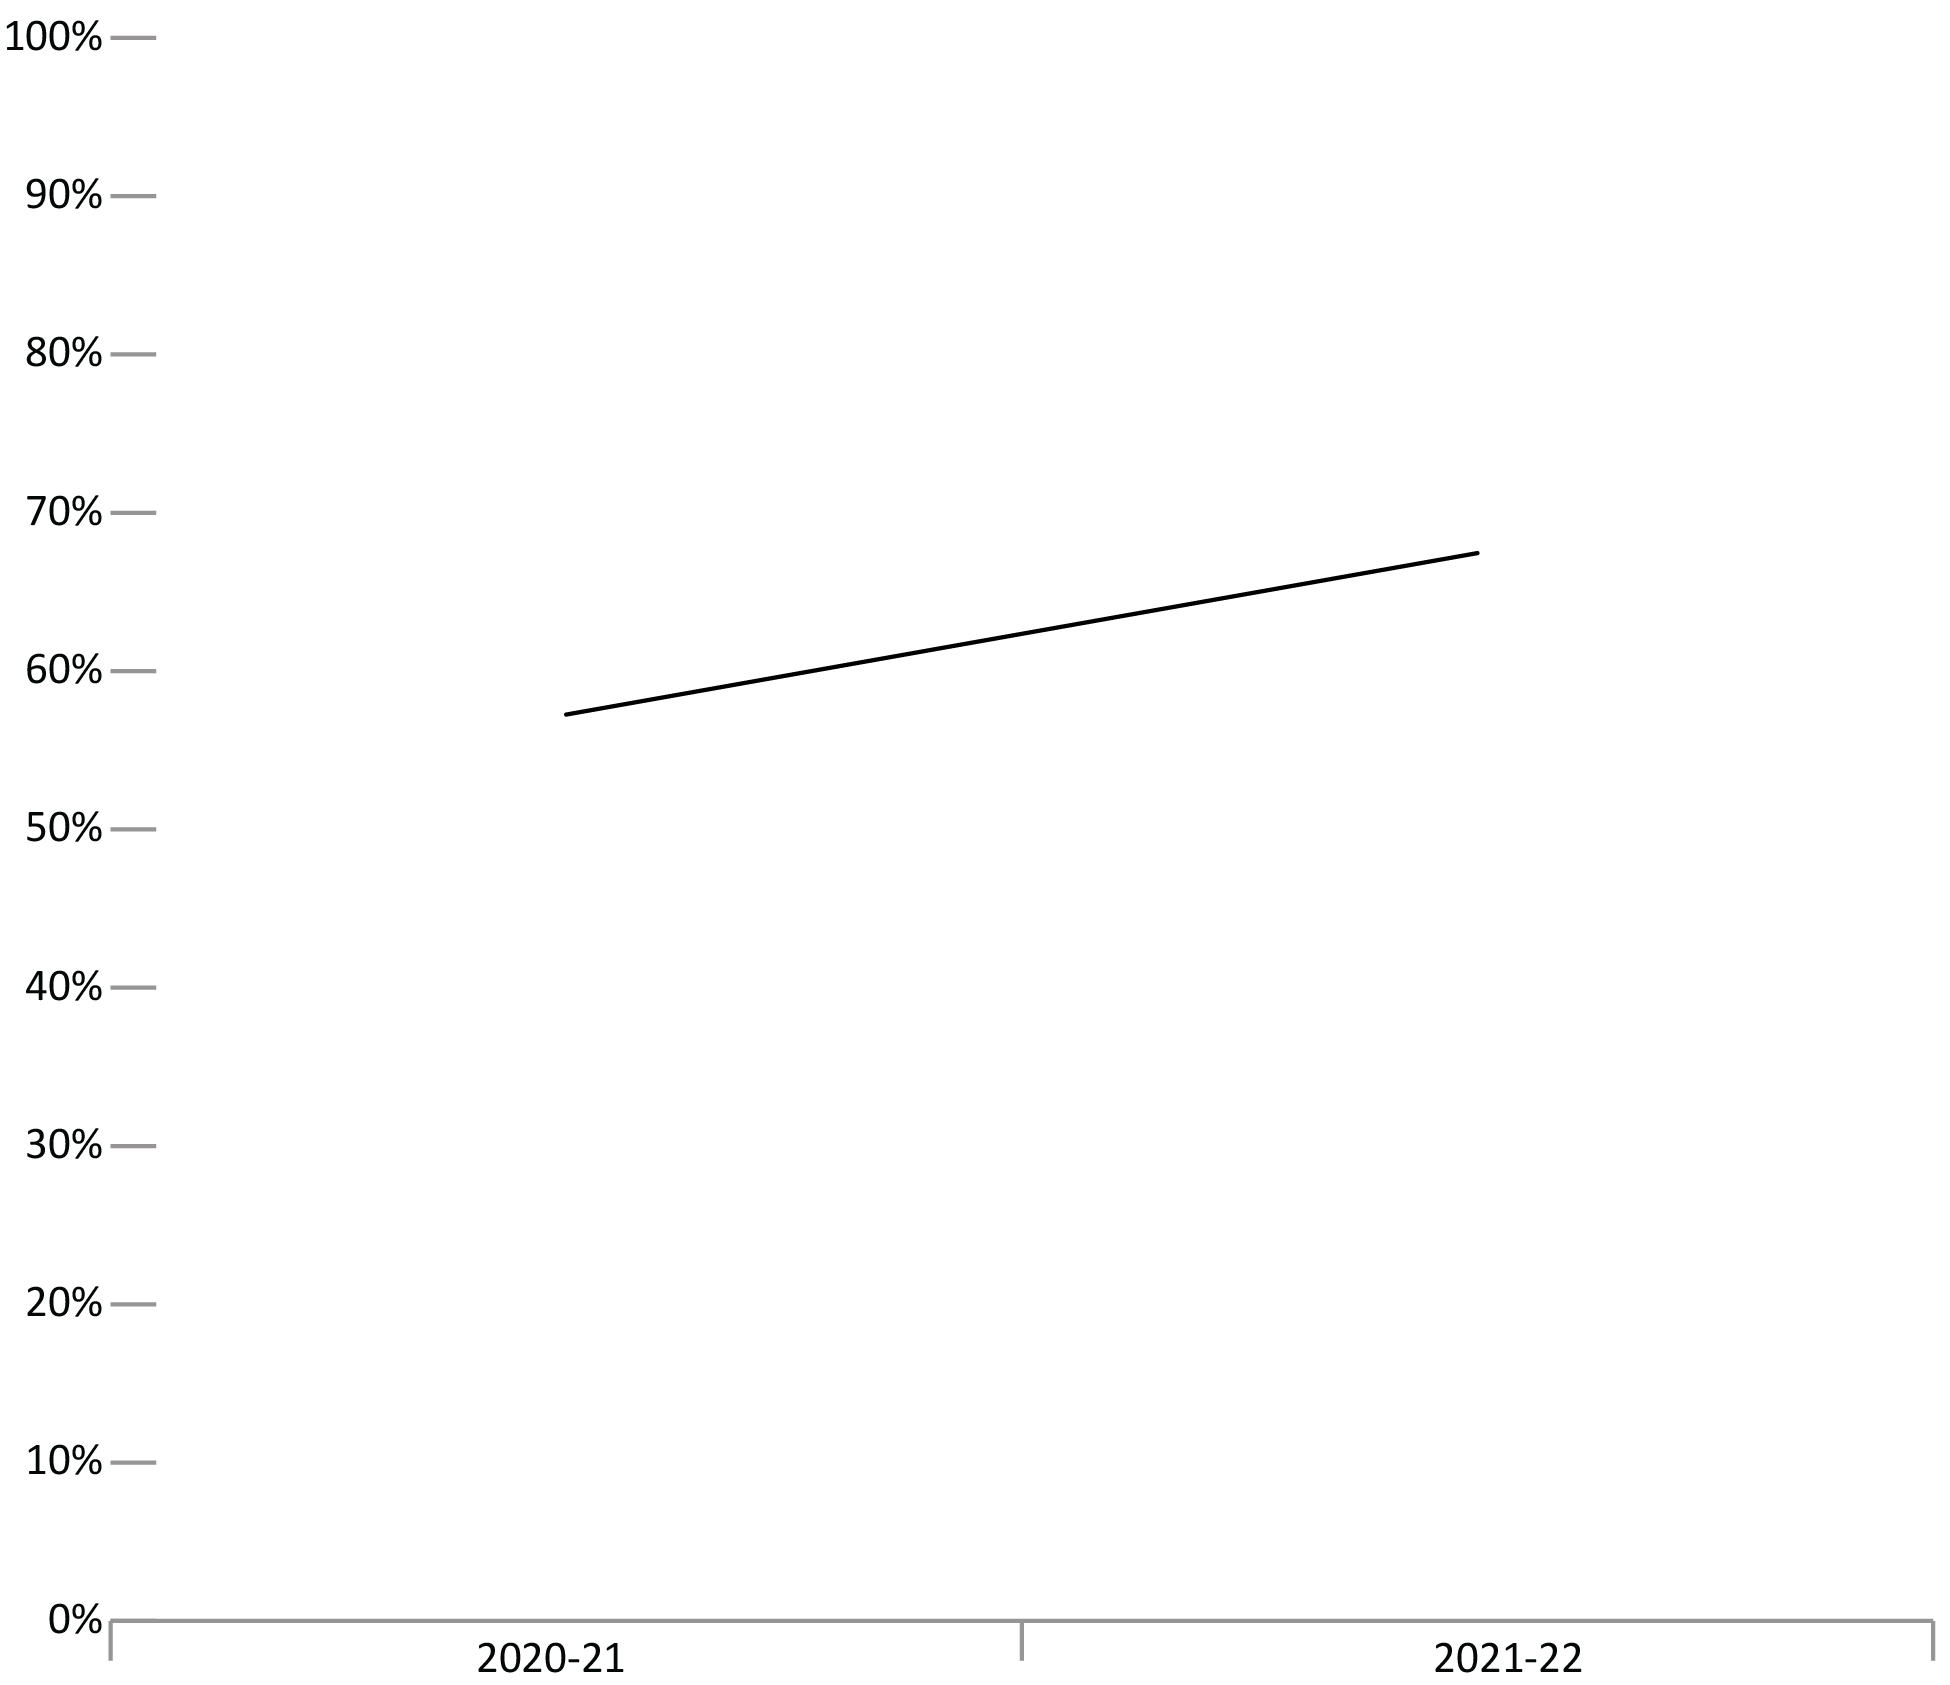
Image description
Line graph showing the percentage of successful transfers out of Structured Intervention Units between fiscal years 2020 to 2021 and 2021 to 2022. Transfers increased from 56.3 percent in fiscal year 2020 to 2021 to 66.4 percent in fiscal year 2021 to 2022. Full data are available immediately below.
Source: Correctional Service of Canada.
- Of the 1,732 transfers out of a Structured Intervention Unit in 2021-22, 66.4% were successful.
Figure C23 Notes
A transfer out of Structured Intervention Units is successful if the inmate remains in mainstream population for a period of 120 days.
Reported year periods reflect a fiscal year. A fiscal year runs from April 1 to March 31 of the following year.
Figure C23 in the 2022 CCRSO includes data on administrative segregation. Changes to the Corrections and Conditional Release Act abolished administrative segregation as of November 30, 2019.
| Fiscal year | Successful transfer count | Unsuccessful transfer count | Total transfer count | |||
|---|---|---|---|---|---|---|
| # | % | # | % | # | % | |
| 2020-21 | 1,286 | 56.2 | 1,004 | 43.8 | 2,290 | 100.0 |
| 2021-22 | 1,150 | 66.4 | 582 | 33.6 | 1,732 | 100.0 |
Source: Correctional Service of Canada.
Table C23 Notes
A transfer out of Structured Intervention Units is successful if the inmate remains in mainstream population for a period of 120 days.
Reported year periods reflect fiscal years. A fiscal year runs from April 1 to March 31 of the following year.
Table C23 in the 2022 CCRSO includes data on administrative segregation. Changes to the Corrections and Conditional Release Act abolished administrative segregation as of November 30, 2019.
Number of offender deaths while in custody: 10-year trend
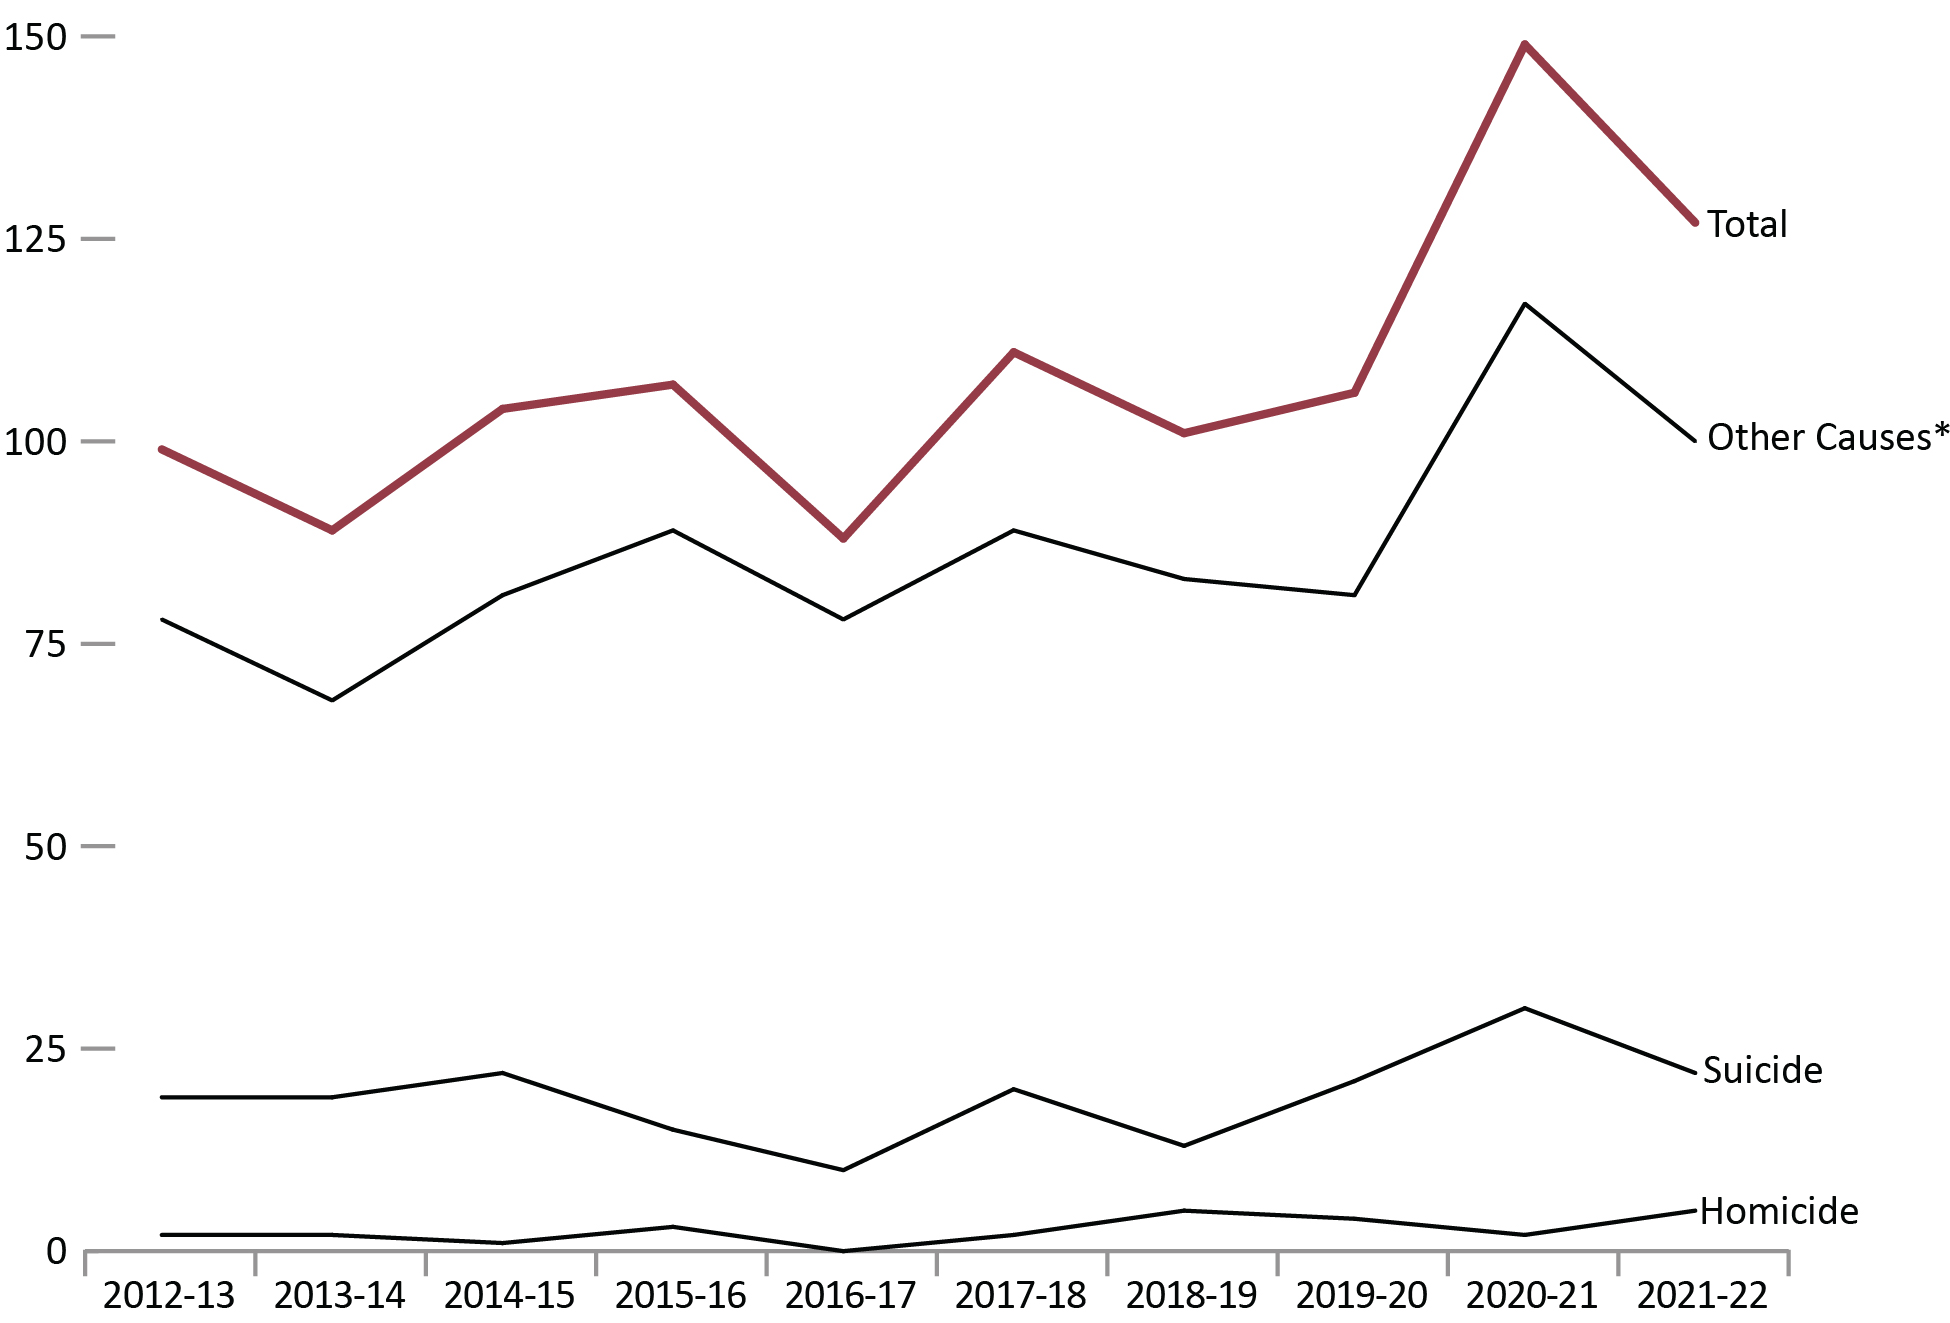
Image description
Line graph showing the number of offender deaths while in the custody of federal and provincial/territorial correctional systems by cause of death from fiscal year 2012 to 2013 until fiscal year 2021 to 2022. The total number of deaths fluctuate between 88 deaths to 111 deaths between fiscal year 2012 to 2013 and fiscal year 2019 to 2020, then rising to a peak of 149 deaths in fiscal year 2020 to 2021, and dropping to 127 deaths in fiscal year 2021 to 2022. Causes of death classified as “Other” closely match the overall trend in offender deaths in custody because they are by far the most common cause of offender deaths. Starting at 78 deaths in fiscal year 2012 to 2013, erratically moving upward and downward most years, which forms a trend of gradual increase until the fiscal year 2020 to 2021 when there was a large jump in the number of deaths in this category to 117 deaths for that year, and a slight decline to 100 deaths in 2021 to 2022 fiscal year. Suicide accounted for less than 25 deaths per year until fiscal year 2020 to 2021 when it jumped to 30 deaths. Years with the lowest numbers of suicide were fiscal years 2016 to 2017 and fiscal year 2018 to 2019. Homicide accounted for the fewest amount of deaths, at less than 5 per year and remained consistent over the 10 year period. Full data are available immediately below.
Source: Adult Correctional Services Survey, Canadian Centre for Justice and Community Safety Statistics, Statistics Canada.
- In the 10-year period from 2012-13 to 2021-22, a total of 578 federal offenders and 503 provincial/territorial offenders died while in custody. During this time period, suicides accounted for 14.2% of federal offender deaths and 21.7% of provincial offender deaths. The suicide rateFootnote * was approximately 58 per 100,000 for incarcerated federal offenders, and approximately 47 per 100,000 for incarcerated provincial offenders.
- Between 2012-13 and 2021-22, 3.8% of federal offender deaths and 2.4% of provincial offender deaths were due to homicide. The homicide rate for incarcerated federal offenders was approximately 16 per 100,000 and 2 per 100,000 for incarcerated provincial offenders.
| Fiscal year | Homicide | Suicide | Other causesFootnote * | Total | |||
|---|---|---|---|---|---|---|---|
| Federal | # | % | # | % | # | % | # |
2012-13 |
1 | 1.8 | 11 | 20.0 | 43 | 78.2 | 55 |
2013-14 |
1 | 2.1 | 9 | 18.8 | 38 | 79.2 | 48 |
2014-15 |
1 | 1.5 | 13 | 19.4 | 53 | 79.1 | 67 |
2015-16 |
3 | 4.6 | 9 | 13.8 | 53 | 81.5 | 65 |
2016-17 |
0 | 0.0 | 3 | 6.4 | 44 | 93.6 | 47 |
2017-18 |
2 | 3.6 | 6 | 10.9 | 47 | 85.5 | 55 |
2018-19 |
5 | 9.8 | 6 | 11.8 | 40 | 78.4 | 51 |
2019-20 |
4 | 6.5 | 11 | 17.7 | 47 | 75.8 | 62 |
2020-21 |
1 | 1.4 | 6 | 8.7 | 62 | 89.9 | 69 |
2021-22 |
4 | 6.8 | 8 | 13.6 | 47 | 79.7 | 59 |
Total |
22 | 3.8 | 82 | 14.2 | 474 | 82.0 | 578 |
| Provincial and territories | # | % | # | % | # | % | # |
2012-13 |
1 | 2.3 | 8 | 18.2 | 35 | 79.5 | 44 |
2013-14 |
1 | 2.4 | 10 | 24.4 | 30 | 73.2 | 41 |
2014-15 |
0 | 0.0 | 9 | 24.3 | 28 | 75.7 | 37 |
2015-16 |
0 | 0.0 | 6 | 14.3 | 36 | 85.7 | 42 |
2016-17 |
0 | 0.0 | 7 | 17.1 | 34 | 82.9 | 41 |
2017-18 |
0 | 0.0 | 14 | 25.0 | 42 | 75.0 | 56 |
2018-19 |
0 | 0.0 | 7 | 14.0 | 43 | 86.0 | 50 |
2019-20 |
0 | 0.0 | 10 | 22.7 | 34 | 77.3 | 44 |
2020-21 |
1 | 1.3 | 24 | 30.0 | 55 | 68.8 | 80 |
2021-22 |
1 | 1.5 | 14 | 20.6 | 53 | 77.9 | 68 |
Total |
4 | 0.8 | 109 | 21.7 | 390 | 77.5 | 503 |
| Total federal and provincial/territorial offender deaths | 26 | 2.4 | 191 | 17.7 | 864 | 79.9 | 1,081 |
Source: Adult Correctional Services Survey, Canadian Centre for Justice and Community Safety Statistics, Statistics Canada.
The number of escapees from federal institutions: 10-year trend
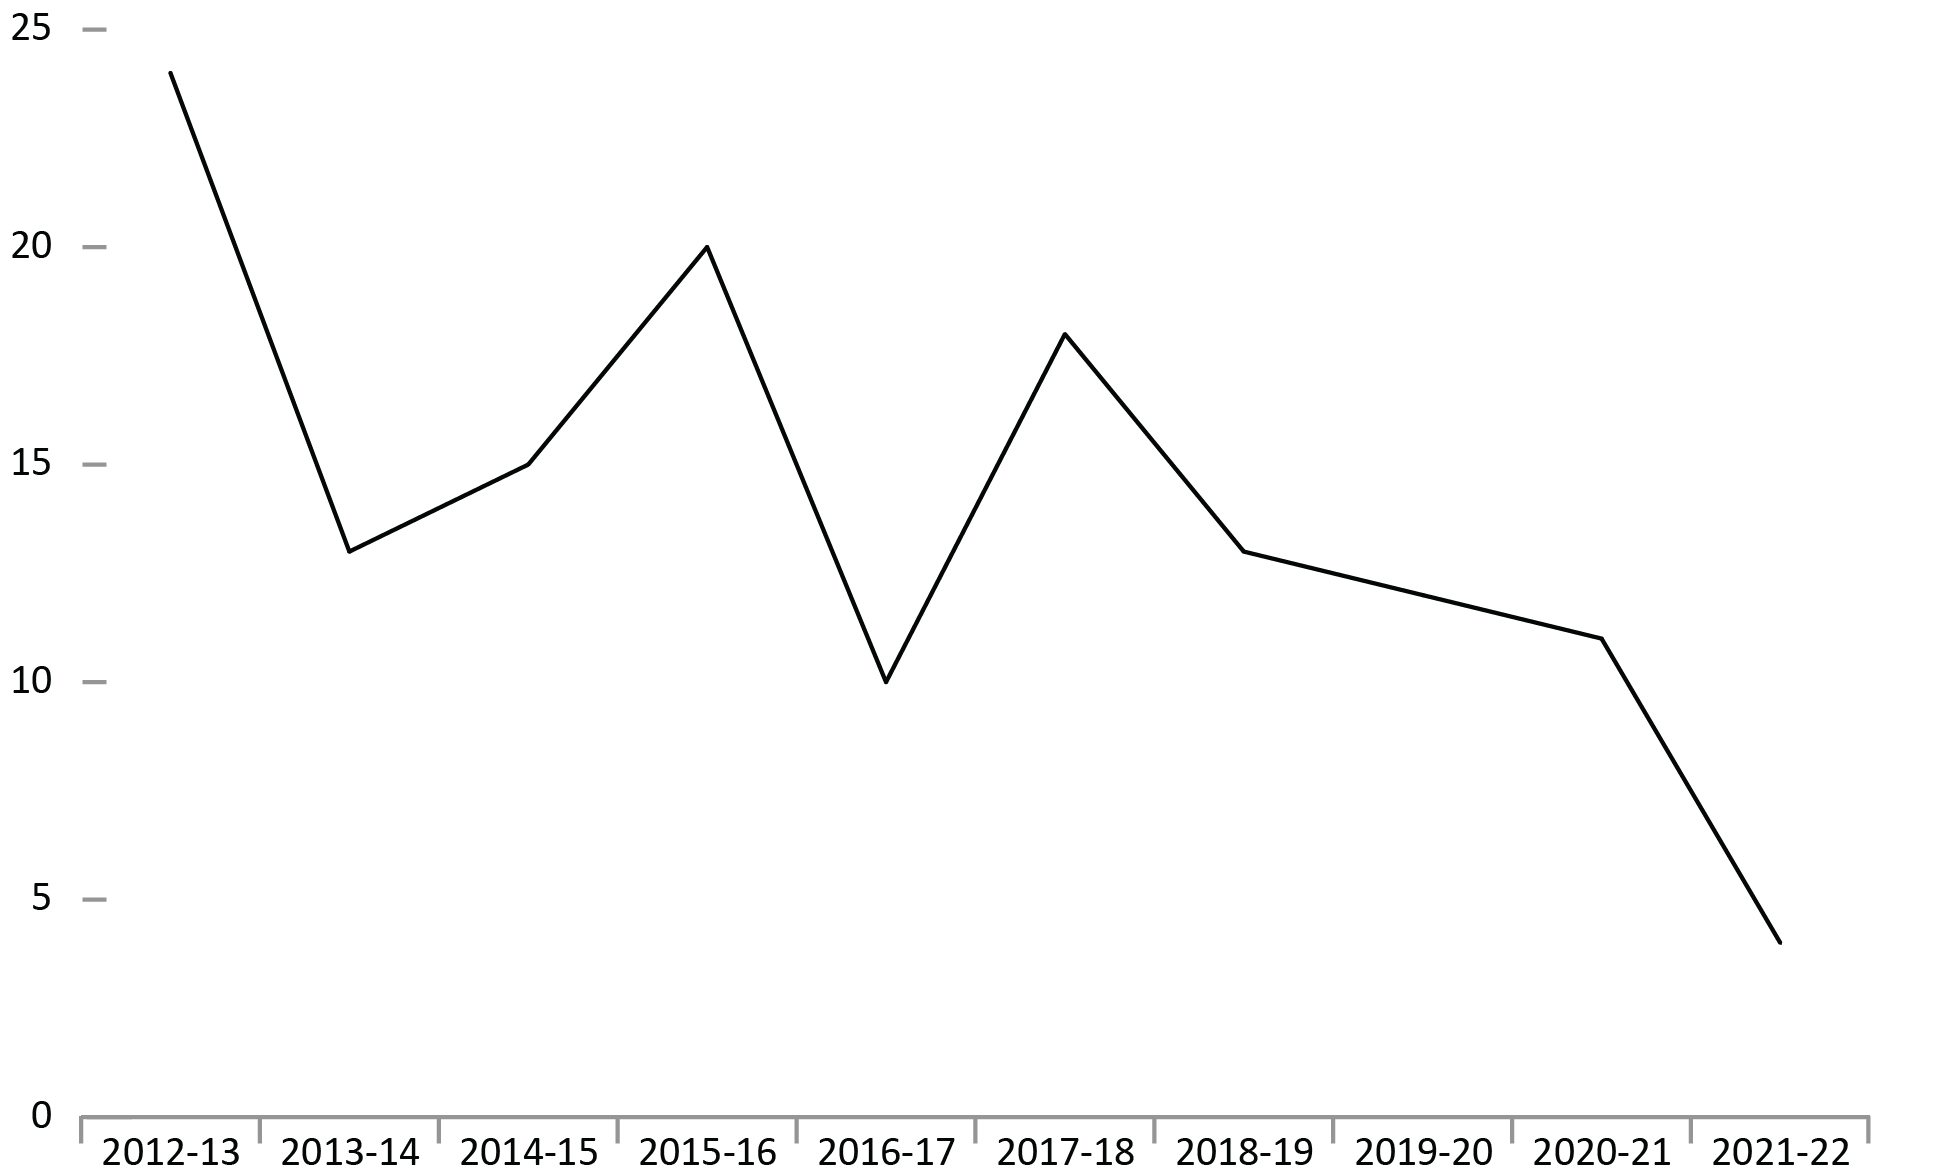
Image description
Line graph showing the number of escapees from federal institutions from fiscal year 2012 to 2013 until fiscal year 2021 to 2022. This trend rose and fell erratically over the 10-year period with its peaks in 2012 to 2013, 2015 to 2016, and 2017 to 2018, and lowest points in 2011 to 2012, 2013 to 2014, 2016 to 2017, 2020 to 2021, and 2021 to 2022. Overall, there is a gradual decline from 24 escapees in fiscal year 2012 to 2013 to 4 escapees in fiscal year 2021 to 2022. Full data are available immediately below.
Source: Correctional Service of Canada.
- In 2021-22, there were 4 escape incidents involving a total of 4 offenders. 3 of the 4 offenders were recaptured at the time of data extraction.
- Offenders who escaped from federal institutions or Healing Lodges in 2021-22 represented 0.03% of the in-custody population.
- Over the past 10 years, the number of escapees from federal institutions decreased 83.3% from 24 in 2012-13 to 4 in 2021-22.
Figure C25 Notes
The data represent the number of escape incidents from federal facilities or Healing Lodges during each fiscal year. An escape can involve more than 1 offender.
These numbers are subject to change further to new information becoming available.
Reported year periods reflect fiscal years. A fiscal year runs from April 1 to March 31 of the following year.
| Fiscal year | Total number of escape incidents | Total number of escapees |
|---|---|---|
| 2012-13 | 18 | 24 |
| 2013-14 | 11 | 13 |
| 2014-15 | 14 | 15 |
| 2015-16 | 17 | 20 |
| 2016-17 | 10 | 10 |
| 2017-18 | 14 | 18 |
| 2018-19 | 13 | 13 |
| 2019-20 | 10 | 12 |
| 2020-21 | 11 | 11 |
| 2021-22 | 4 | 4 |
| Total number of escape incidents and escapees | 122 | 140 |
Source: Correctional Service of Canada.
Table C25 Notes
The data represent the number of escape incidents from federal facilities or Healing Lodges during each fiscal year. An escape can involve more than 1 offender.
These numbers are subject to change further to new information becoming available.
Reported year periods reflect fiscal years. A fiscal year runs from April 1 to March 31 of the following year.
CSC offenders in community under supervision: 10-year trend
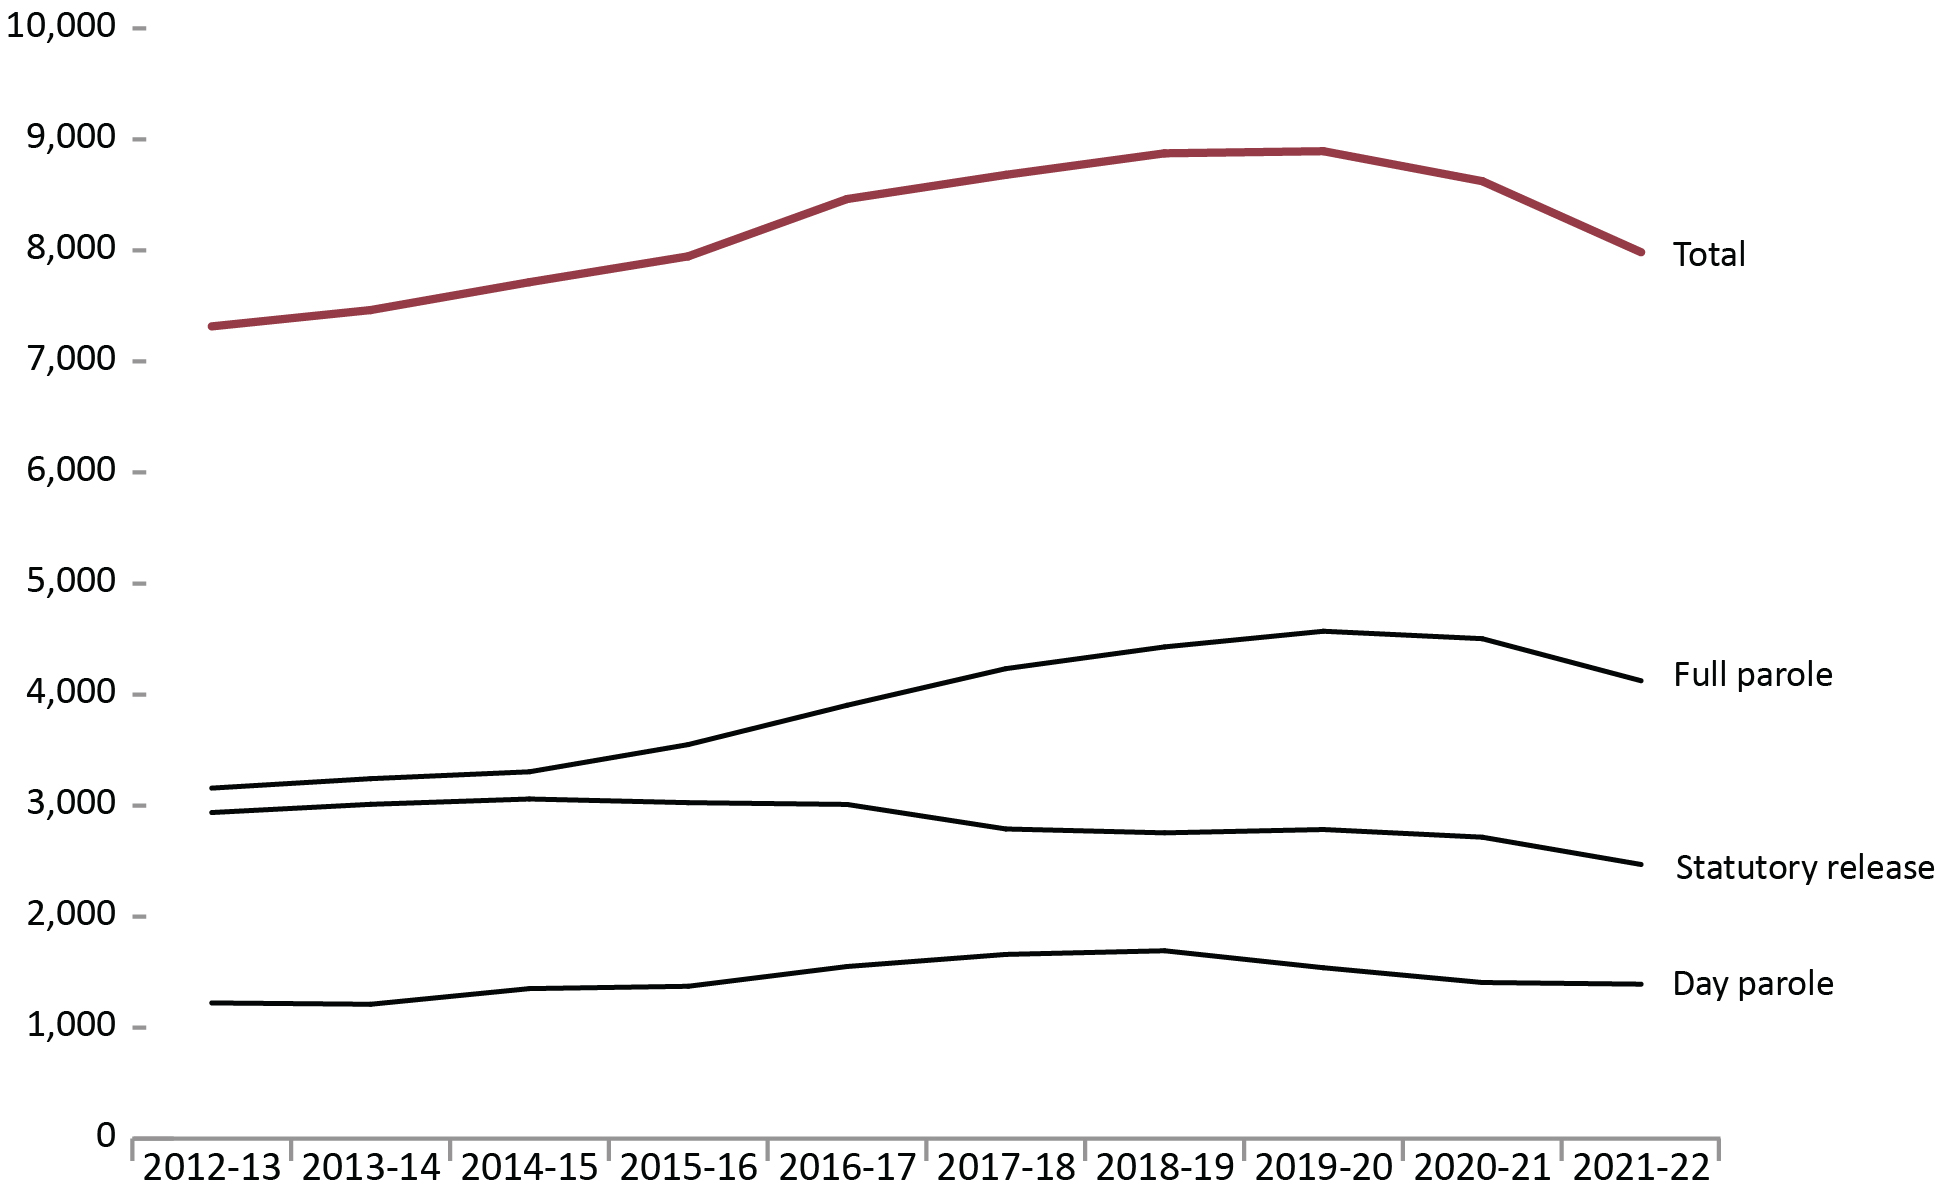
Image description
Line graph showing the in population of Correctional Service Canada offenders in community under supervision at fiscal year-end for the fiscal years 2012 to 2013 until 2021 to 2022. The total population rises from 7,316 offenders in fiscal year 2012 to 2013 to a peak 8,894 offenders in fiscal year 2019 to 2020, and dropping slightly to 7,984 offenders in fiscal year 2021 to 2022. Full parole follows a similar trend, going from 3,157 offenders in fiscal year 2012 to 2013 to a peak of 4,570 offenders in fiscal year 2019 to 2020, then dropping to 4,124 offenders in fiscal year 2021 to 2022. Followed by statutory release, which rose from 2,937 offenders in fiscal year 2012 to 2013 to a peak of 3,059 offenders in fiscal year 2014 to 2015, then remaining relatively stable until a drop after fiscal year 2016 to 2017 which continued until fiscal year 2021 to 2022 with 2,469 offenders. Day parole had the lowest number of offenders, gradually increasing from 1,222 in fiscal year 2012 to 2013 until its peak in fiscal year 2018 to 2019 at 1,692 offenders, then decreasing gradually to 1,391 offenders in fiscal year 2021 to 2022. Full data are available immediately below.
Source: Correctional Service of Canada.
- Over the past 5 years (from 2017-18 to 2021-22), the total offender population supervised in the community decreased by 8.0%. For the same period, the total number of offenders on full parole decreased by 2.6% while the proportion of offenders on statutory release decreased by 11.5%. At the end of fiscal year 2021-22, there were 7,350 males and 635 females on active community supervision.
- Over the past 10 years (from 2012-13 to 2021-22), the total offender population supervised in the community increased by 9.1%. For the same period, the total number of offenders on full parole increased by 30.6% and the proportion of offenders on statutory release decreased by 15.9%.
Figure C26 Notes
The data reflect the offender population in the community under supervision, which includes all active offenders on day parole, full parole, statutory release, offenders who are temporarily detained in a non-CSC facility, offenders who are unlawfully at large for less than 90 days, offenders on remand in a non-CSC facility, and offenders supervised and subject to an immigration hold by Canada Border Services Agency.
The data presented above do not include offenders who were on long-term supervision orders (See Figure/Table E4).
As a result of a data quality issue, supervision information on 1 offender was not available at the time of the data extraction.
Day parole is a type of conditional release granted by the Parole Board of Canada whereby offenders are permitted to participate in community-based activities in preparation for full parole or statutory release. The conditions require offenders to return nightly to an institution or half-way house unless otherwise authorized by the Parole Board of Canada.
Full parole is a type of conditional release granted by the Parole Board of Canada whereby the remainder of the sentence is served under supervision in the community.
Statutory release refers to a conditional release that is subject to supervision after the offender has served two-thirds of the sentence.
Percent change is measured from the previous year.
These cases reflect the number of offenders on active supervision at fiscal year end. A fiscal year runs from April 1 to March 31 of the following year.
| Fiscal year | Day parole | Full parole | Statutory release | Totals | % change | |||||||||
|---|---|---|---|---|---|---|---|---|---|---|---|---|---|---|
| Females | Males | Another sex | Females | Males | Another sex | Females | Males | Another sex | Females | Males | Another sex | Total | Total | |
| 2012-13 | 116 | 1,106 | NR | 225 | 2,932 | NR | 136 | 2,801 | NR | 477 | 6,839 | NR | 7,316 | -1.7 |
| 2013-14 | 106 | 1,104 | NR | 225 | 3,017 | NR | 153 | 2,858 | NR | 484 | 6,979 | NR | 7,463 | 2.0 |
| 2014-15 | 115 | 1,236 | NR | 239 | 3,065 | NR | 150 | 2,909 | NR | 504 | 7,210 | NR | 7,714 | 3.4 |
| 2015-16 | 124 | 1,248 | NR | 273 | 3,276 | NR | 177 | 2,849 | NR | 574 | 7,373 | NR | 7,947 | 3.0 |
| 2016-17 | 158 | 1,392 | NR | 316 | 3,587 | NR | 154 | 2,856 | NR | 628 | 7,835 | NR | 8,463 | 6.5 |
| 2017-18 | 197 | 1,462 | NR | 369 | 3,864 | NR | 145 | 2,644 | NR | 711 | 7,970 | NR | 8,681 | 2.6 |
| 2018-19 | 192 | 1,500 | NR | 370 | 4,059 | NR | 159 | 2,595 | NR | 721 | 8,154 | NR | 8,875 | 2.2 |
| 2019-20 | 163 | 1,376 | 0 | 406 | 4,164 | 1 | 152 | 2,632 | 0 | 721 | 8,172 | 1 | 8,894 | 0.2 |
| 2020-21 | 148 | 1,258 | 0 | 398 | 4,105 | 0 | 161 | 2,554 | 0 | 707 | 7,917 | 0 | 8,624 | -3.0 |
| 2021-22 | 162 | 1,229 | 0 | 351 | 3,773 | 0 | 122 | 2,347 | 0 | 635 | 7,349 | 0 | 7,984 | -7.4 |
Source: Correctional Service of Canada.
Table C26 Notes
Results for “Another sex” were unavailable prior to 2019-20. “Not reported” is abbreviated to “NR” in this table due to formatting.
The data reflect the offender population in the community under supervision, which includes all active offenders on day parole, full parole, statutory release, offenders who are temporarily detained in a non-CSC facility, offenders who are unlawfully at large for less than 90 days, offenders on remand in a non-CSC facility, and offenders supervised and subject to an immigration hold by Canada Border Services Agency.
The data presented above do not include offenders who were on long-term supervision orders (See Figure/Table E4).
As a result of a data quality issue, supervision information on 1 offender was not available at the time of the data extraction.
Day parole is a type of conditional release granted by the Parole Board of Canada whereby offenders are permitted to participate in community-based activities in preparation for full parole or statutory release. The conditions require offenders to return nightly to an institution or half-way house unless otherwise authorized by the Parole Board of Canada.
Full parole is a type of conditional release granted by the Parole Board of Canada whereby the remainder of the sentence is served under supervision in the community.
Statutory release refers to a conditional release that is subject to supervision after the offender has served two-thirds of the sentence.
Percent change is measured from the previous year.
These cases reflect the number of offenders on active supervision at fiscal year end. A fiscal year runs from April 1 to March 31 of the following year.
Offenders under provincial/territorial supervision on probation or conditional sentence: 10-year trend
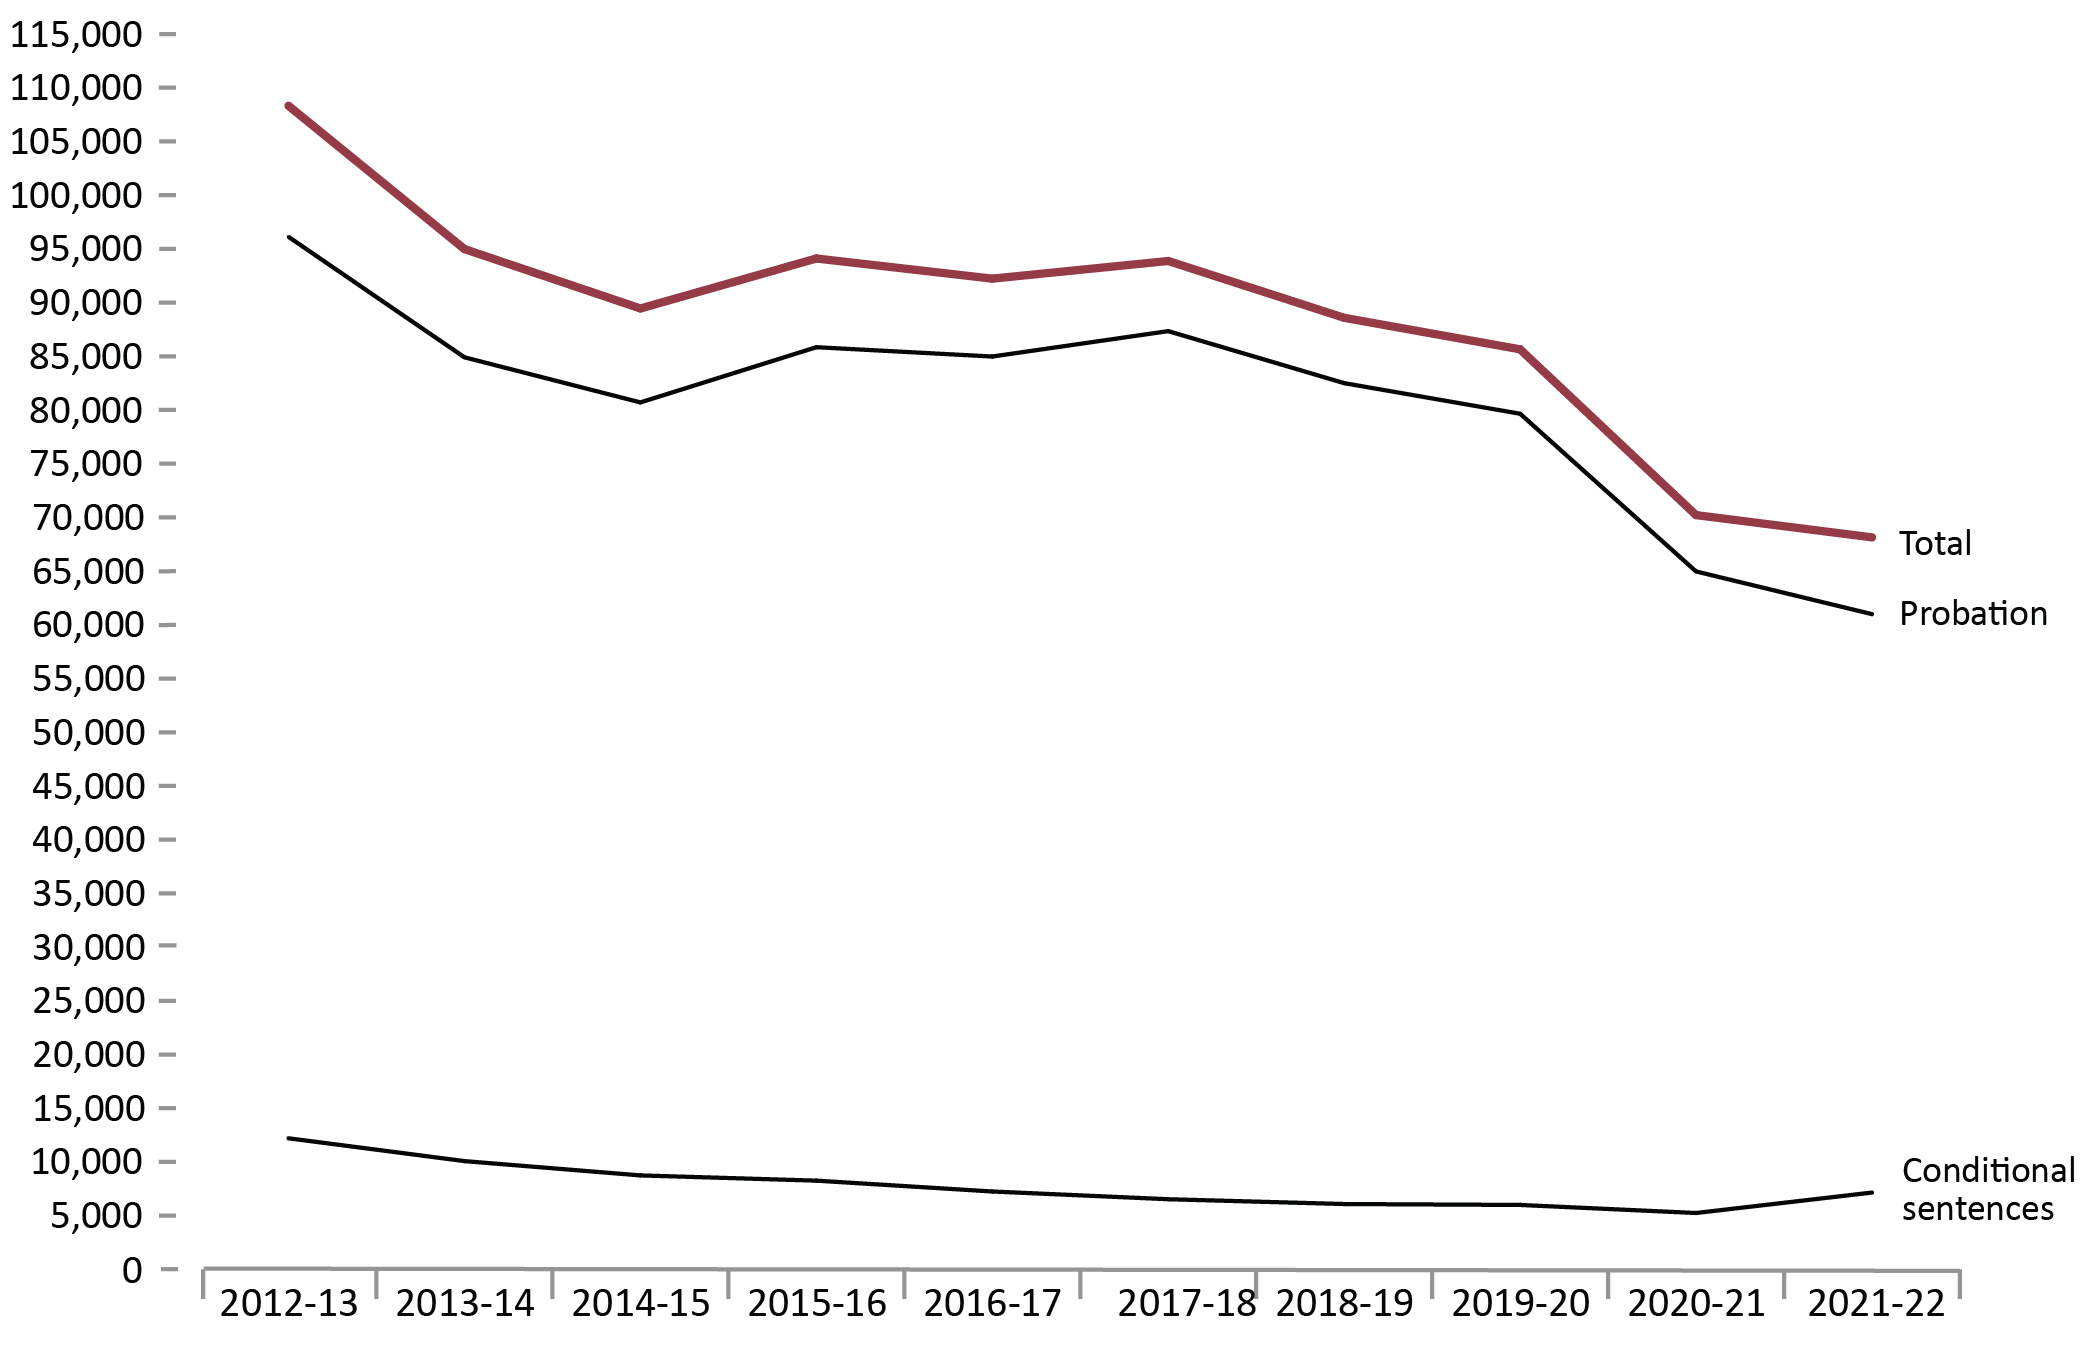
Image description
Line graph showing the average offender counts under provincial/territorial supervision on probation or conditional sentences from fiscal year 2012 to 2013 until fiscal year 2021 to 2022. The total average offender counts decrease from 108,318 in fiscal year 2012 to 2013 to 89,451 in fiscal year 2014 to 2015, counts then rise to 94,104 in fiscal year 2015 to 2016, after which point they drop gradually until the lowest point of 68,144 counts in fiscal year 2021 to 2022. Probation counts decrease from 96,116 in fiscal year 2012 to 2013 to 80,705 counts in fiscal year 2014 to 2015, then increase for fiscal year 2015 to 2016 at 85,845 counts, decreasing for fiscal year 2016 to 2017 at 84,978 counts, increasing again for fiscal year 2017 to 2018 at 87,342 counts, then decreasing until its lowest point in fiscal year 2021 to 2022 at 60,994 counts. Conditional sentences are the lowest average offender counts, decreasing from 12,202 counts in fiscal year 2012 to 2013 to 7,150 counts in fiscal year 2021 to 2022. Full data are available immediately below.
Source: Table 35-10-0154-01, Corrections Key Indicator Report for Adults and Youth, Canadian Centre for Justice and Community Safety Statistics, Statistics Canada.
- Between 2012-13 to 2021-22, there was a 37.1% decrease in the provincial/territorial community corrections population. The 2021-22 rate was 3.0% lower than in 2020-21 and 27.4% lower than the rate in 2017-18.
- The number of offenders on conditional sentence orders decreased 41.4% from 12,202 in 2012-13 to 7,150 in 2021-22. The 2021-22 rate was 36.3% higher than 2020-21 and 9.5% higher than the rate 5 years prior in 2017-18.
- The number of offenders on probation decreased 36.5% from 2012-13 to 2021-22. The 2021-22 rate was 6.1% lower than in 2020-21 and 30.2% lower than the rate in 2017-18.
Figure C27 Notes
Data points reflect the average daily count of adult offenders on probation/conditional sentence over the 12-month fiscal year period.
A conditional sentence is a disposition of the court where the offender serves a term of imprisonment in the community under specified conditions. This type of sentence can only be imposed in cases where the term of imprisonment would be less than 2 years. Conditional sentences have been a provincial and territorial sentencing option since September 1996.
The figure includes data from the most recent year available at the time of publication.
Reported year periods reflect a fiscal year. A fiscal year runs from April 1 to March 31 of the following year.
| Fiscal year | Average offender counts on probation | Average offender counts on conditional sentence | Total |
|---|---|---|---|
| 2012-13 | 96,116 | 12,202 | 108,318 |
| 2013-14 | 84,905 | 10,077 | 94,981 |
| 2014-15 | 80,705 | 8,746 | 89,451 |
| 2015-16 | 85,845 | 8,259 | 94,104 |
| 2016-17 | 84,978 | 7,249 | 92,228 |
| 2017-18 | 87,342 | 6,529 | 93,871 |
| 2018-19 | 82,500 | 6,082 | 88,582 |
| 2019-20 | 79,652 | 5,996 | 85,648 |
| 2020-21 | 64,971 | 5,246 | 70,216 |
| 2021-22 | 60,994 | 7,150 | 68,144 |
Source: Table 35-10-0154-01, Corrections Key Indicator Report for Adults and Youth, Canadian Centre for Justice and Community Safety Statistics, Statistics Canada.
Table C27 Notes
Data points reflect the average daily count of adult offenders on probation/conditional sentence over the 12-month fiscal year period.
A conditional sentence is a disposition of the court where the offender serves a term of imprisonment in the community under specified conditions. This type of sentence can only be imposed in cases where the term of imprisonment would be less than 2 years. Conditional sentences have been a provincial and territorial sentencing option since September 1996.
The figure includes data from the most recent year available at the time of publication.
Reported year periods reflect fiscal years. A fiscal year runs from April 1 to March 31 of the following year.
Population of offenders on provincial parole: 10-year trend
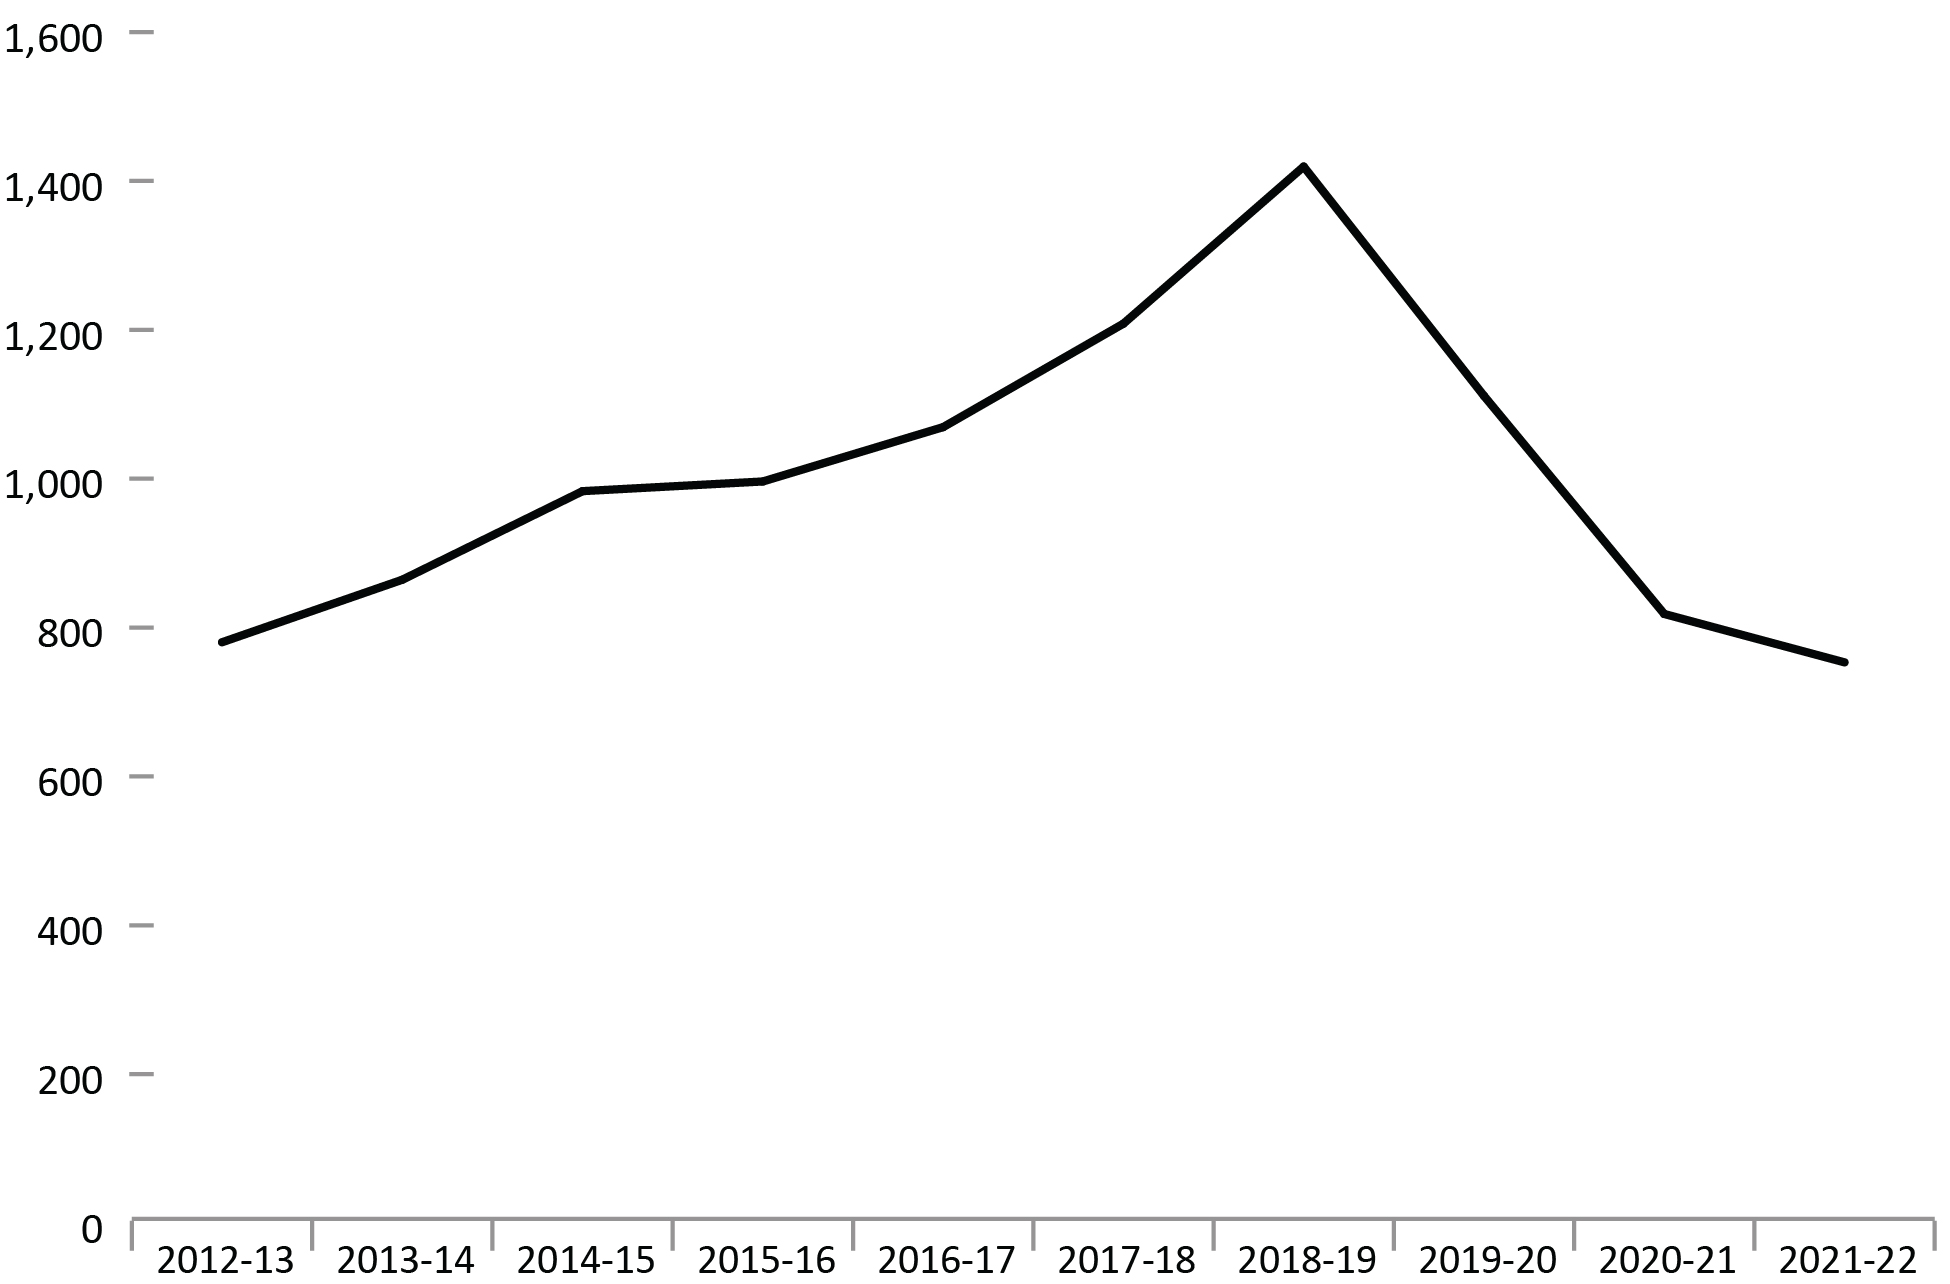
Image description
Line graph showing the average count of offenders on provincial day or full parole from fiscal year 2011 to 2012 until fiscal year 2021 to 2022. The population of offenders in fiscal year 2011 to 2012 decreased slightly to 769 offenders in fiscal year 2012 to 2013, then it increased steadily until its peak at 1,408 offenders in fiscal year 2018 to 2019, before dropping to 742 offenders in fiscal year 2021 to 2022. Full data are available immediately below.
Source: Table 35-10-0154-01, Corrections Key Indicator Report for Adults and Youth, Canadian Centre for Justice and Community Safety Statistics, Statistics Canada.
- The number of offenders on provincial parole decreased by 8.1% from 2020-21 to 2021-22 (807 offenders to 742).
- In the 5 years between 2017-18 to 2021-22, there was a 38.0% decrease in the number of offenders on provincial parole, down from 1,197 in 2017-18 to 742 in 2021-22.
Figure C28 Notes
Provincial parole boards operate in Quebec, Ontario and Alberta. On April 1, 2007, the Parole Board of Canada assumed responsibility for parole decisions relating to offenders serving sentences in British Columbia's provincial correctional facilities. The Parole Board of Canada has jurisdiction over granting parole to provincial offenders in the Atlantic and Prairie provinces, British Columbia, and to territorial offenders in Yukon, Nunavut and the Northwest Territories.
The figure includes data from the most recent year available at the time of publication.
Reported year periods reflect a fiscal year. A fiscal year runs from April 1 to March 31 of the following year.
| Fiscal year | Provincial boards | Parole Board of CanadaFootnote * | Total | % change | |||
|---|---|---|---|---|---|---|---|
| Quebec | Ontario | Alberta | Total | ||||
| 2012-13 | 462 | 164 | NR |
626 | 143 | 769 | 100.0 |
| 2013-14 | 527 | 172 | NR |
699 | 154 | 853 | 9.8 |
| 2014-15 | 612 | 207 | NR |
821 | 151 | 972 | 12.3 |
| 2015-16 | 639 | 207 | NR |
846 | 139 | 985 | 1.3 |
| 2016-17 | 701 | 205 | NR |
907 | 151 | 1,058 | 6.9 |
| 2017-18 | 792 | 242 | NR |
1,034 | 163 | 1,197 | 11.6 |
| 2018-19 | 858 | 398 | NR |
1,256 | 152 | 1,408 | 15.0 |
| 2019-20 | 682 | 289 | NR |
973 | 127 | 1,100 | -28.1 |
| 2020-21 | 490 | 197 | 2 | 690 | 117 | 807 | -36.3 |
| 2021-22 | 489 | 140 | 20 | 649 | 93 | 742 | -8.8 |
Source: Table 35-10-0154-01, Corrections Key Indicator Report for Adults and Youth, Canadian Centre for Justice and Community Safety Statistics, Statistics Canada.
Section D: Conditional Release
Number of CSC offenders granted temporary absences: 10-year trend
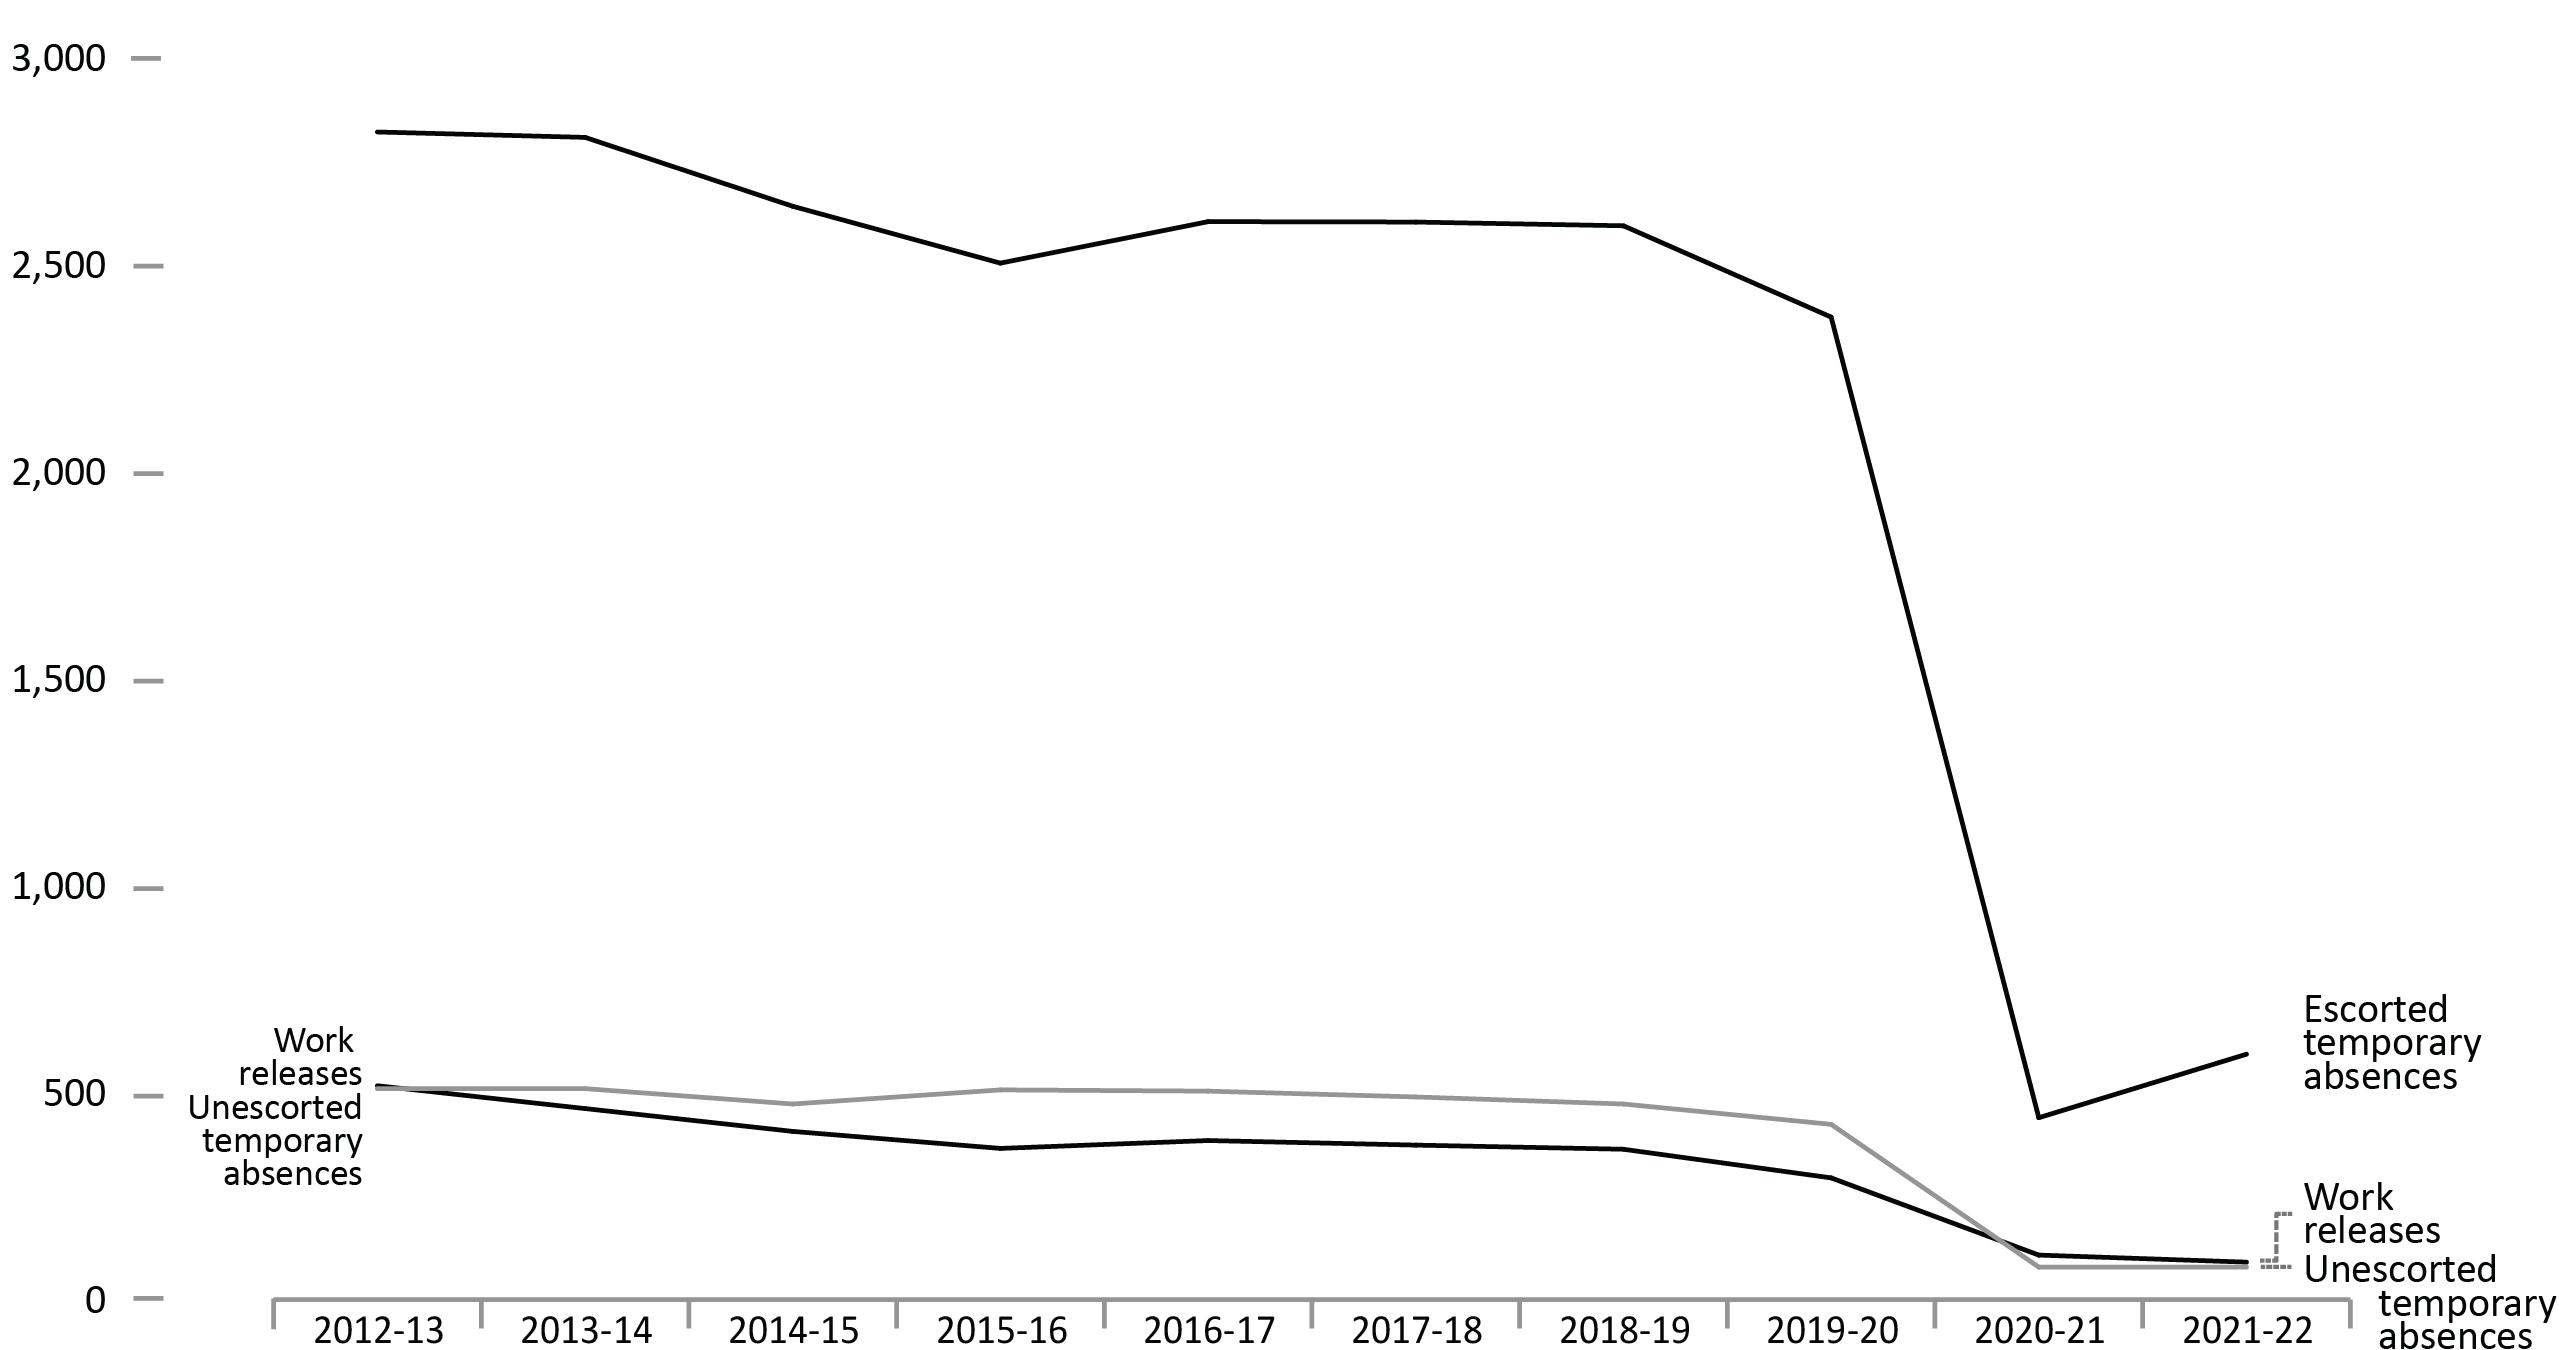
Image description
Line graph showing the number of Correctional Service of Canada offenders who were granted temporary absences, between fiscal year 2012 to 2013 and fiscal year 2021 to 2022, by type of temporary absence that was granted. The vast majority of temporary absences which were granted are escorted temporary absences, which remained stable from fiscal year 2012 to 2013 to fiscal year 2013 to 2014 at around 2,700 offenders granted, then declining gradually to around 2,400 offenders granted in fiscal year 2015 to 2016, a number which remained relatively stable until fiscal year 2020 to 2021, at which point there was a sharp decline to around 370 offenders granted, and a slight increase to around 500 offenders granted in fiscal year 2021 to 2022. Work releases and unescorted temporary absences followed a similar trend, with around 500 offenders granted in fiscal year 2012 to 2013, then decreasing gradually to just around 300 offenders granted in fiscal year 2019 to 2020, after which point the temporary unescorted absences plunged to 18 offenders granted in fiscal year 2020 to 2021 and have remained stable since, while work released plunged to 30 offenders granted in fiscal year 2021 to 2022. Full data are available immediately below.
Source: Correctional Service of Canada.
- There was a decrease in the number of offenders receiving escorted temporary absences, from 2,307 in 2019-20 to 531 in 2021-22. There was a decrease in the number of offenders receiving unescorted temporary absences, from 362 in 2019-20 to 18 in 2021-22.
- The number of offenders receiving work releases has decreased by 87.1%, from 233 in 2019-20 to 30 in 2021-22.
- For the past 10 years (from 2012-13 to 2021-22), the average successful completion rates for escorted temporary absences was 99.6%, 98.6% for unescorted temporary absences and 94.2% for work releases.
Figure D1 Notes
A temporary absence is permission given to an eligible offender to be away from the normal place of confinement for medical, administrative, community service, family contact, personal development for rehabilitative purposes, or compassionate reasons, including parental responsibilities.
A work release is a structured program of release of specified duration for work or community service outside the penitentiary, under the supervision of a staff member or other authorized person or organization.
These numbers depict the number of offenders who received at least 1 temporary absence permit (excluding those for medical purposes) or at least 1 work release. An offender may be granted more than 1 temporary absence permit or work release over a period of time.
Reported year periods reflect fiscal years. A fiscal year runs from April 1 to March 31 of the following year.
| Fiscal year | Temporary absences | Work releases | ||||
|---|---|---|---|---|---|---|
| Escorted | Unescorted | |||||
| # of offenders | # of permits | # of offenders | # of permits | # of offenders | # of permits | |
| 2012-13 | 2,753 | 47,814 | 448 | 3,709 | 455 | 815 |
| 2013-14 | 2,740 | 49,502 | 448 | 4,005 | 400 | 643 |
| 2014-15 | 2,574 | 49,631 | 411 | 3,563 | 345 | 489 |
| 2015-16 | 2,437 | 47,072 | 445 | 4,080 | 304 | 418 |
| 2016-17 | 2,537 | 48,577 | 442 | 3,782 | 323 | 481 |
| 2017-18 | 2,536 | 50,474 | 428 | 3,165 | 312 | 443 |
| 2018-19 | 2,527 | 55,927 | 411 | 2,819 | 302 | 434 |
| 2019-20 | 2,307 | 51,007 | 362 | 2,890 | 233 | 314 |
| 2020-21 | 378 | 2,609 | 18 | 59 | 47 | 54 |
| 2021-22 | 531 | 3,863 | 18 | 44 | 30 | 36 |
Source: Correctional Service of Canada.
Table D1 Notes
A temporary absence is permission given to an eligible offender to be away from the normal place of confinement for medical, administrative, community service, family contact, personal development for rehabilitative purposes, or compassionate reasons, including parental responsibilities.
A work release is a structured program of release of specified duration for work or community service outside the penitentiary, under the supervision of a staff member or other authorized person or organization.
These numbers depict the number of offenders who received at least 1 temporary absence permit (excluding those for medical purposes) or at least 1 work release. An offender may be granted more than 1 temporary absence permit or work release over a period of time.
Reported year periods reflect fiscal years. A fiscal year runs from April 1 to March 31 of the following year.
Offenders released from federal institutions including Healing Lodges on parole: 10-year trend
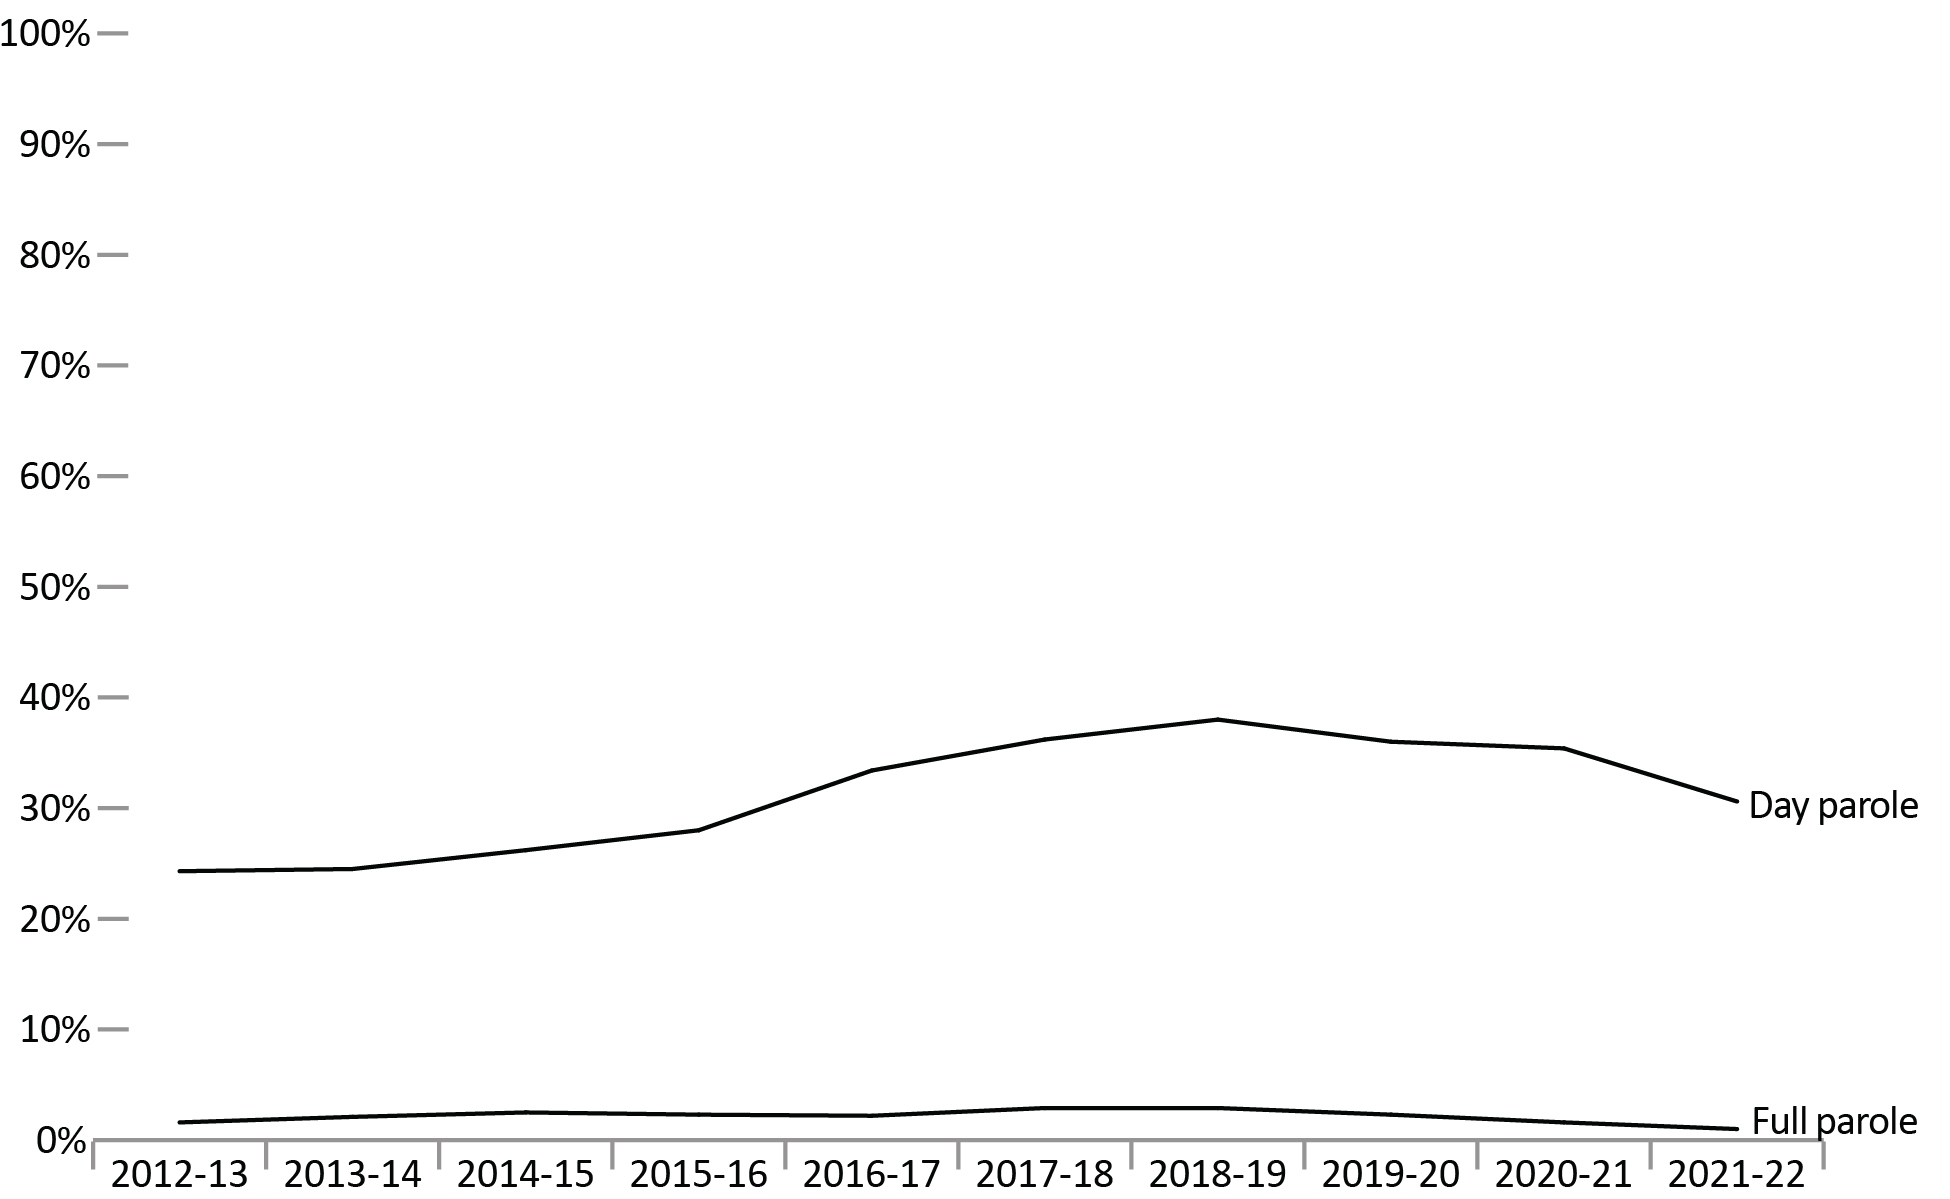
Image description
Line graph showing the percentage of offenders that were released from federal institutions or Healing Lodges on parole, between fiscal year 2012 to 2013 and fiscal year 2021 to 2022, by type of parole. About 25 percent of offenders were released on day parole between fiscal year 2012 to 2013, which remained stable until fiscal year 2013 to 2014, after which point day parole releases gradually rose to 38 percent in fiscal year 2019 to 20, after which the rate declined to just under 35 percent in fiscal year 2018 to 2019, then dropping to around 30 percent in fiscal year 2021 to 2022. Meanwhile, very few offenders are granted full parole, with the percentage of full parole releases hovering between one and three percent for the entire period. Full data are available immediately below.
Source: Correctional Service of Canada.
- In fiscal year 2021-22, 30.6% of all releases from federal institutions were on day parole and 1.0% were on full parole.
- In fiscal year 2021-22, 19.8% of releases for Indigenous offenders were on day parole and 0.2% were on full parole compared to 36.3% and 1.4%, respectively, for non-Indigenous offenders.
- Over the past 10 years (from 2012-13 to 2021-22), the percentage of releases on day parole increased from 24.3% to 30.6% and the percentage of releases on full parole decreased from 1.6% to 1.0%.
| Fiscal year | Indigenous | Non-Indigenous | Total offender population | |||||||
|---|---|---|---|---|---|---|---|---|---|---|
| Day parole | Full parole | Total releases | Day parole | Full parole | Total releases | Day parole | Full parole | Total releases | ||
| 2012-13 | # | 320 | 7 | 1,969 | 1,508 | 110 | 5,564 | 1,828 | 117 | 7,533 |
| % | 16.3 | 0.4 | 27.1 | 2.0 | 24.3 | 1.6 | ||||
| 2013-14 | # | 289 | 19 | 2,045 | 1,593 | 144 | 5,636 | 1,882 | 163 | 7,681 |
| % | 14.1 | 0.9 | 28.3 | 2.6 | 24.5 | 2.1 | ||||
| 2014-15 | # | 311 | 10 | 2,077 | 1,664 | 175 | 5,455 | 1,975 | 185 | 7,532 |
| % | 15.0 | 0.5 | 30.5 | 3.2 | 26.2 | 2.5 | ||||
| 2015-16 | # | 343 | 14 | 2,047 | 1,787 | 164 | 5,569 | 2,130 | 178 | 7,616 |
| % | 16.8 | 0.7 | 32.1 | 2.9 | 28.0 | 2.3 | ||||
| 2016-17 | # | 436 | 14 | 2,048 | 2,091 | 153 | 5,529 | 2,527 | 167 | 7,577 |
| % | 21.3 | 0.7 | 37.8 | 2.8 | 33.4 | 2.2 | ||||
| 2017-18 | # | 504 | 25 | 2,076 | 2,118 | 183 | 5,174 | 2,622 | 208 | 7,250 |
| % | 24.3 | 1.2 | 40.9 | 3.5 | 36.2 | 2.9 | ||||
| 2018-19 | # | 554 | 33 | 2,020 | 2,129 | 175 | 5,044 | 2,683 | 208 | 7,064 |
| % | 27.4 | 1.6 | 42.2 | 3.5 | 38.0 | 2.9 | ||||
| 2019-20 | # | 516 | 24 | 2,169 | 2,025 | 140 | 4,892 | 2,541 | 164 | 7,061 |
| % | 23.8 | 1.1 | 41.4 | 2.9 | 36.0 | 2.3 | ||||
| 2020-21 | # | 489 | 16 | 2,087 | 1,824 | 86 | 4,451 | 2,313 | 102 | 6,538 |
| % | 23.4 | 0.8 | 41.0 | 1.9 | 35.4 | 1.6 | ||||
| 2021-22 | # | 436 | 5 | 2,204 | 1,528 | 57 | 4,205 | 1,964 | 62 | 6,409 |
| % | 19.8 | 0.2 | 36.3 | 1.4 | 30.6 | 1.0 | ||||
Source: Correctional Service of Canada.
Table D2 Notes
The data includes all releases from a federal institution or Healing Lodge in a given fiscal year excluding offenders with quashed sentences, offenders who died in custody, LTSO releases, offenders released at warrant expiry and offenders transferred to foreign countries. An offender may be released more than once during the reporting timeframe in cases where a previous release was subject to revocation, suspension, temporary detention, interruption or in cases where an offender served more than 1 sentence.
Day parole is a type of conditional release granted by the Parole Board of Canada whereby offenders are permitted to participate in community-based activities in preparation for full parole or statutory release. The conditions require offenders to return nightly to an institution or half-way house unless otherwise authorized by the Parole Board of Canada.
Full parole is a type of conditional release granted by the Parole Board of Canada whereby the remainder of the sentence is served under supervision in the community.
Percentage is calculated based on the number of day and full paroles compared to the total releases for each offender group.
Reported year periods reflect fiscal years. A fiscal year runs from April 1 to March 31 of the following year.
Federal day and full parole grant rates: 10-year trend
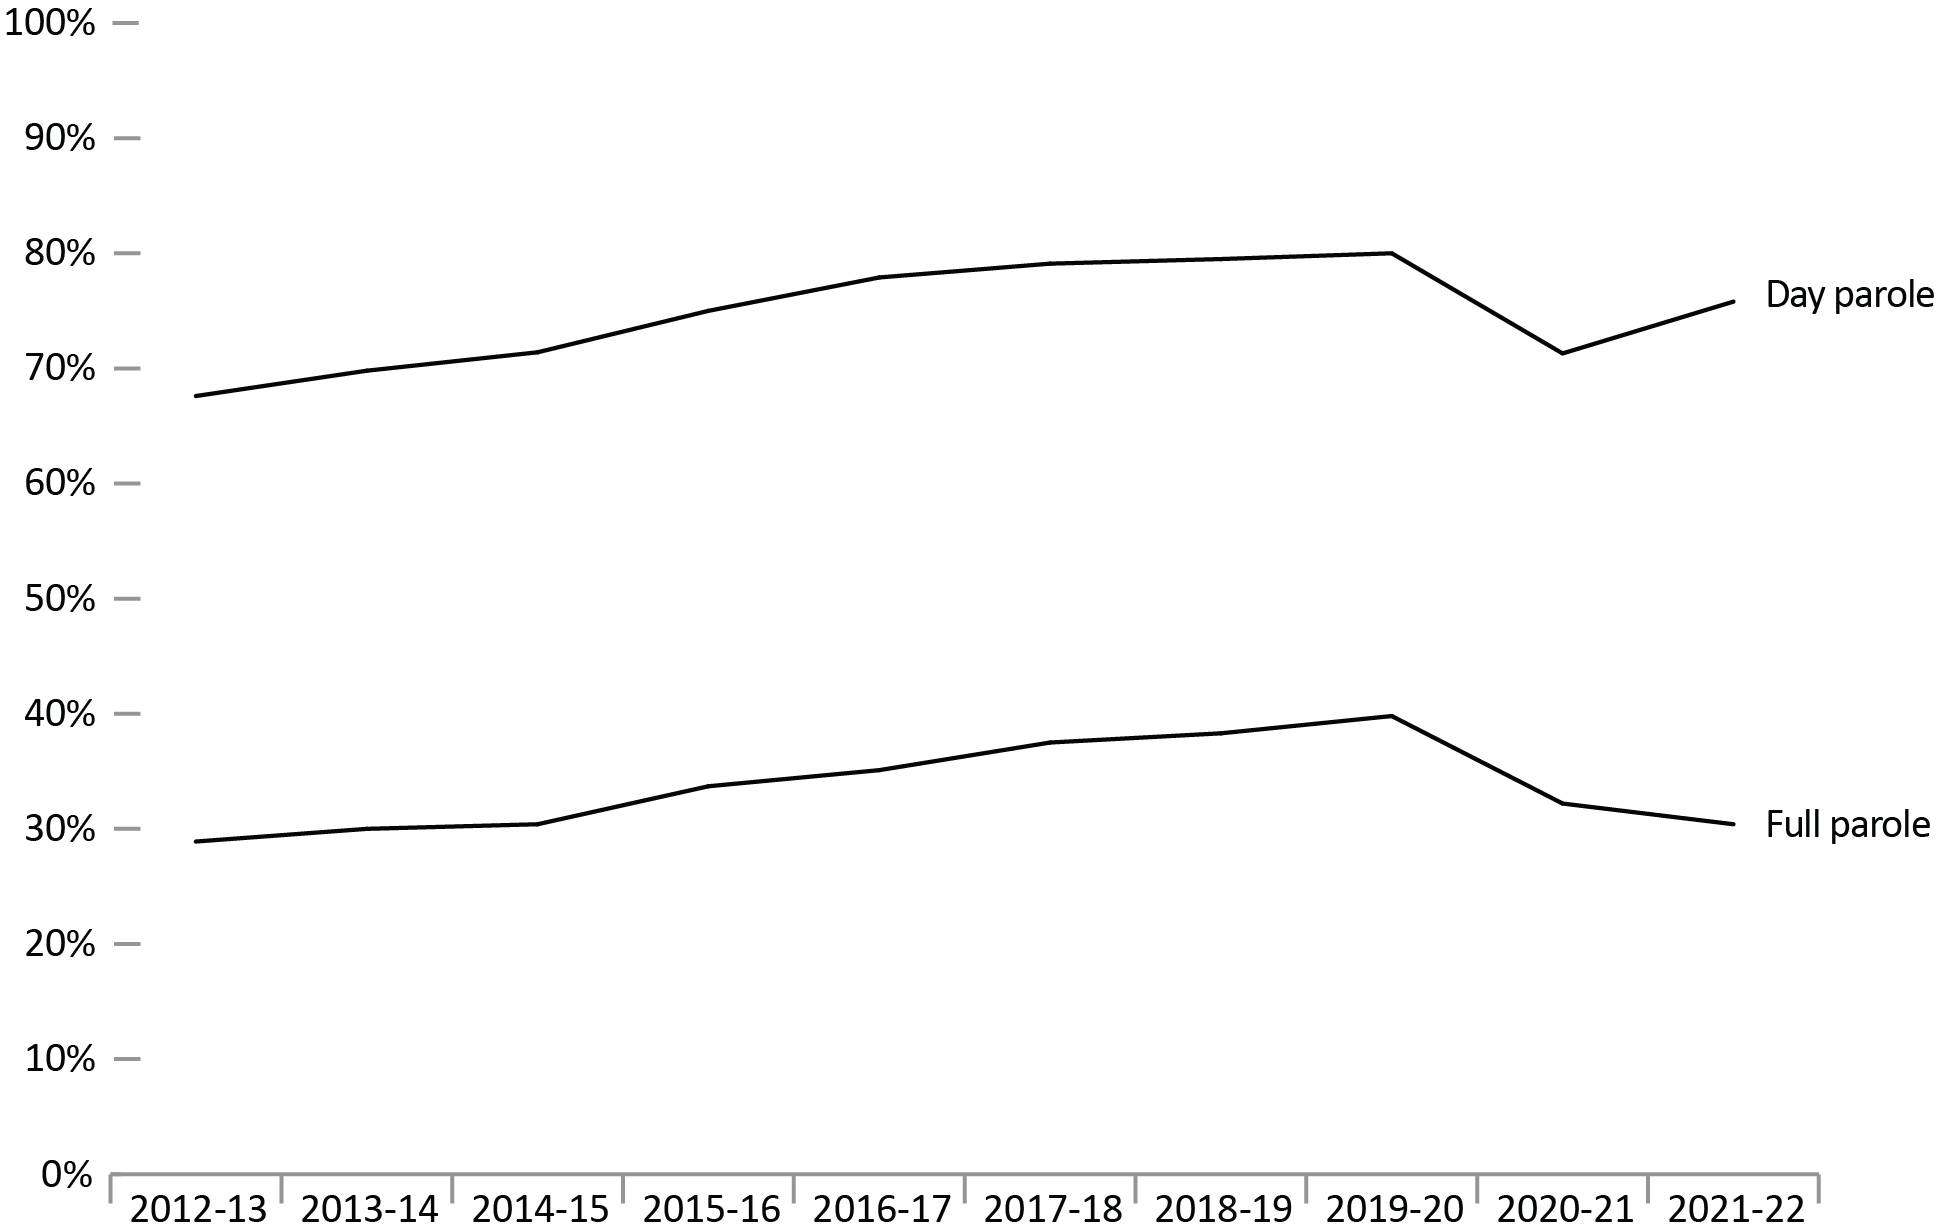
Image description
Line graph showing the percent of federal day and full parole grant rates, between fiscal year 2012 to 2013 and fiscal year 2021 to 2022. Between fiscal year 2012 to 2013 and fiscal year 2019 to 2020 the federal day parole grant rate rose from 67.6 percent to 80.0 percent, then decreasing to 71.3 percent in fiscal year 2020 to 2021, and rising slightly to 75.8 percent in fiscal year 2021 to 2022. The federal full parole grant rate follows a similar trend, but starts at 28.8 percent in fiscal year 2012 to 2013 and increases to a peak of 39.8 percent in fiscal year 2019 to 2020, then falling to 30.4 percent in fiscal year 2021 to 2022. Full data are available immediately below.
Source: Parole Board of Canada.
- In 2021-22, the federal day parole grant rateFootnote * increased to 75.8%, which is a 4.4% increase compared to the previous year.
- In 2021-22, the federal full parole grant rateFootnote * decreased to 30.4%, which is a 1.8% decrease compared to the previous year.
- Over the past 10 years (from 2012-13 to 2021-22), female offenders had a much higher grant rateFootnote * of federal day parole and full parole (89.1% and 46.4%) than male offenders (73.6% and 32.9%).
| Type of release | Fiscal year | Granted | Denied | Grant rateFootnote * (%) | APR | |||||
|---|---|---|---|---|---|---|---|---|---|---|
| Females | Males | Females | Males | Females | Males | Total | Directed | Total | ||
| Day parole | 2012-13 | 289 | 2,821 | 73 | 1,415 | 79.8 | 66.6 | 67.6 | 14 | 21 |
| 2013-14 | 248 | 2,824 | 52 | 1,274 | 82.7 | 68.9 | 69.8 | 39 | 47 | |
| 2014-15 | 298 | 3,023 | 51 | 1,282 | 85.4 | 70.2 | 71.4 | 38 | 45 | |
| 2015-16 | 291 | 3,093 | 52 | 1,078 | 84.8 | 74.2 | 75.0 | 86 | 90 | |
| 2016-17 | 399 | 3,445 | 47 | 1,042 | 89.5 | 76.8 | 77.9 | 80 | 83 | |
| 2017-18 | 437 | 3,612 | 30 | 1,039 | 93.6 | 77.7 | 79.1 | 100 | 106 | |
| 2018-19 | 469 | 3,737 | 27 | 1,055 | 94.6 | 78.0 | 79.5 | 56 | 58 | |
| 2019-20 | 435 | 3,590 | 35 | 972 | 92.6 | 78.7 | 80.0 | 48 | 48 | |
| 2020-21 | 352 | 3,409 | 49 | 1,462 | 87.8 | 70.0 | 71.3 | 25 | 25 | |
| 2021-22 | 383 | 2,919 | 24 | 1,031 | 94.1 | 73.9 | 75.8 | 20 | 22 | |
| Full parole | 2012-13 | 90 | 914 | 142 | 2,328 | 38.8 | 28.2 | 28.9 | 26 | 26 |
| 2013-14 | 84 | 904 | 103 | 2,202 | 44.9 | 29.1 | 30.0 | 126 | 142 | |
| 2014-15 | 87 | 969 | 105 | 2,308 | 45.3 | 29.6 | 30.4 | 119 | 137 | |
| 2015-16 | 96 | 1,063 | 127 | 2,154 | 43.0 | 33.0 | 33.7 | 166 | 185 | |
| 2016-17 | 138 | 1,237 | 158 | 2,383 | 46.6 | 34.2 | 35.1 | 122 | 126 | |
| 2017-18 | 154 | 1,362 | 175 | 2,357 | 46.8 | 36.6 | 37.5 | 161 | 165 | |
| 2018-19 | 157 | 1,451 | 175 | 2,420 | 47.3 | 37.5 | 38.3 | 66 | 67 | |
| 2019-20 | 182 | 1,385 | 159 | 2,208 | 53.4 | 38.5 | 39.8 | 60 | 60 | |
| 2020-21 | 138 | 1,282 | 140 | 2,844 | 49.6 | 31.1 | 32.2 | 37 | 38 | |
| 2021-22 | 111 | 961 | 143 | 2,307 | 43.7 | 29.4 | 30.4 | 23 | 23 | |
Source: Parole Board of Canada.
Federal day and full parole grant rates by Indigenous and non-Indigenous offenders: 10-year trend
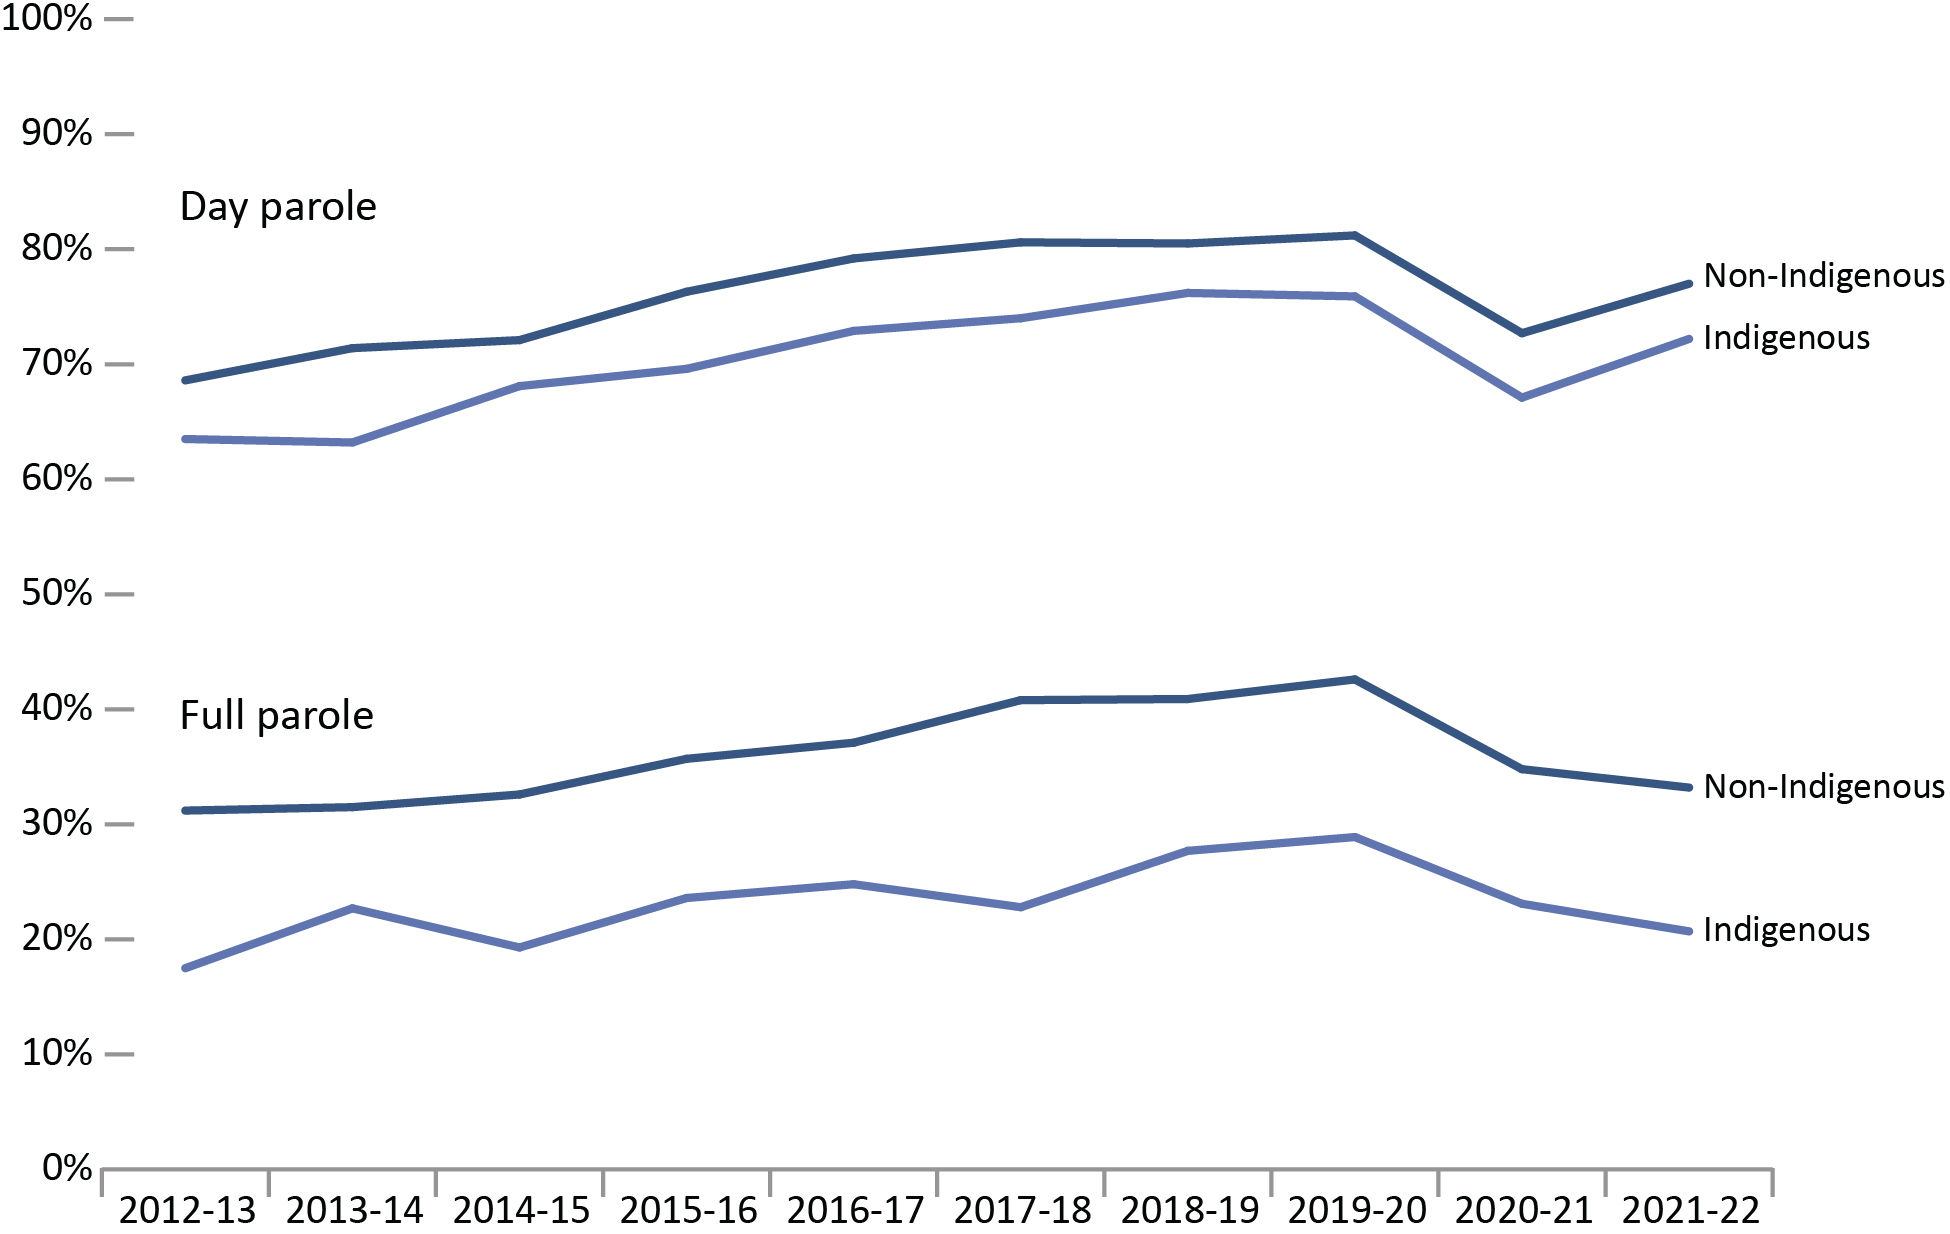
Image description
Line graph showing the percent of federal day parole and full parole grant rates, between fiscal year 2012 to 2013 and fiscal year 2021 to 2022, by Indigenous versus non-Indigenous identity. In all cases, non-Indigenous people are granted parole at higher rates than Indigenous people. The difference is more pronounced for the granting of full parole, with a difference of about 10 percent, than for the granting of day parole, where the difference is about 5 percent. Day parole grant rates for non-Indigenous and Indigenous offenders rose gradually from fiscal year 2012 to 2013 until a peak of 76.2 percent for Indigenous offenders in fiscal year 2018 to 2019 and a peak of 81.2 percent for non-Indigenous offenders in fiscal year 2019 to 2020. Full parole grant rates for non-Indigenous offenders rose gradually from fiscal year 2012 to 2013 to a peak of 42.6 percent in fiscal year 2019 to 2020. Full parole grant rates for Indigenous offenders fluctuated during that time, but also reached its peak in fiscal year 2019 to 2020 at 28.9 percent. Full data are available immediately below.
Source: Parole Board of Canada.
- In 2021-22, the federal day parole grant rate increased for both Indigenous offenders (72.2%; +5.1%) and non-Indigenous offenders (77.0%; +4.2%) compared to 2020-21.
- In 2021-22, the federal full parole grant rate decreased for both Indigenous offenders (20.7%; -2.4%) and non-Indigenous offenders (33.2%; -1.6%) compared to 2020-21.
- Over the past 10 years (from 2012-13 to 2021-22), lower federal day and full parole grant rates were reported for Indigenous offenders (70.7%; 23.4%) than for non-Indigenous offenders (76.1%; 36.3%).
| Type of release | Fiscal year | Granted | Denied | Grant rate (%) | APR | |||||
|---|---|---|---|---|---|---|---|---|---|---|
| Ind. | Non- Ind. | Ind. | Non-Ind. | Ind. | Non-Ind. | Total | Directed | Total | ||
| Day parole | 2012-13 | 568 | 2,542 | 327 | 1,161 | 63.5 | 68.6 | 67.6 | 14 | 21 |
| 2013-14 | 532 | 2,540 | 310 | 1,016 | 63.2 | 71.4 | 69.8 | 39 | 47 | |
| 2014-15 | 574 | 2,747 | 269 | 1,064 | 68.1 | 72.1 | 71.4 | 38 | 45 | |
| 2015-16 | 617 | 2,767 | 270 | 860 | 69.6 | 76.3 | 75.0 | 86 | 90 | |
| 2016-17 | 715 | 3,129 | 266 | 823 | 72.9 | 79.2 | 77.9 | 80 | 83 | |
| 2017-18 | 829 | 3,220 | 292 | 777 | 74.0 | 80.6 | 79.1 | 100 | 106 | |
| 2018-19 | 940 | 3,266 | 293 | 789 | 76.2 | 80.5 | 79.5 | 56 | 58 | |
| 2019-20 | 906 | 3,119 | 287 | 720 | 75.9 | 81.2 | 80.0 | 48 | 48 | |
| 2020-21 | 868 | 2,893 | 425 | 1,086 | 67.1 | 72.7 | 71.3 | 25 | 25 | |
| 2021-22 | 774 | 2,528 | 298 | 757 | 72.2 | 77.0 | 75.8 | 20 | 22 | |
| Full parole | 2012-13 | 101 | 903 | 477 | 1,993 | 17.5 | 31.2 | 28.9 | 26 | 26 |
| 2013-14 | 126 | 862 | 429 | 1,876 | 22.7 | 31.5 | 30.0 | 126 | 142 | |
| 2014-15 | 109 | 947 | 456 | 1,957 | 19.3 | 32.6 | 30.4 | 119 | 137 | |
| 2015-16 | 137 | 1,022 | 443 | 1,838 | 23.6 | 35.7 | 33.7 | 166 | 185 | |
| 2016-17 | 156 | 1,219 | 473 | 2,068 | 24.8 | 37.1 | 35.1 | 122 | 126 | |
| 2017-18 | 171 | 1,345 | 580 | 1,952 | 22.8 | 40.8 | 37.5 | 161 | 165 | |
| 2018-19 | 235 | 1,373 | 613 | 1,982 | 27.7 | 40.9 | 38.3 | 66 | 67 | |
| 2019-20 | 231 | 1,336 | 569 | 1,798 | 28.9 | 42.6 | 39.8 | 60 | 60 | |
| 2020-21 | 225 | 1,195 | 748 | 2,236 | 23.1 | 34.8 | 32.2 | 37 | 38 | |
| 2021-22 | 162 | 910 | 620 | 1,830 | 20.7 | 33.2 | 30.4 | 23 | 23 | |
Source: Parole Board of Canada.
Number of federal Elder-Assisted parole hearings: 10-year trend
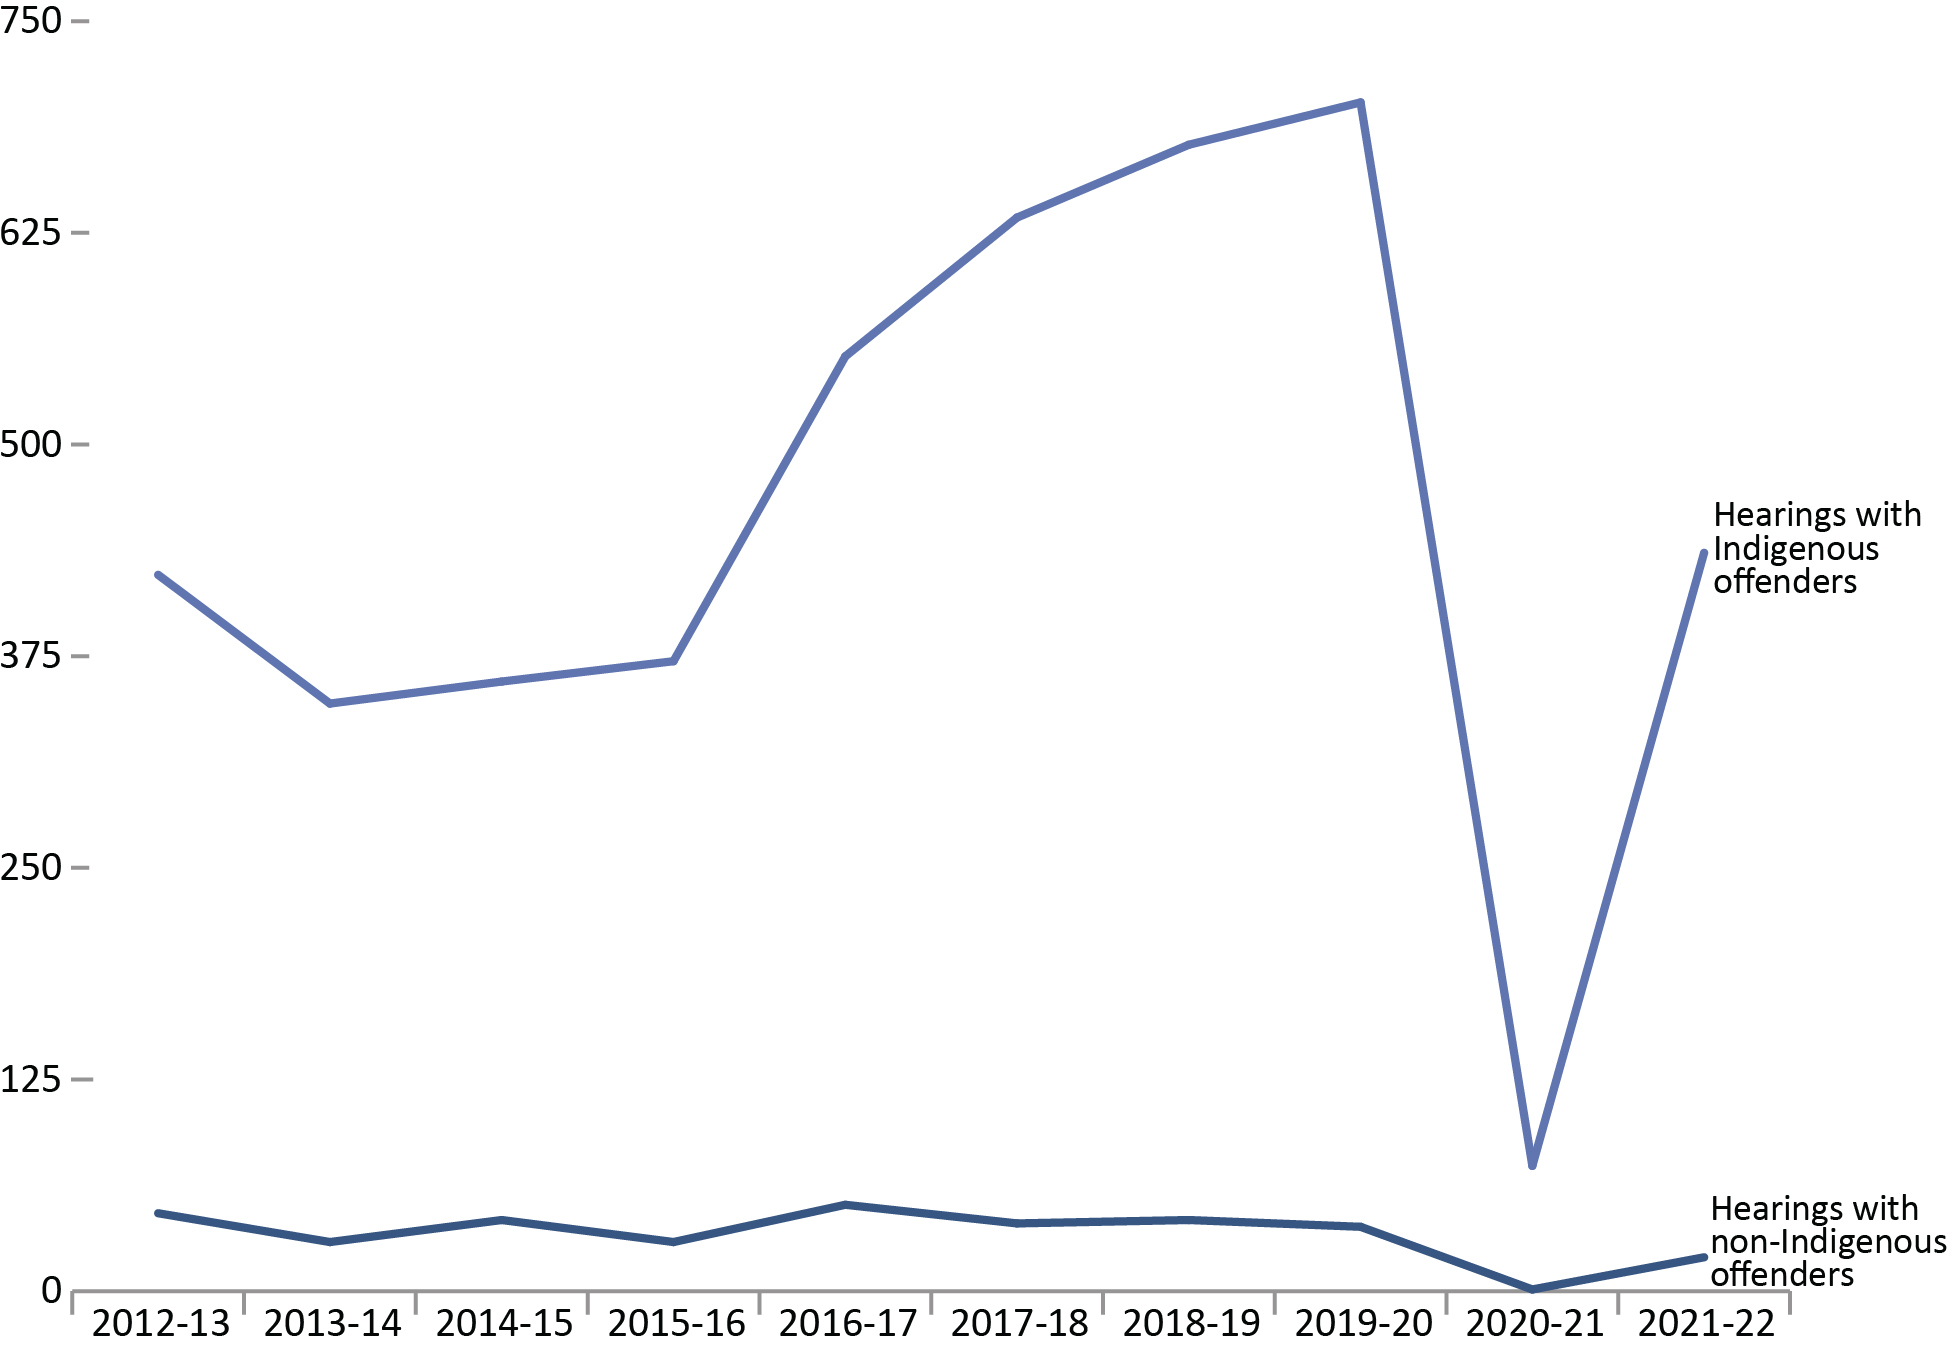
Image description
Line graph showing the number of federal Elder-assisted parole hearings, between fiscal year 2012 to 2013 and fiscal year 2021 to 2022. Across time, there were far more Elder-assisted hearings with Indigenous offenders than with non-Indigenous offenders. Hearings with Indigenous offenders dropped from 423 hearings in fiscal year 2012 to 2013 to 347 hearings in fiscal year 2013 to 2014, then rose steadily to a peak of 702 hearings in fiscal year 2019 to 2020, then dropped dramatically to 74 hearings in fiscal year 2020 to 2021, and then rose to 436 hearings in fiscal year 2021 to 2022. Elder-assisted parole hearings for non-Indigenous offenders fluctuated between 29 and 46 hearings between fiscal year 2012 to 2013 and fiscal year 2015 to 2016, in fiscal year 2016 to 2017 it reached its peak with 51 hearings, then dropping to a low of 1 hearing in fiscal year 202 to 2021. Full data are available immediately below.
Source: Parole Board of Canada.
- After reporting a decrease of 89.9% in 2020-21 due to health and safety measures put in place to address the COVID-19 pandemic, the number of federal Elder-Assisted parole hearings increased significantly in 2021-22 (to 456 from 75).
- In 2021-22, 28.3% (436) of all federal parole hearings involving Indigenous offenders were Elder-Assisted Hearings.
- In 2021-22, 0.5% (20) of all federal parole hearings for offenders who did not self-identify as Indigenous were Elder-Assisted Hearings.
Figure D5 Notes
The term Elder also refers to a Cultural Advisor as defined in section 11.1.1.5 of the Decision-Making Policy Manual.
The presence of an Elder is an alternative approach to the traditional parole hearing, and was introduced by the Parole Board of Canada to ensure that conditional release hearings are sensitive to Indigenous cultural values and traditions. This type of hearing is available to both Indigenous and non-Indigenous offenders.
Reported year periods reflect fiscal years. A fiscal year runs from April 1 to March 31 of the following year.
| Fiscal year | Indigenous offenders | Non-Indigenous offenders | All offenders | ||||||
|---|---|---|---|---|---|---|---|---|---|
| Total hearings | With an Elder | Total hearings | With an Elder | Total hearings | With an Elder | ||||
| # | # | % | # | # | % | # | # | % | |
| 2012-13 | 1,329 | 423 | 31.8 | 4,615 | 46 | 1.0 | 5,944 | 469 | 7.9 |
| 2013-14 | 947 | 347 | 36.6 | 3,641 | 29 | 0.8 | 4,588 | 376 | 8.2 |
| 2014-15 | 896 | 360 | 40.2 | 3,805 | 42 | 1.1 | 4,701 | 402 | 8.6 |
| 2015-16 | 973 | 372 | 38.2 | 3,937 | 29 | 0.7 | 4,910 | 401 | 8.2 |
| 2016-17 | 1,312 | 552 | 42.1 | 4,468 | 51 | 1.1 | 5,780 | 603 | 10.4 |
| 2017-18 | 1,559 | 634 | 40.7 | 4,826 | 40 | 0.8 | 6,385 | 674 | 10.6 |
| 2018-19 | 1,637 | 677 | 41.4 | 4,923 | 42 | 0.9 | 6,560 | 719 | 11.0 |
| 2019-20 | 1,602 | 702 | 43.8 | 4,530 | 38 | 0.8 | 6,132 | 740 | 12.1 |
| 2020-21 | 1,735 | 74 | 4.3 | 4,389 | 1 | <0.1 |
6,124 | 75 | 1.2 |
| 2021-22 | 1,541 | 436 | 28.3 | 3,806 | 20 | 0.5 | 5,347 | 456 | 8.5 |
Source: Parole Board of Canada.
Table D5 Notes
The term Elder also refers to a Cultural Advisor as defined in section 11.1.1.5 of the Decision-Making Policy Manual.
The presence of an Elder is an alternative approach to the traditional parole hearing, and was introduced by the Parole Board of Canada to ensure that conditional release hearings are sensitive to Indigenous cultural values and traditions. This type of hearing is available to both Indigenous and non-Indigenous offenders. Due to self-identification, past “Indigenous” and “Non-Indigenous” offender figures may fluctuate from one report to another.
Reported year periods reflect fiscal years. A fiscal year runs from April 1 to March 31 of the following year.
Proportion of sentence served prior to being released on parole: 10-year trend
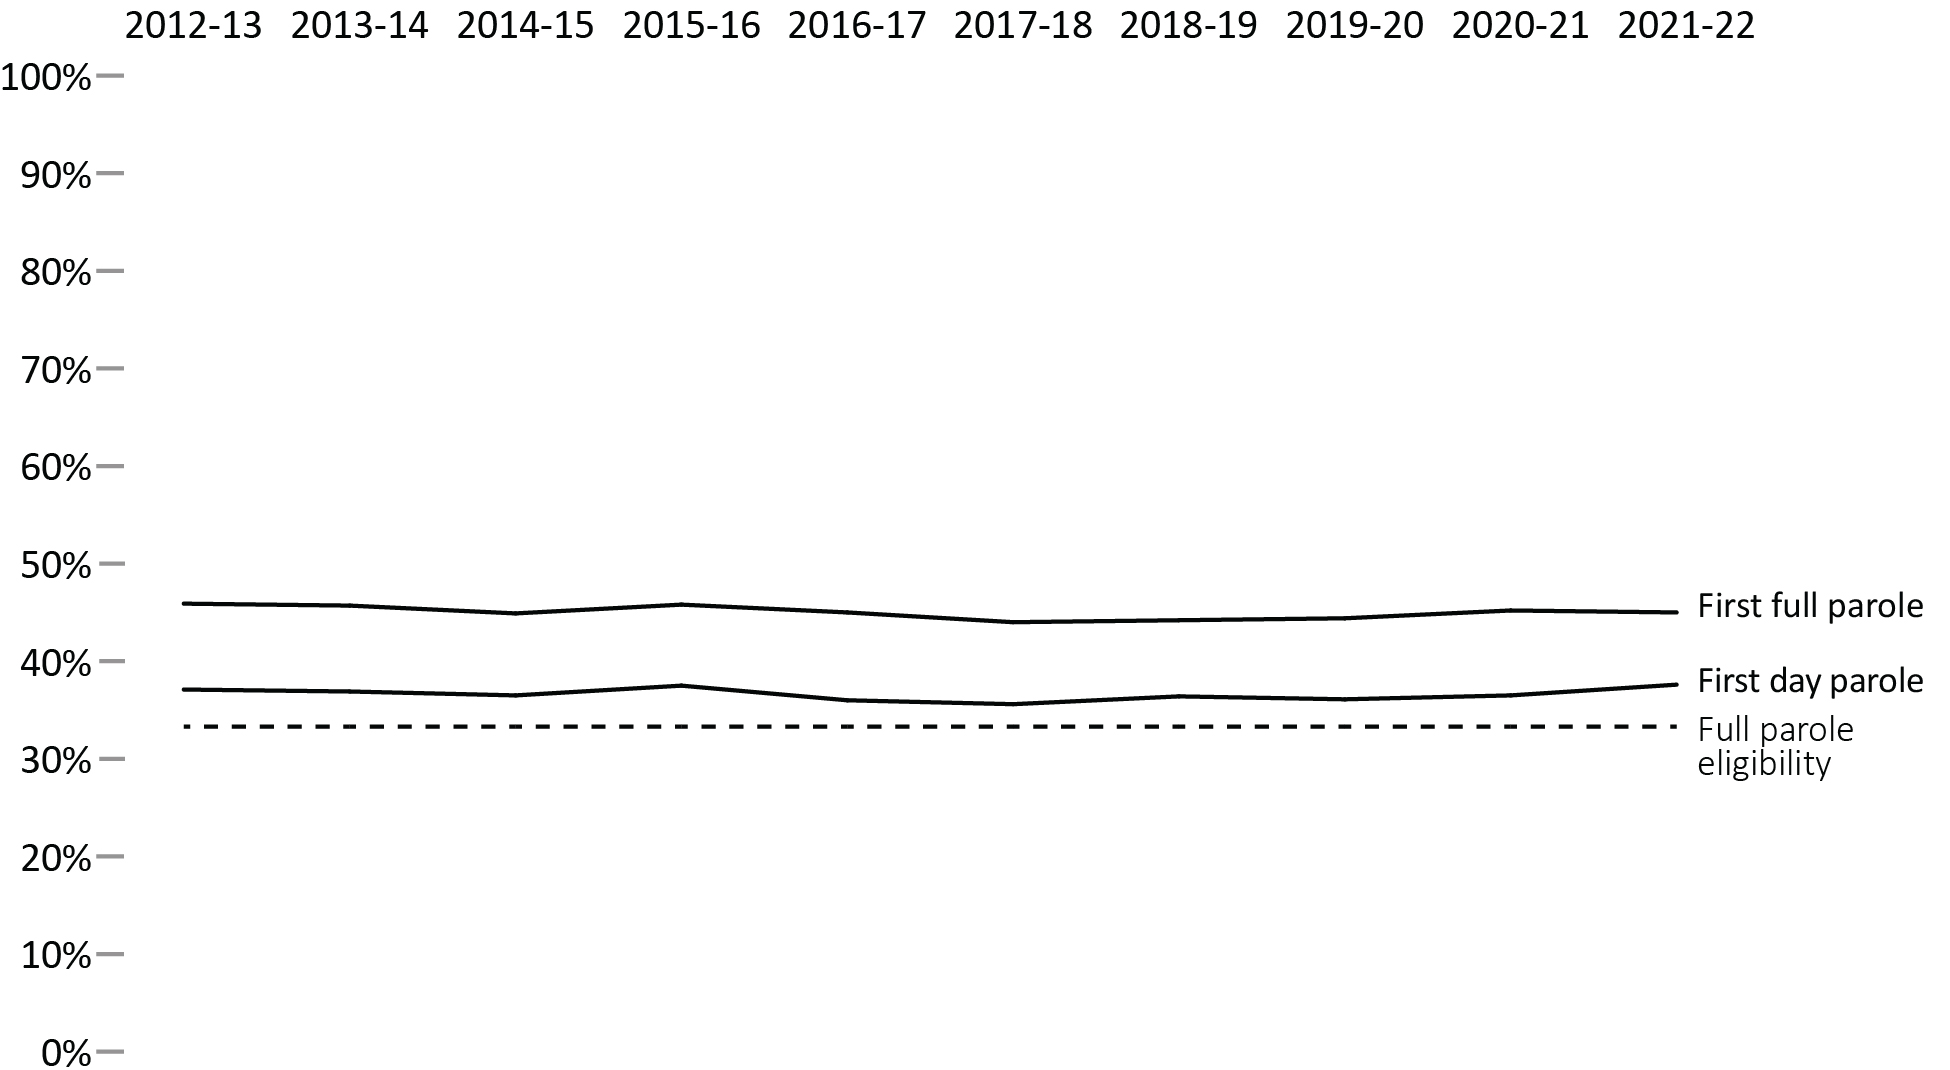
Image description
Line graph showing the proportion of an offender's sentence that has been served in custody before their first federal parole, between fiscal year 2012 to 2013 and fiscal year 2021 to 2022, for first full parole and for first day parole. The graph includes a dotted line around the 35 percent mark to indicate when full parole eligibility begins. First full parole was granted at just over 45 percent in fiscal year 2012 to 2013 and remained relatively stable over time. Meanwhile, first federal day parole was granted between 35 percent and 37 percent during the same time period. Full data are available immediately below.
Source: Parole Board of Canada.
- In 2021-22, the average proportion of sentence served before the first federal day parole release for offenders serving determinate sentences increased 1.1% to 37.6% from the previous year.
- The proportion of sentence served prior to the first federal full parole release for offenders serving determinate sentences remained stable (45.0%; -0.2%) in 2021-22 when compared to the previous year.
- In 2021-22, male offenders served a higher proportion of their sentences before being released on their first federal day parole and full parole (38.1%; 45.4%) than female offenders (34.5%; 42.0%).
- In 2021-22, female offenders served an average of 3.3% less of their sentence prior to their first federal day parole release while male offenders served an average of 1.1% more of their sentence prior to their first federal day parole release compared to 2012-13.
- In 2021-22, female offenders served an average of 2.9% less of their sentence before their first federal full parole release while the average proportion of sentence served by male offenders before their first federal full parole release remained relatively stable (-0.6%) compared to 2012-13.
Figure D6 Notes
Full parole is a type of conditional release granted by the Parole Board of Canada in which the remainder of the sentence is served under supervision in the community. The Parole Board of Canada must review the cases of all offenders for full parole at the time prescribed by legislation, unless the offender advises the Parole Board of Canada in writing that they do not wish to be considered for full parole.
Day parole is a type of conditional release granted by the Parole Board of Canada in which offenders are permitted to participate in community-based activities in preparation for full parole or statutory release. The conditions require offenders to return nightly to an institution, half-way house, or other location deemed appropriate for managing their risk, unless otherwise authorized by the Parole Board of Canada. Not all offenders apply for day parole, and some apply more than once before being granted day parole.
Timing of parole in the sentence refers to the percentage of the sentence served at the time the first day parole or full parole starts during the sentence. In most cases a full parole is preceded by a day parole. These calculations are based on sentences under federal jurisdiction, excluding life sentences and indeterminate sentences. Offenders (other than those serving life or indeterminate sentences or subject to judicial determination) normally become eligible for full parole after serving 1/3 of their sentence or 7 years, whichever is less. Eligibility for day parole is normally at 6 months before full parole eligibility.
Reported year periods reflect fiscal years. A fiscal year runs from April 1 to March 31 of the following year.
| Fiscal year | First federal day parole | First federal full parole | ||||
|---|---|---|---|---|---|---|
| Females | Males | Total | Females | Males | Total | |
| 2012-13 | 37.8 | 37.0 | 37.1 | 44.9 | 46.0 | 45.9 |
| 2013-14 | 33.9 | 37.2 | 36.9 | 43.3 | 45.9 | 45.7 |
| 2014-15 | 34.3 | 36.8 | 36.5 | 43.8 | 45.0 | 44.9 |
| 2015-16 | 36.1 | 37.7 | 37.5 | 44.6 | 46.0 | 45.8 |
| 2016-17 | 32.5 | 36.5 | 36.0 | 42.9 | 45.3 | 45.0 |
| 2017-18 | 32.1 | 36.1 | 35.6 | 41.4 | 44.4 | 44.0 |
| 2018-19 | 31.6 | 37.0 | 36.4 | 41.1 | 44.6 | 44.2 |
| 2019-20 | 30.0 | 36.9 | 36.1 | 41.2 | 44.8 | 44.4 |
| 2020-21 | 33.0 | 36.9 | 36.5 | 42.2 | 45.6 | 45.2 |
| 2021-22 | 34.5 | 38.1 | 37.6 | 42.0 | 45.4 | 45.0 |
Source: Parole Board of Canada.
Table D6 Notes
Full parole is a type of conditional release granted by the Parole Board of Canada in which the remainder of the sentence is served under supervision in the community. The Parole Board of Canada must review the cases of all offenders for full parole at the time prescribed by legislation, unless the offender advises the Parole Board of Canada in writing that they do not wish to be considered for full parole.
Day parole is a type of conditional release granted by the Parole Board of Canada in which offenders are permitted to participate in community-based activities in preparation for full parole or statutory release. The conditions require offenders to return nightly to an institution, half-way house, or other location deemed appropriate for managing their risk, unless otherwise authorized by the Parole Board of Canada. Not all offenders apply for day parole, and some apply more than once before being granted day parole.
Timing of parole in the sentence refers to the percentage of the sentence served at the time the first day parole or full parole starts during the sentence. In most cases a full parole is preceded by a day parole. These calculations are based on sentences under federal jurisdiction, excluding life sentences and indeterminate sentences. Offenders (other than those serving life or indeterminate sentences or subject to judicial determination) normally become eligible for full parole after serving 1/3 of their sentence or 7 years, whichever is less. Eligibility for day parole is normally at 6 months before full parole eligibility.
Reported year periods reflect fiscal years. A fiscal year runs from April 1 to March 31 of the following year.
Proportion of sentence served prior to being released on parole by Indigenous and non-Indigenous offenders: 10-year trend
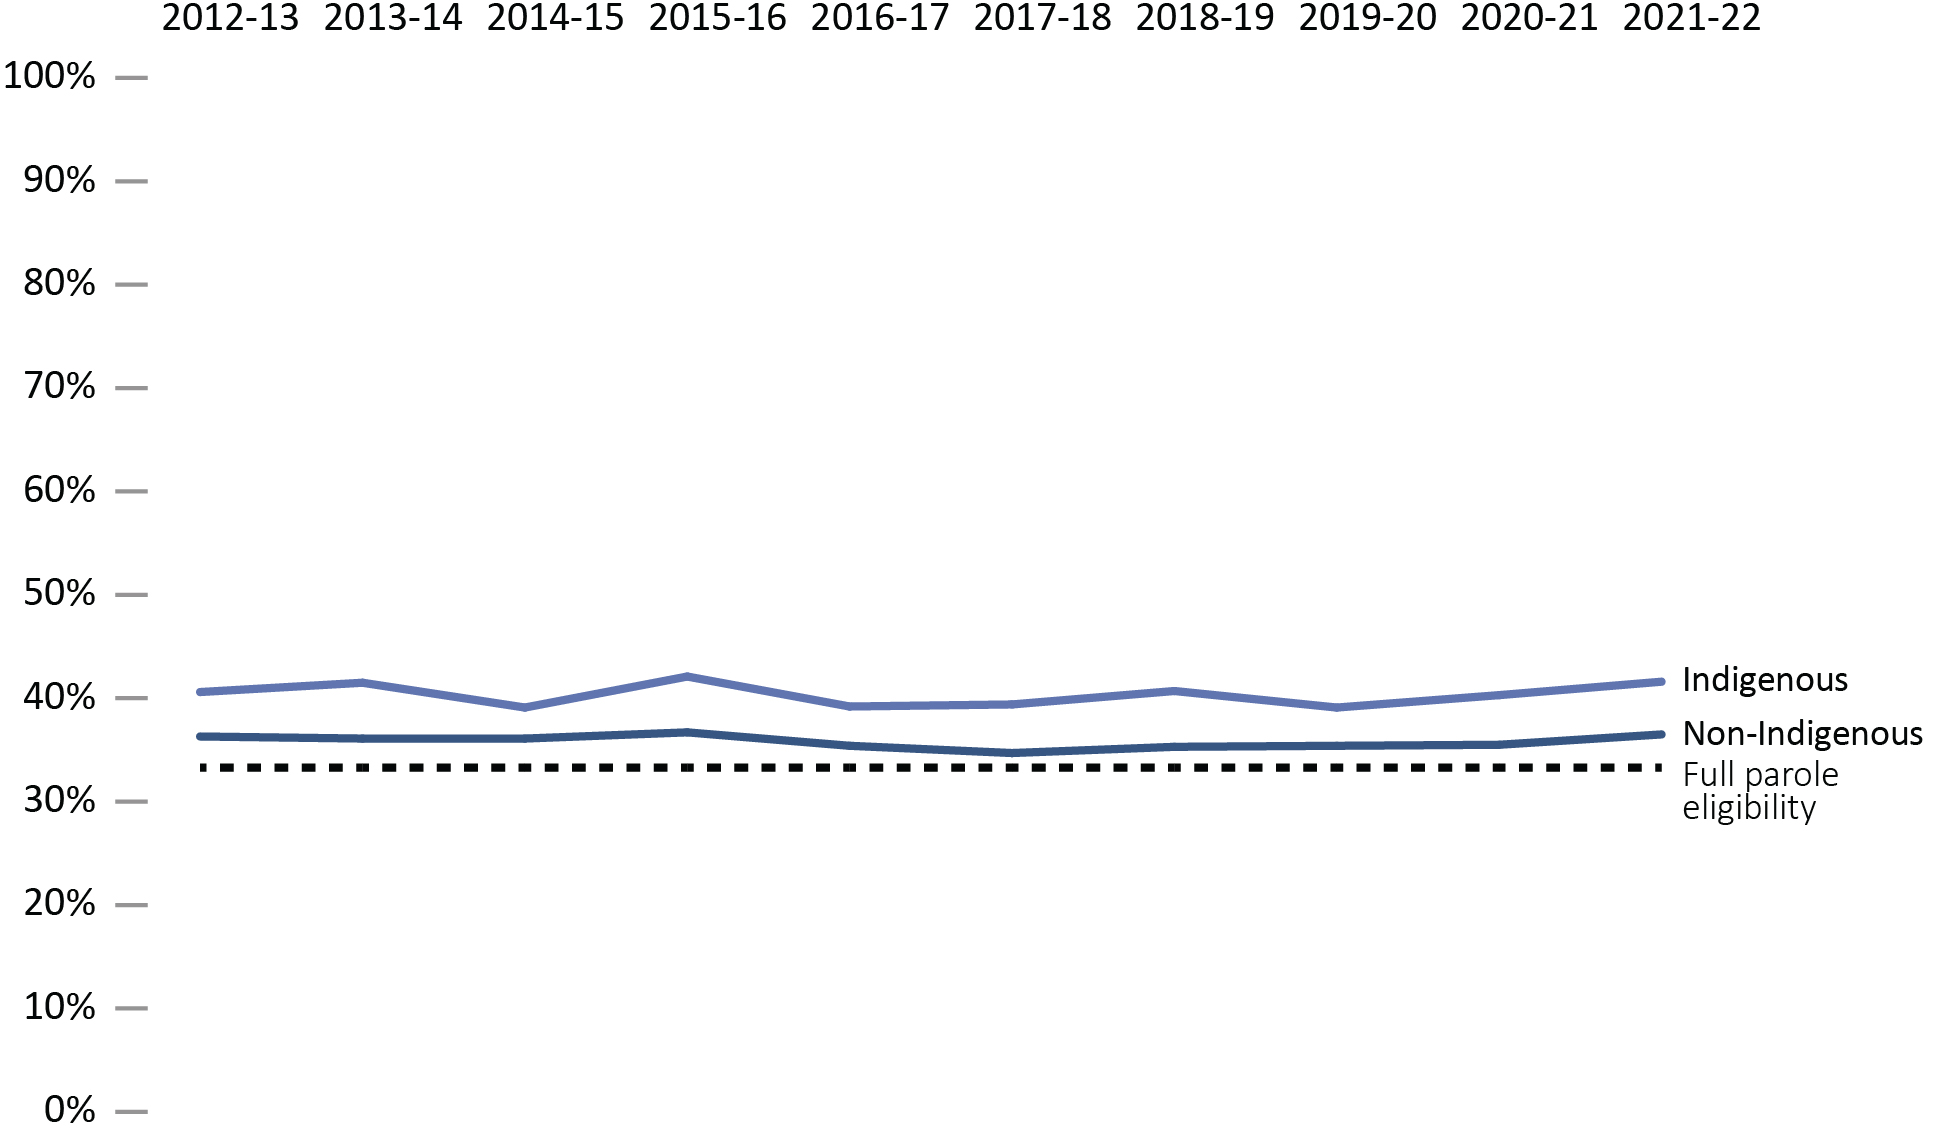
Image description
Line graph showing the proportion of offenders' sentences that are served in custody before their first federal day parole, between fiscal year 2012 to 2013 and fiscal year 2021 to 2022, by Indigenous and non-Indigenous identity groups. The graph includes a dotted line around the 35 percent mark to indicate when full parole eligibility begins. Indigenous offenders consistently served a higher proportion of their sentence prior to being released on day parole compared to non-Indigenous offenders. The proportion of sentence served for Indigenous offenders fluctuated between 39 percent and 42 percent, while the proportion of sentence served for non-Indigenous offenders fluctuated between 35 percent and 36 percent. Full data are available immediately below.
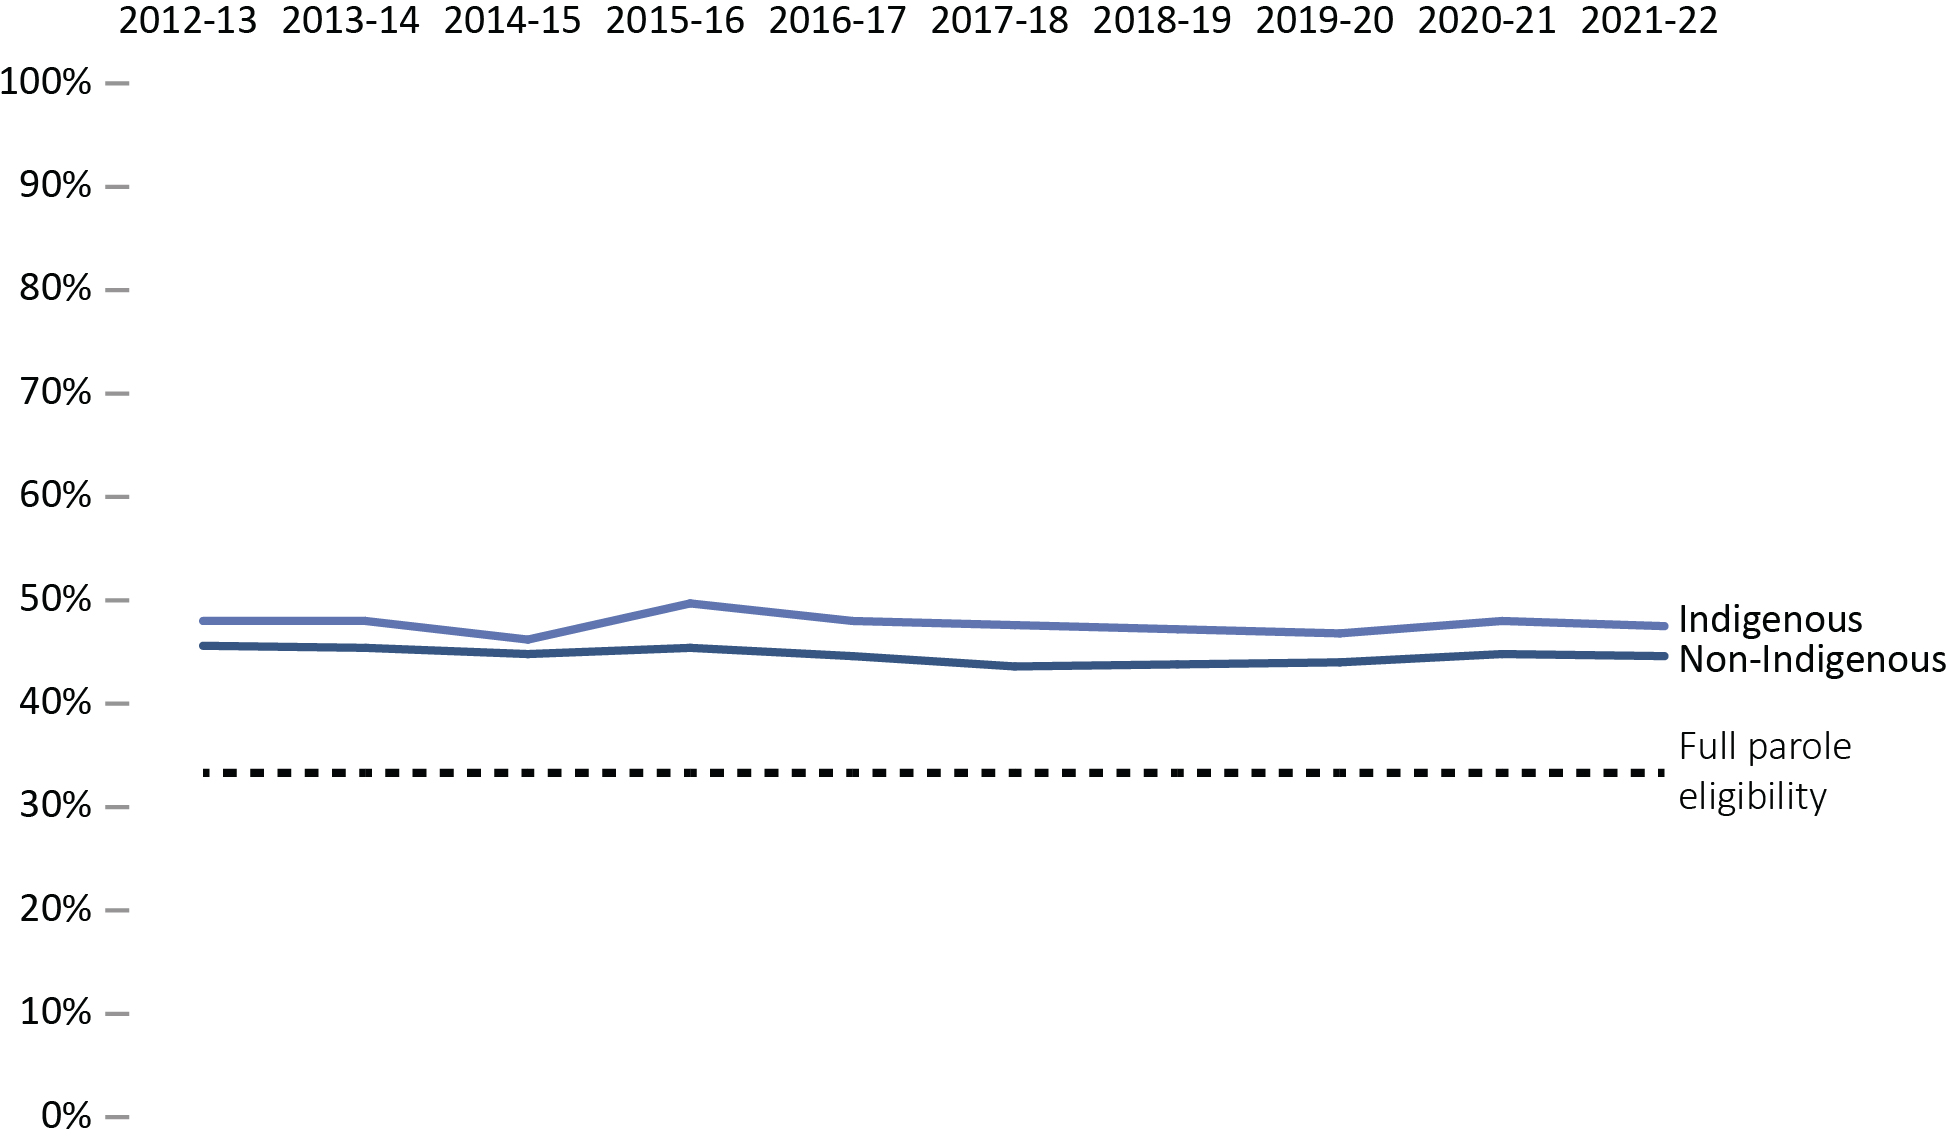
Image description
Line graph showing the proportion of offenders' sentences that are served in custody before their first federal full parole, between fiscal year 2012 to 2013 and fiscal year 2021 to 2022, by Indigenous and non-Indigenous identity groups. The graph includes a dotted line around the 35 percent mark to indicate when full parole eligibility begins. Indigenous offenders consistently served a higher proportion of their sentence prior to being released on full parole compared to non-Indigenous offenders. The proportion of sentence served for Indigenous offenders fluctuated between 46 percent and 48 percent, while the proportion of sentence served for non-Indigenous offenders fluctuated between 43 percent and 45 percent. Full data are available immediately below.
Source: Parole Board of Canada.
- In 2021-22, Indigenous offenders served higher proportions of their sentences before being released on their first federal day parole and full parole (41.6%; 47.5%) than non-Indigenous offenders (36.5%; 44.6%).
- In 2021-22, Indigenous offenders served an average of 1.0% more of their sentence before their first federal day parole release while the average proportion of sentence served by non-Indigenous offenders before their first federal day parole release remained stable (+0.2%) compared to 2012-13.
- In 2021-22, the average proportion of sentence served by Indigenous offenders before their first federal full parole release remained stable (-0.5%) while non-Indigenous offenders served an average of 1.0% less of their sentences before their first federal full parole release compared to 2012-13.
Figure D7 Notes
Full parole is a type of conditional release granted by the Parole Board of Canada in which the remainder of the sentence is served under supervision in the community. The Parole Board of Canada must review the cases of all offenders for full parole at the time prescribed by legislation, unless the offender advises the Parole Board of Canada in writing that they do not wish to be considered for full parole.
Day parole is a type of conditional release granted by the Parole Board of Canada in which offenders are permitted to participate in community-based activities in preparation for full parole or statutory release. The conditions require offenders to return nightly to an institution, half-way house, or other location deemed appropriate for managing their risk, unless otherwise authorized by the Parole Board of Canada. Not all offenders apply for day parole, and some apply more than once before being granted day parole.
Timing of parole in the sentence refers to the percentage of the sentence served at the time the first day parole or full parole starts during the sentence. In most cases a full parole is preceded by a day parole. These calculations are based on sentences under federal jurisdiction, excluding life sentences and indeterminate sentences. Offenders (other than those serving life or indeterminate sentences or subject to judicial determination) normally become eligible for full parole after serving 1/3 of their sentence or 7 years, whichever is less. Eligibility for day parole is normally at 6 months before full parole eligibility.
Reported year periods reflect fiscal years. A fiscal year runs from April 1 to March 31 of the following year.
| Fiscal year | First federal day parole | First federal full parole | ||||
|---|---|---|---|---|---|---|
| Indigenous | Non- Indigenous | Total | Indigenous | Non- Indigenous | Total | |
| 2012-13 | 40.6 | 36.3 | 37.1 | 48.0 | 45.6 | 45.9 |
| 2013-14 | 41.5 | 36.1 | 36.9 | 48.0 | 45.4 | 45.7 |
| 2014-15 | 39.1 | 36.1 | 36.5 | 46.2 | 44.8 | 44.9 |
| 2015-16 | 42.1 | 36.7 | 37.5 | 49.7 | 45.4 | 45.8 |
| 2016-17 | 39.2 | 35.4 | 36.0 | 48.0 | 44.6 | 45.0 |
| 2017-18 | 39.4 | 34.7 | 35.6 | 47.6 | 43.6 | 44.0 |
| 2018-19 | 40.7 | 35.3 | 36.4 | 47.2 | 43.8 | 44.2 |
| 2019-20 | 39.1 | 35.4 | 36.1 | 46.8 | 44.0 | 44.4 |
| 2020-21 | 40.3 | 35.5 | 36.5 | 48.0 | 44.8 | 45.2 |
| 2021-22 | 41.6 | 36.5 | 37.6 | 47.5 | 44.6 | 45.0 |
Source: Parole Board of Canada.
Table D7 Notes
Full parole is a type of conditional release granted by the Parole Board of Canada in which the remainder of the sentence is served under supervision in the community. The Parole Board of Canada must review the cases of all offenders for full parole at the time prescribed by legislation, unless the offender advises the Parole Board of Canada in writing that they do not wish to be considered for full parole.
Day parole is a type of conditional release granted by the Parole Board of Canada in which offenders are permitted to participate in community-based activities in preparation for full parole or statutory release. The conditions require offenders to return nightly to an institution, half-way house, or other location deemed appropriate for managing their risk, unless otherwise authorized by the Parole Board of Canada. Not all offenders apply for day parole, and some apply more than once before being granted day parole.
Timing of parole in the sentence refers to the percentage of the sentence served at the time the first day parole or full parole starts during the sentence. In most cases a full parole is preceded by a day parole. These calculations are based on sentences under federal jurisdiction, excluding life sentences and indeterminate sentences. Offenders (other than those serving life or indeterminate sentences or subject to judicial determination) normally become eligible for full parole after serving 1/3 of their sentence or 7 years, whichever is less. Eligibility for day parole is normally at 6 months before full parole eligibility.
Reported year periods reflect fiscal years. A fiscal year runs from April 1 to March 31 of the following year.
Outcome of federal day parole supervision periods
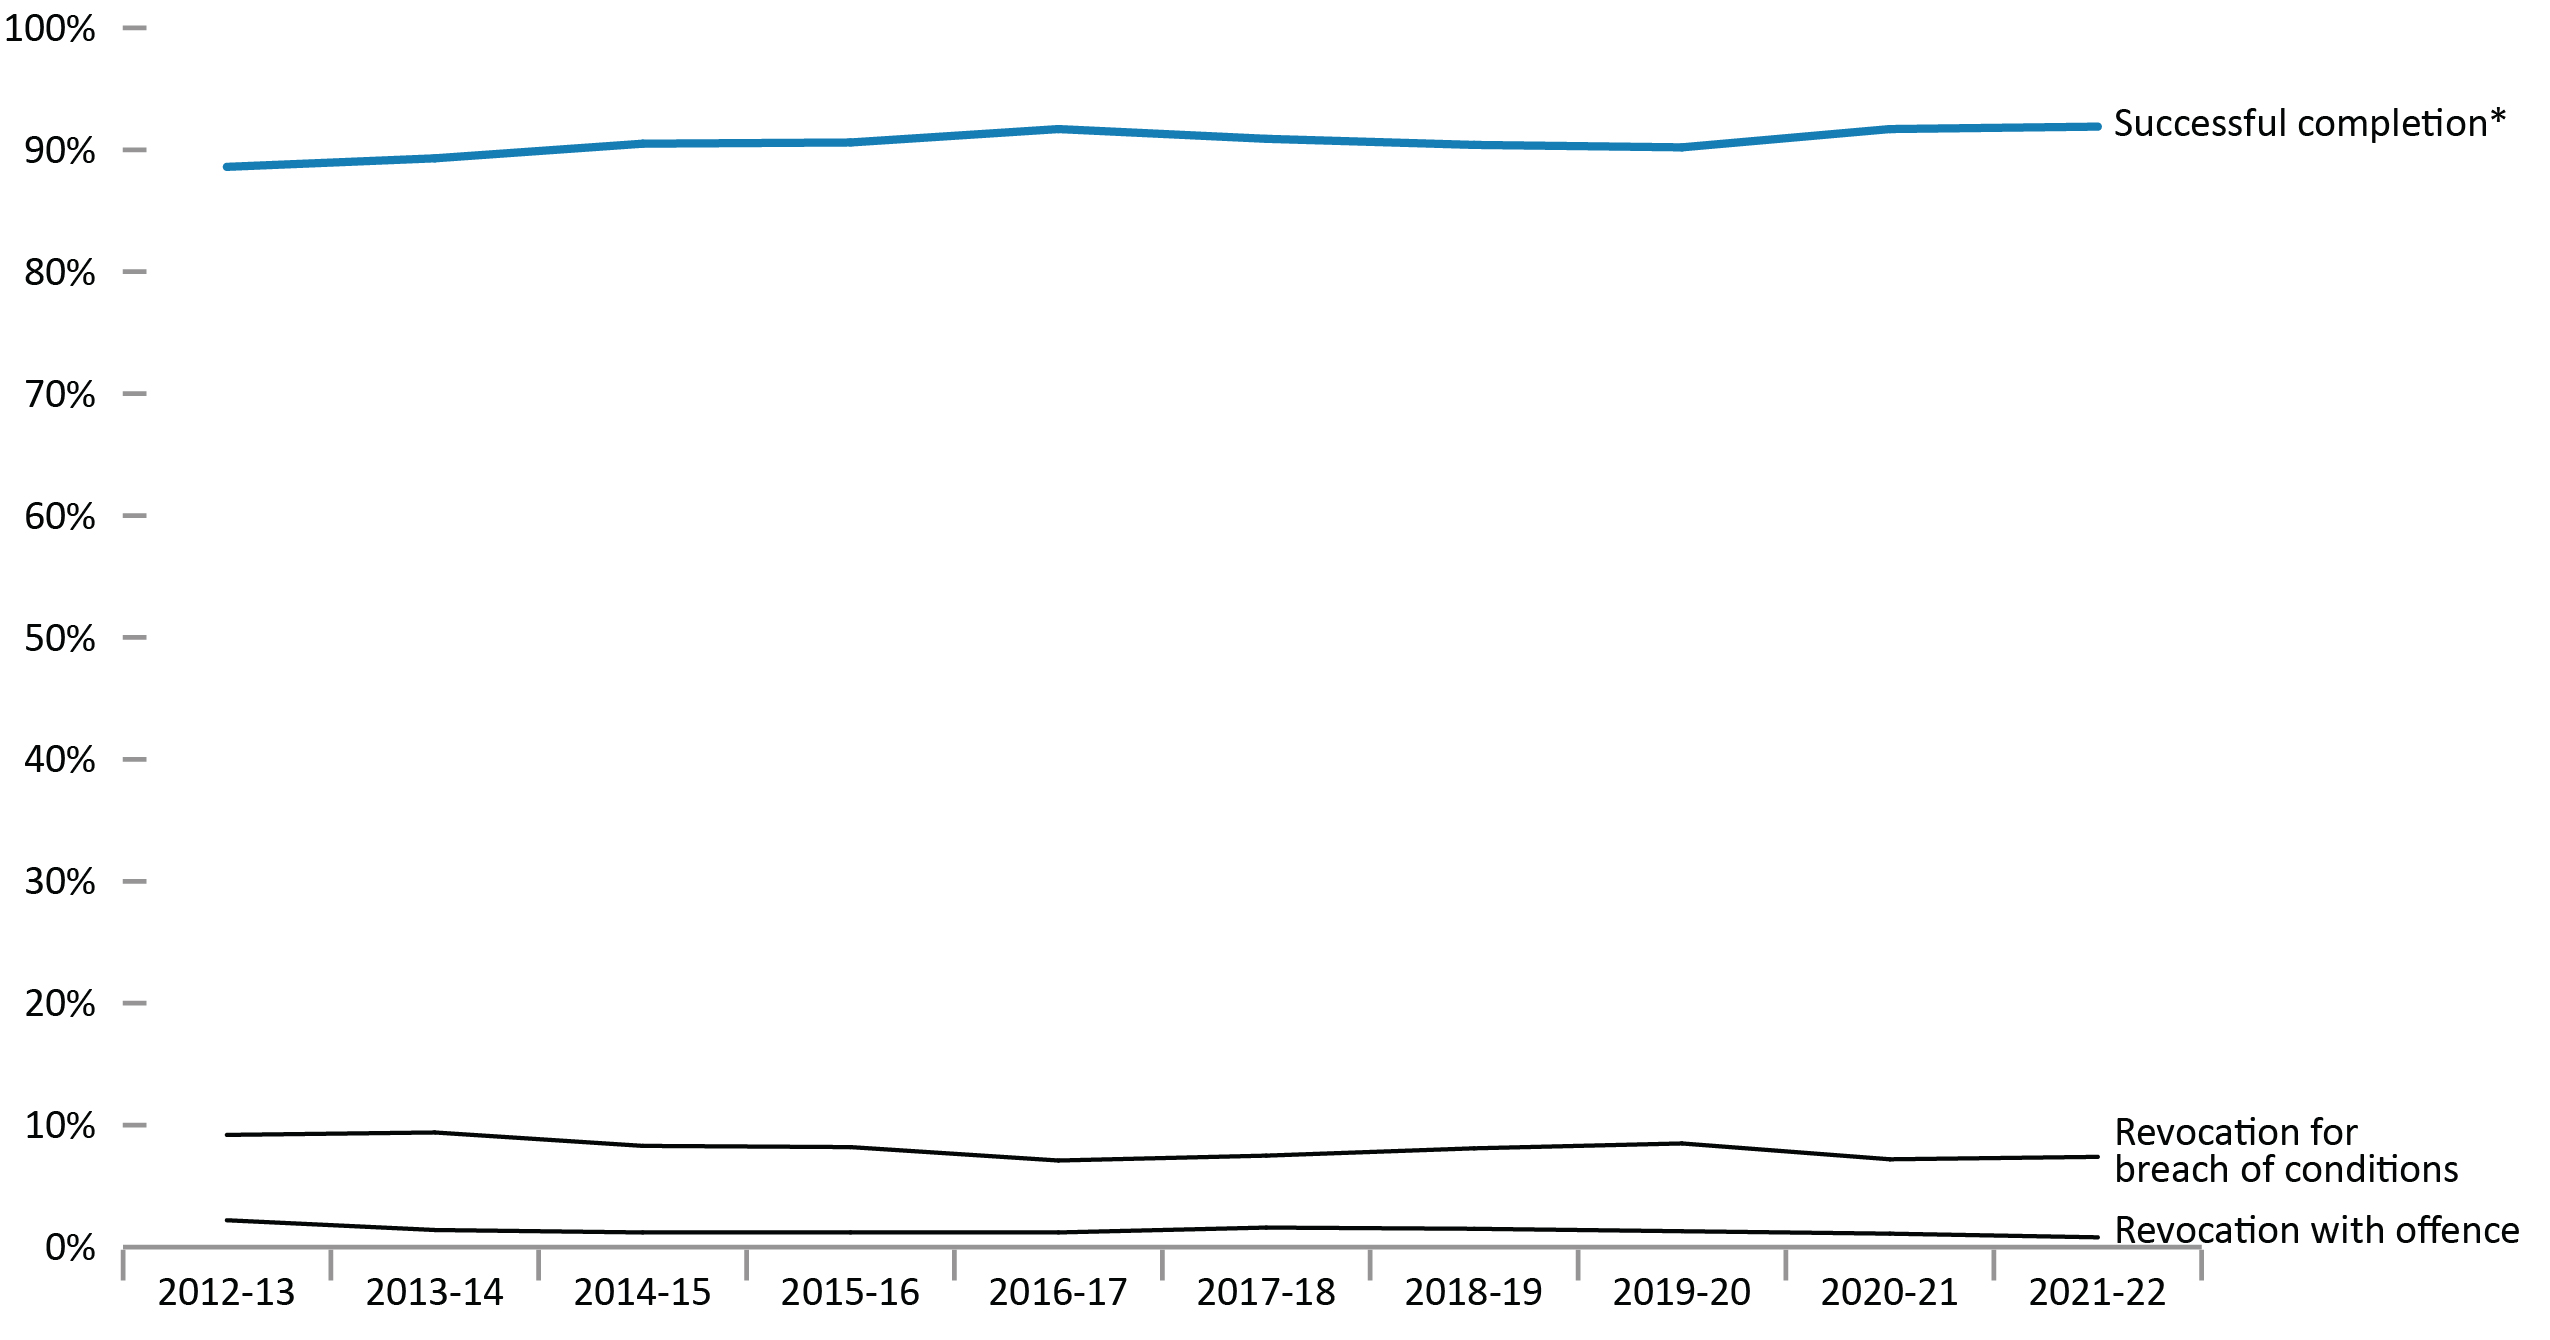
Image description
Line graph showing the outcome of federal day parole supervision periods from fiscal year 2012 to 2013 until fiscal year 2021 to 2022. Successful completion of day parole rose steadily over time, reaching a peak of 91.9 percent in fiscal year 2021 to 2022. Revocation for breach of conditions remained relatively stable over time, fluctuating between 7.2 percent and 8.5 percent. Revocation with offence was the least common outcome with less than 1.5 percent each year. Full data are available immediately below.
Source: Parole Board of Canada.
- In the past 10 years (from 2012-13 to 2021-22), the successful completionFootnote * rate of federal day parole supervision periods was on average 90.6%.
- In 2021-22, the successful completionFootnote * rate of federal day parole supervision periods remained stable (91.9%; +0.2%) compared to 2020-21.
- During the 5-year period between 2017-18 and 2021-22, the successful completionFootnote * rate of federal regular day parole supervision periods was on average 4.7% lower than the rate of federal accelerated parole review (APR) day parole supervision periods (90.9% and 95.6%, respectively).
- The rate of violent reoffending of federal day parole supervision periods has been very low in the past 5 years, averaging 0.2%.
| Federal day parole outcomes | 2017-18 | 2018-19 | 2019-20 | 2020-21 | 2021-22 | |||||
|---|---|---|---|---|---|---|---|---|---|---|
| # | % | # | % | # | % | # | % | # | % | |
| Successful completionFootnote * | ||||||||||
Regular |
3,469 | 90.9 | 3,628 | 90.2 | 3,714 | 90.1 | 3,523 | 91.6 | 2,991 | 91.8 |
Accelerated |
84 | 93.3 | 75 | 98.7 | 57 | 91.9 | 42 | 97.7 | 24 | 100 |
Total |
3,553 | 90.9 | 3,703 | 90.4 | 3,771 | 90.2 | 3,565 | 91.7 | 3,015 | 91.9 |
| Revocation for breach of conditions | ||||||||||
Regular |
287 | 7.5 | 329 | 8.2 | 353 | 8.6 | 280 | 7.3 | 242 | 7.4 |
Accelerated |
6 | 6.7 | 1 | 1.3 | 4 | 6.5 | 0 | 0.0 | 0 | 0.0 |
Total |
293 | 7.5 | 330 | 8.1 | 357 | 8.5 | 280 | 7.2 | 242 | 7.4 |
| Revocation with non-violent offence | ||||||||||
Regular |
55 | 1.4 | 55 | 1.4 | 45 | 1.1 | 33 | 0.9 | 25 | 0.8 |
Accelerated |
0 | 0.0 | 0 | 0.0 | 1 | 1.6 | 1 | 2.3 | 0 | 0.0 |
Total |
55 | 1.4 | 55 | 1.3 | 46 | 1.1 | 34 | 0.9 | 25 | 0.8 |
| Revocation with violent offence | ||||||||||
Regular |
7 | 0.2 | 8 | 0.2 | 9 | 0.2 | 9 | 0.2 | 0.0 | 0.0 |
Accelerated |
0 | 0.0 | 0 | 0.0 | 0 | 0.0 | 0 | 0.0 | 0.0 | 0.0 |
Total |
7 | 0.2 | 8 | 0.2 | 9 | 0.2 | 9 | 0.2 | 0.0 | 0.0 |
| Total regular | 3,818 | 97.7 | 4,020 | 98.1 | 4,121 | 98.5 | 3,845 | 98.9 | 3,258 | 99.3 |
| Total accelerated | 90 | 2.3 | 76 | 1.9 | 62 | 1.5 | 43 | 1.1 | 24 | 0.7 |
| Total (regular and accelerated) | 3,908 | 100 | 4,096 | 100 | 4,183 | 100 | 3,888 | 100 | 3,282 | 100 |
Source: Parole Board of Canada.
Outcome of federal full parole supervision periods
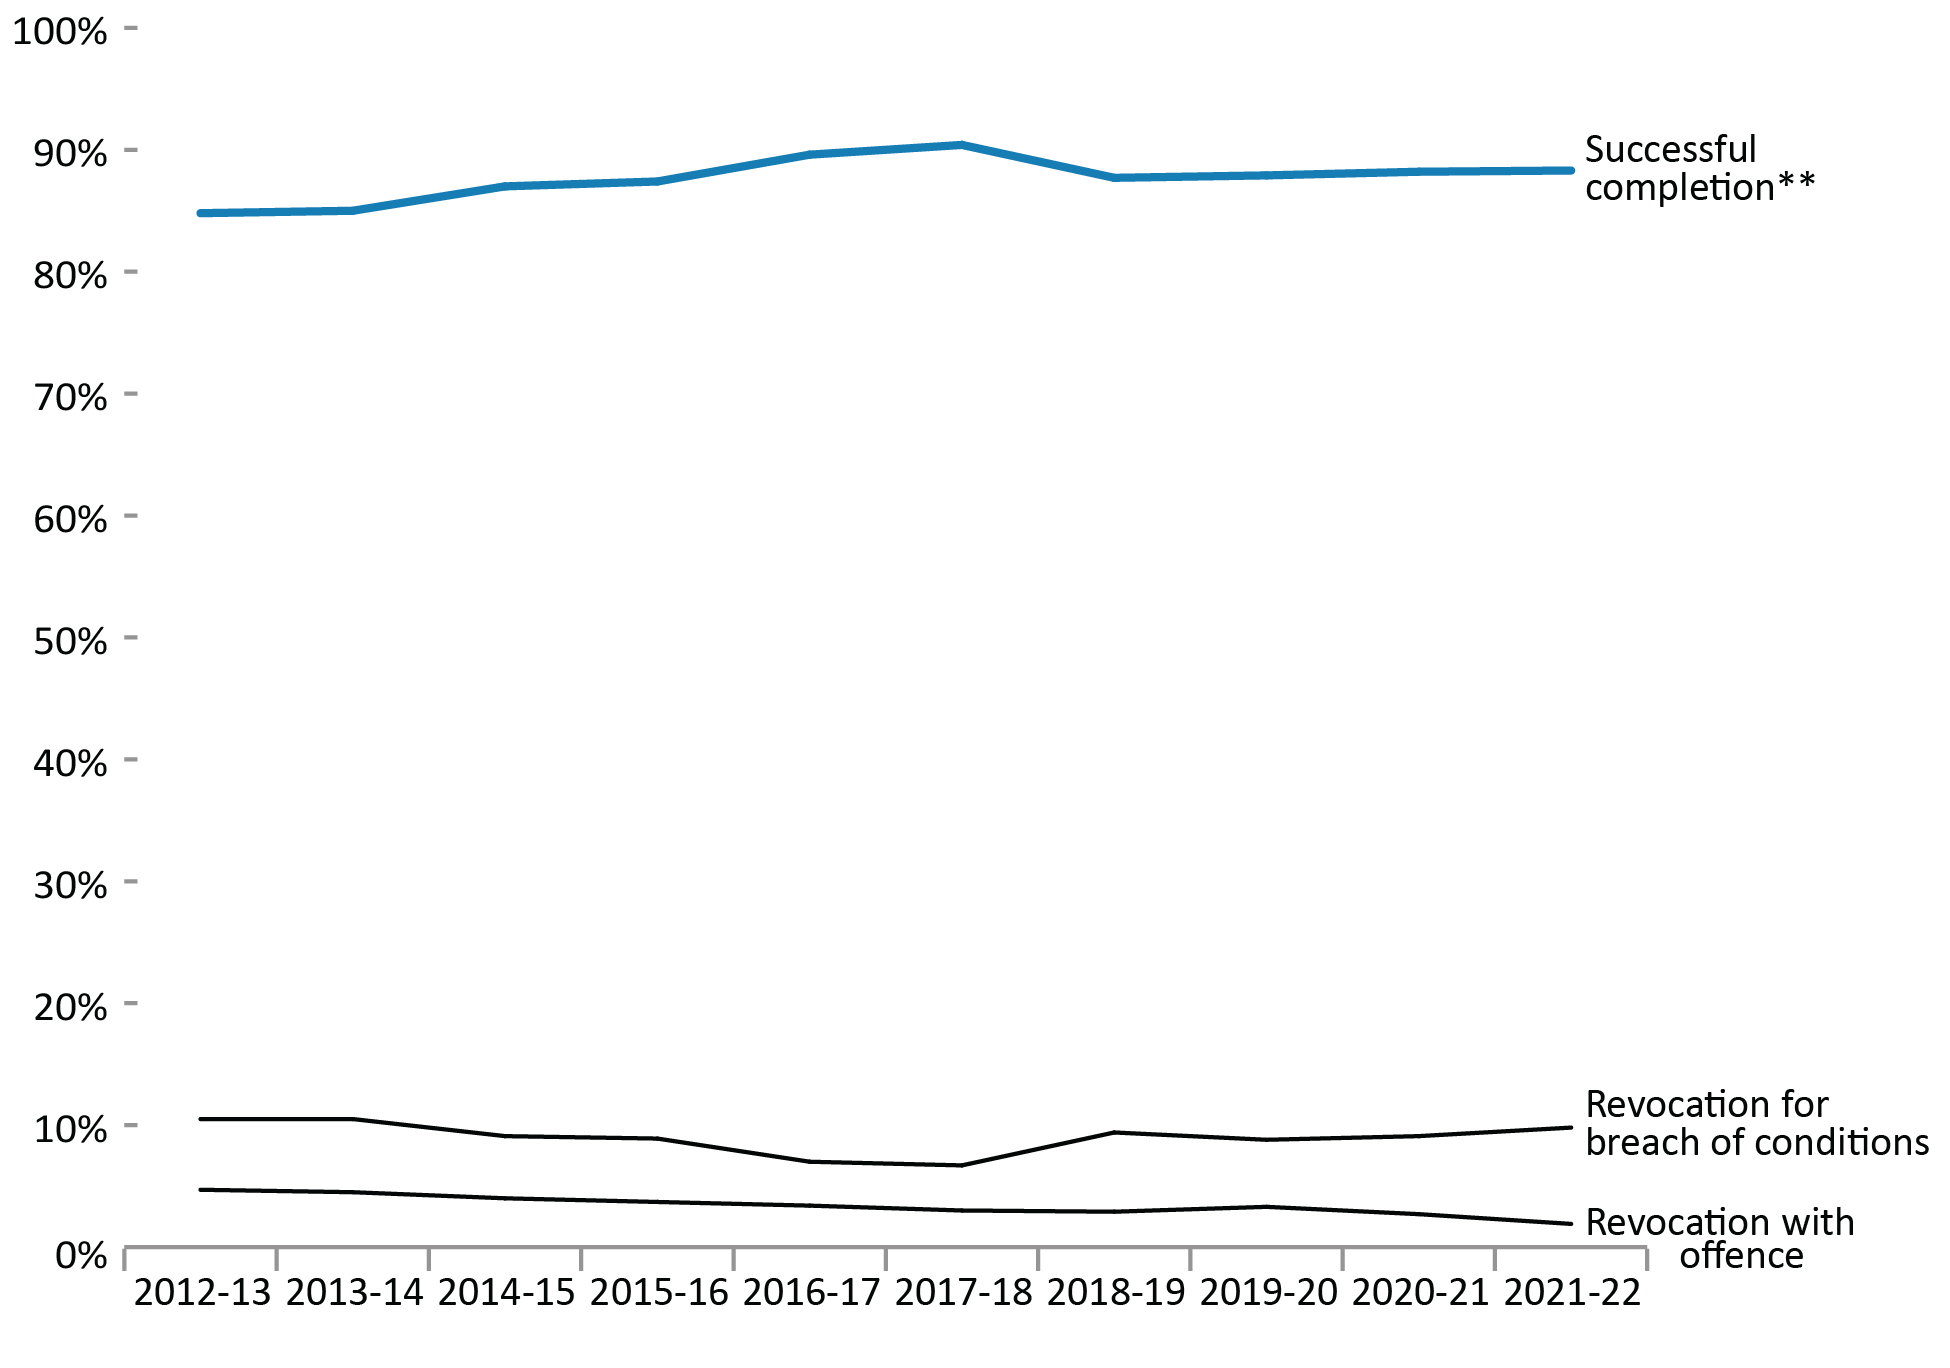
Image description
Line graph showing the outcome of federal full parole supervision periods from fiscal year 2012 to 2013 until fiscal year 2021 to 2022. Successful completion of full parole rose to a peak of 90.4 percent in fiscal year 2017 to 2018, after which point it fluctuated between 87.7 percent and 88.3 percent. Revocation for breach of conditions declined steadily to a low of 6.7 percent in fiscal year 2017 to 2018, after which point it rose to 9.8 percent in fiscal year 2021 to 2022 with minor fluctuations. Revocation with offence was the lowest percentage, with below 5 percent over time. Full data are available immediately below.
Source: Parole Board of Canada.
- In the past 10 years (from 2012-13 to 2021-22), the successful completionFootnote ** rate of federal full parole supervision periods for offenders serving determinate sentences was on average 87.7%.
- During the 5-year period between 2017-18 and 2021-22, the successful completionFootnote ** rate of federal regular full parole supervision periods was on average 4.9% lower than the rate of federal accelerated parole review (APR) full parole supervision periods (88.0% and 92.9%, respectively).
- The rate of violent reoffending of federal full parole supervision periods has been relatively low in the past 5 years, averaging 0.6% (and ranging from 0.3% to 0.8%).
| Federal full parole outcomes | 2017-18 | 2018-19 | 2019-20 | 2020-21 | 2021-22 | |||||
|---|---|---|---|---|---|---|---|---|---|---|
| # | % | # | % | # | % | # | % | # | % | |
| Successful completionFootnote ** | ||||||||||
Regular |
968 | 90.6 | 1,063 | 86.9 | 1,171 | 87.6 | 1,177 | 87.7 | 1,169 | 87.8 |
Accelerated |
102 | 88.7 | 114 | 95.8 | 104 | 91.2 | 97 | 94.2 | 83 | 95.4 |
Total |
1,070 | 90.4 | 1,177 | 87.7 | 1,275 | 87.9 | 1,274 | 88.2 | 1,252 | 88.3 |
| Revocation for breach of conditions | ||||||||||
Regular |
71 | 6.6 | 122 | 10.0 | 120 | 9.0 | 127 | 9.5 | 135 | 10.1 |
Accelerated |
8 | 7.0 | 4 | 3.4 | 7 | 6.1 | 5 | 4.9 | 4 | 4.6 |
Total |
79 | 6.7 | 126 | 9.4 | 127 | 8.8 | 132 | 9.1 | 139 | 9.8 |
| Revocation with non-violent offence | ||||||||||
Regular |
24 | 2.2 | 28 | 2.3 | 36 | 2.7 | 35 | 2.6 | 18 | 1.4 |
Accelerated |
5 | 4.3 | 1 | 0.8 | 1 | 0.9 | 0 | 0.0 | 0 | 0.0 |
Total |
29 | 2.4 | 29 | 2.2 | 37 | 2.6 | 35 | 2.4 | 18 | 1.3 |
| Revocation with violent offence | ||||||||||
Regular |
6 | 0.6 | 10 | 0.8 | 9 | 0.7 | 3 | 0.2 | 9 | 0.7 |
Accelerated |
0 | 0.0 | 0 | 0.0 | 2 | 1.8 | 1 | 1.0 | 0 | 0.0 |
Total |
6 | 0.5 | 10 | 0.7 | 11 | 0.8 | 4 | 0.3 | 9 | 0.6 |
| Total regular | 1,069 | 90.3 | 1,223 | 91.1 | 1,336 | 92.1 | 1,342 | 92.9 | 1,331 | 93.9 |
| Total accelerated | 115 | 9.7 | 119 | 8.9 | 114 | 7.9 | 103 | 7.1 | 87 | 6.1 |
| Total (regular and accelerated) | 1,184 | 100 | 1,342 | 100 | 1,450 | 100 | 1,445 | 100 | 1,418 | 100 |
Source: Parole Board of Canada.
Offenders released from federal institutions including Healing Lodges on statutory release: 10-year trend
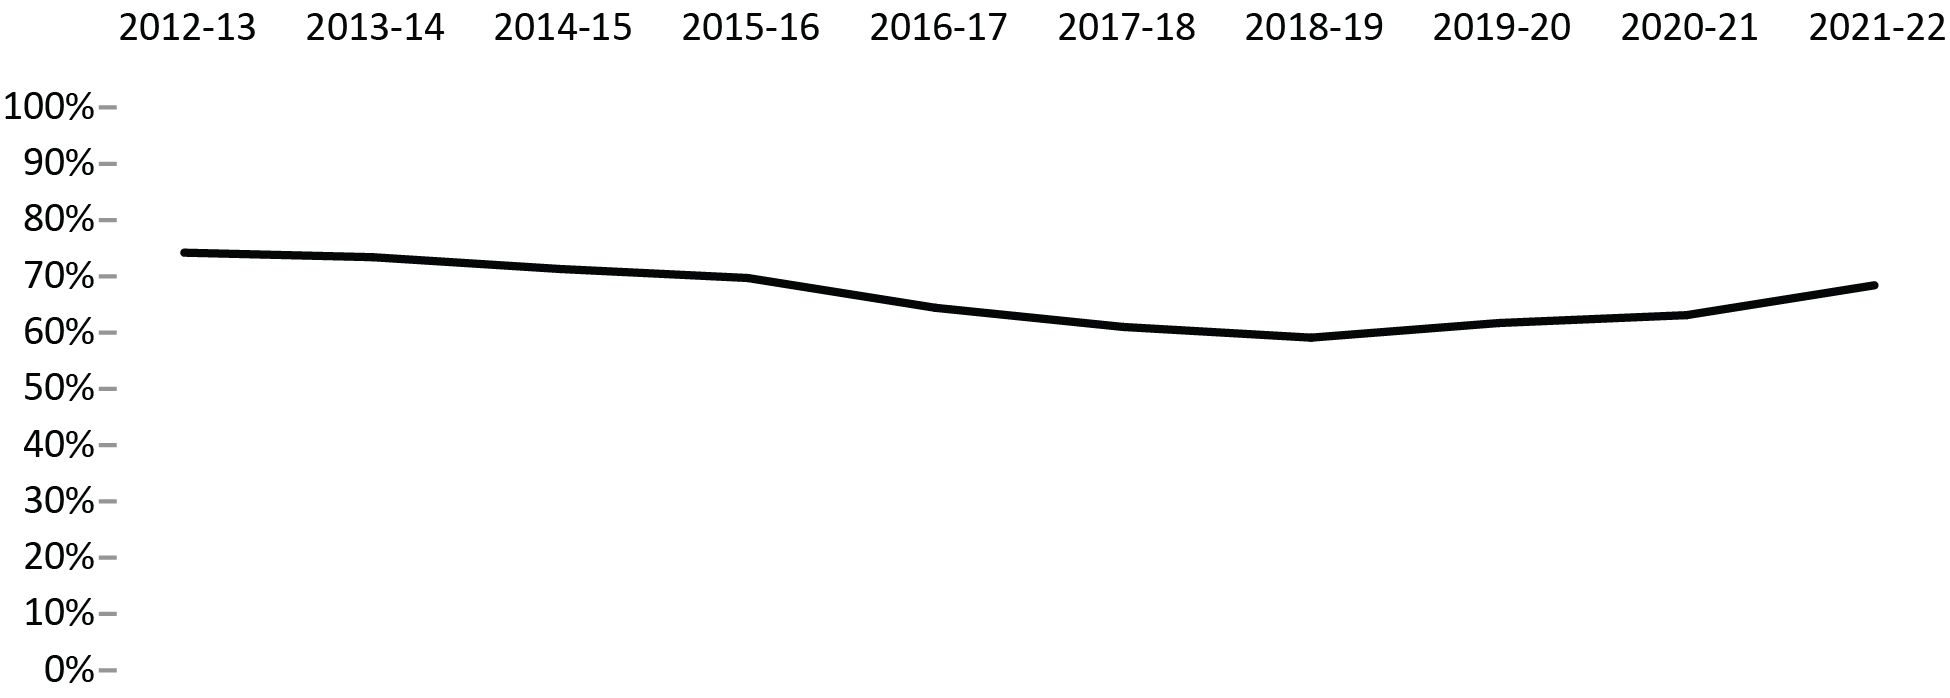
Image description
Line graph showing the percentage of offenders released from federal institutions including healing lodges on statutory release from fiscal year 2012 to 2013 until fiscal year 2021 to 2022. Rates decrease steadily from 83.4 percent in fiscal year 2012 to 2013 until 59.1 percent in fiscal year 2018 to 2019, prior to increasing to 80 percent in fiscal year 2021 to 2022. Full data are available immediately below.
Source: Correctional Service of Canada.
- In fiscal year 2021-22, 68.4% of all releases from federal institutions were at statutory release.
- In fiscal year 2021-22, 80.0% of releases for Indigenous offenders were at statutory release compared to 62.3% of releases for non-Indigenous offenders.
- Over the past 10 years (from 2012-13 to 2021-22), the percentage of releases at statutory release decreased from 74.2% to 68.1%.
| Fiscal year | Indigenous | Non-Indigenous | Total offender population | ||||||
|---|---|---|---|---|---|---|---|---|---|
| Statutory release | Total releases | %Footnote * | Statutory release | Total releases | %Footnote * | Statutory release | Total releases | %Footnote * | |
| 2012-13 | 1,642 | 1,969 | 83.4 | 3,946 | 5,564 | 70.9 | 5,588 | 7,533 | 74.2 |
| 2013-14 | 1,737 | 2,045 | 84.9 | 3,899 | 5,636 | 69.2 | 5,636 | 7,681 | 73.4 |
| 2014-15 | 1,756 | 2,077 | 84.5 | 3,616 | 5,455 | 66.3 | 5,372 | 7,532 | 71.3 |
| 2015-16 | 1,690 | 2,047 | 82.6 | 3,618 | 5,569 | 65.0 | 5,308 | 7,616 | 69.7 |
| 2016-17 | 1,598 | 2,048 | 78.0 | 3,285 | 5,529 | 59.4 | 4,883 | 7,577 | 64.4 |
| 2017-18 | 1,547 | 2,076 | 74.5 | 2,873 | 5,174 | 55.5 | 4,420 | 7,250 | 61.0 |
| 2018-19 | 1,433 | 2,020 | 70.9 | 2,740 | 5,044 | 54.3 | 4,173 | 7,064 | 59.1 |
| 2019-20 | 1,629 | 2,169 | 75.1 | 2,727 | 4,892 | 55.7 | 4,356 | 7,061 | 61.7 |
| 2020-21 | 1,582 | 2,087 | 75.8 | 2,541 | 4,451 | 57.1 | 4,123 | 6,538 | 63.1 |
| 2021-22 | 1,763 | 2,204 | 80.0 | 2,620 | 4,205 | 62.3 | 4,383 | 6,409 | 68.4 |
Source: Correctional Service of Canada.
Outcome of federal statutory release supervision periods
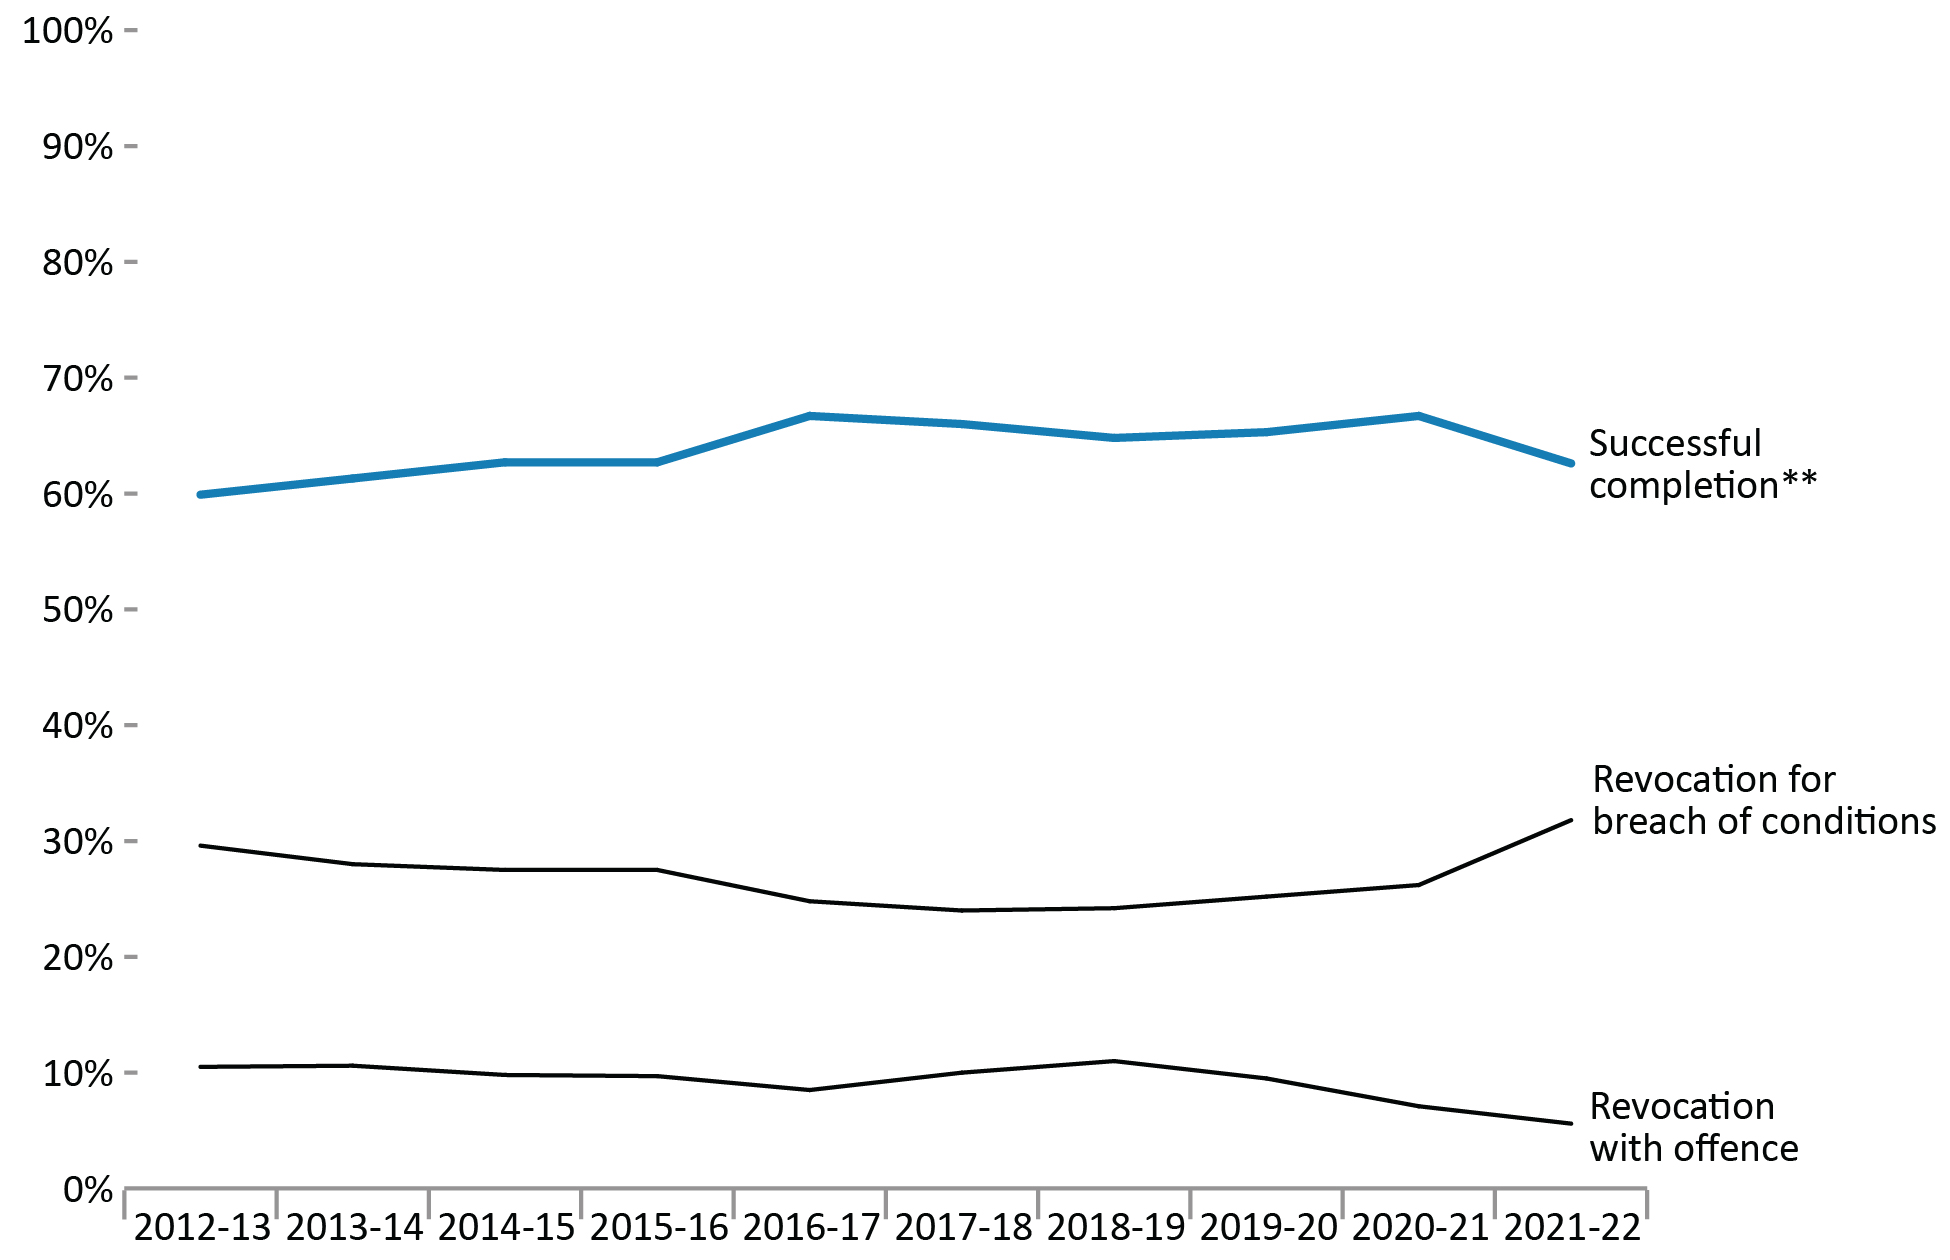
Image description
Line graph showing the outcomes of federal statutory release supervision periods from fiscal year 2012 to 2013 until fiscal year 2021 to 2022. Successful completion rose steadily to a peak of 66.7 percent in fiscal year 2016 to 2017, decreasing to 64.8 percent in fiscal year 2018 to 2019, increasing back 66.7 percent in fiscal year 2020 to 2021, then decreasing to 62.6 percent in fiscal year 2021 to 2022. Revocation for breach of conditions decreased steadily until its lowest point in fiscal year 2017 to 2018 at 24.0, after which point it rose steadily to a peak of 31.8 percent in fiscal year 2021 to 2022. Revocation with offense was the lowest, decreasing to 8.4 percent in fiscal year 2016 to 2017, then rising to a peak of 10.8 percent in fiscal year 2018 to 2019, then decreasing until reaching its lowest point of 4.9 percent in fiscal year 2021 to 2022. Full data are available immediately below.
Source: Parole Board of Canada.
- In 2021-22, the successful completionFootnote ** rate of statutory releaseFootnote * supervision periods decreased 4.1% to 62.6% compared to 2020-21.
- Over the past 5 years (from 2017-18 to 2021-22), the revocation with violent offence rates were, on average, 8.4 times higher for offenders on statutory releaseFootnote * than for offenders on federal day parole and 2.4 times higher than for offenders on federal full parole.
- The rate of revocation with a violent offence of statutory releaseFootnote * supervision periods was on average 1.4% in the past 5 years (from 2017-18 to 2021-22).
| Statutory releaseFootnote * outcomes | 2017-18 | 2018-19 | 2019-20 | 2020-21 | 2021-22 | |||||
|---|---|---|---|---|---|---|---|---|---|---|
| # | % | # | % | # | % | # | % | # | % | |
| Successful completionFootnote ** | 3,558 | 66.0 | 3,289 | 64.8 | 3,392 | 65.3 | 3,336 | 66.7 | 3,218 | 62.6 |
| Revocation for breach of conditions | 1,291 | 24.0 | 1,230 | 24.2 | 1,308 | 25.2 | 1,311 | 26.2 | 1,634 | 31.8 |
| Revocation with non-violent offence | 463 | 8.6 | 462 | 9.1 | 401 | 7.7 | 289 | 5.8 | 251 | 4.9 |
| Revocation with violent offence | 76 | 1.4 | 94 | 1.9 | 93 | 1.8 | 67 | 1.3 | 39 | 0.8 |
| Total | 5,388 | 100 | 5,075 | 100 | 5,194 | 100 | 5,003 | 100 | 5,142 | 100 |
Source: Parole Board of Canada.
Rates of violent offence convictions for offenders on federal conditional release: 10-year trend
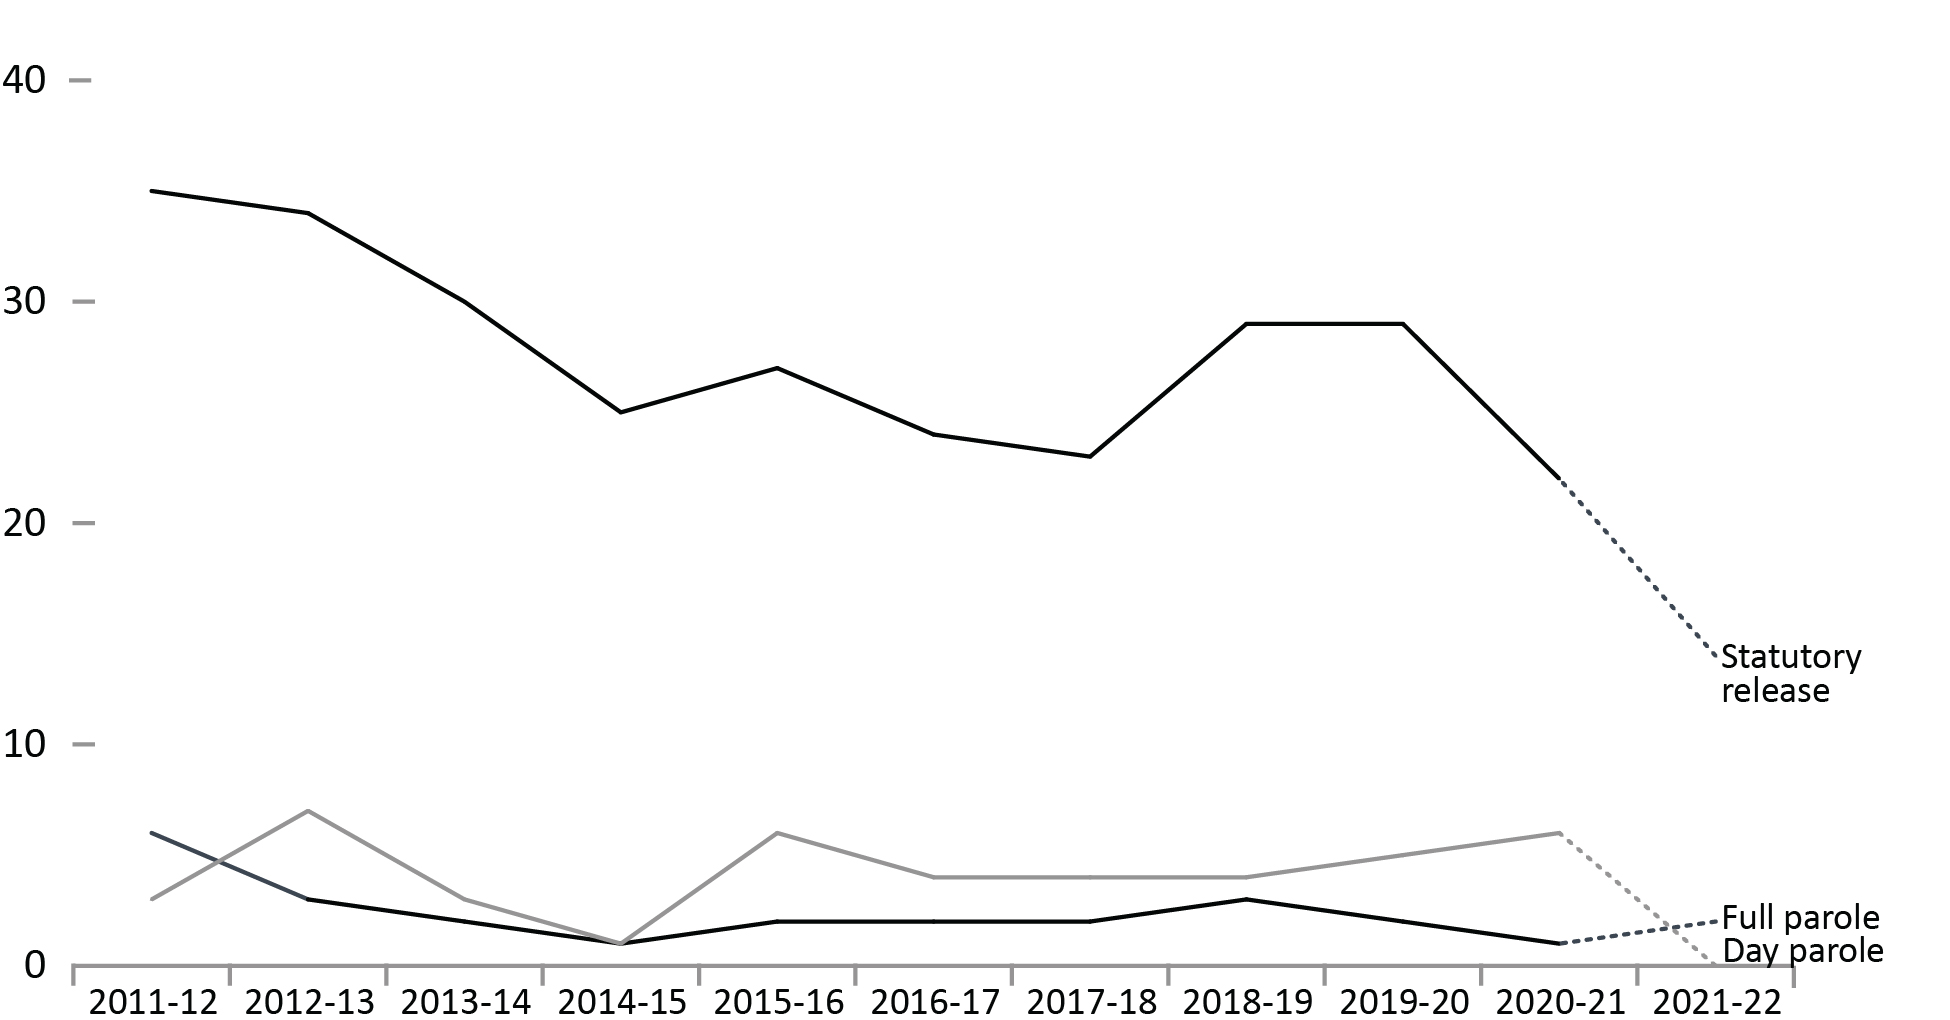
Image description
Line graph showing the rates of violent offence convictions per 1,000 supervised offenders from fiscal year 2011 to 2012 until fiscal year 2021 to 2022. Statutory release had the highest rate overall, starting at a peak of 35 convictions per 1,000 supervised offenders in fiscal year 2011 to 2012, then fluctuating in a downward trend to 23 convictions in fiscal year 2017 to 2018, briefly rising to 29 convictions in fiscal years 2018 to 2019 and 2019 to 2020, then decreasing to its lowest point of 14 convictions in 2021 to 2022. Day parole rates were significantly lower that statutory release rates, with a peak of 7 convictions in fiscal year 2012 to 2013 and a low of 0 convictions in fiscal year 2021 to 2022. Full parole had the lowest rate overall, fluctuating between 1 and 3 convictions over time, with peaks in fiscal years 2011 to 2012, 2012 to 2013, and 2018 to 2019, and lows in fiscal years 2014 to 2015 and 2020 to 2021. Full data are available immediately below.
Source: Parole Board of Canada.
- During the 10-year period between 2011-12 and 2020-21Footnote *, the number of convictions for a violent offence for offenders on federal conditional release decreased 40.9% (from 137 in 2011-12 to 81 in 2020-21). Of offenders on day parole, there was an average of 7.0 convictions for violent offences annually and for offenders on full parole, 8.7 convictions compared to an annual average of 94.0 by offenders on statutory release.
- During the 10-year period between 2011-12 and 2020-21Footnote *, convictions for violent offences on statutory release accounted for 85.7% of all convictions by offenders on federal conditional release.
- When comparing the rates of conviction for violent offences per 1,000 supervised offenders (between 2011-12 and 2020-21Footnote *), offenders on statutory release were 12.9 times more likely to commit a violent offence during their supervision periods than offenders on full parole, and 5.8 times more likely to commit a violent offence than offenders on day parole.
| Fiscal year | # of convictions for violent offences | Rates per 1,000 supervised offenders | |||||
|---|---|---|---|---|---|---|---|
| Day parole | Full parole | Statutory release | Total | Day parole | Full parole | Statutory release | |
| 2011-12 | 7 | 10 | 120 | 137 | 6 | 3 | 35 |
| 2012-13 | 9 | 11 | 119 | 139 | 7 | 3 | 34 |
| 2013-14 | 4 | 8 | 106 | 118 | 3 | 2 | 30 |
| 2014-15 | 1 | 4 | 87 | 92 | 1 | 1 | 25 |
| 2015-16 | 9 | 7 | 95 | 111 | 6 | 2 | 27 |
| 2016-17 | 7 | 8 | 83 | 98 | 4 | 2 | 24 |
| 2017-18 | 7 | 8 | 76 | 91 | 4 | 2 | 23 |
| 2018-19 | 8 | 15 | 94 | 117 | 4 | 3 | 29 |
| 2019-20 | 9 | 11 | 93 | 113 | 5 | 2 | 29 |
| 2020-21 | 9 | 5 | 67 | 81 | 6 | 1 | 22 |
| 2021-22 | 0 | 10 | 39 | 49 | 0 | 2 | 14 |
Source: Parole Board of Canada.
Table D12 Notes
Violent offences include murder and Schedule I offences (listed in the Corrections and Conditional Release Act) such as assaults, sexual offences, arson, abduction, robbery and some weapon offences.
Supervised offenders include offenders who are on parole and statutory release, those temporarily detained in federal institutions, and those who are deported or extradited.
Statutory release refers to a conditional release that is subject to supervision after the offender has served two-thirds of the sentence.
Day and full parole include those offenders serving determinate and indeterminate sentences.
Reported year periods reflect fiscal years. A fiscal year runs from April 1 to March 31 of the following year.
Section E: Special Applications of Criminal Justice
Number of initial detention reviews: 10-year trend
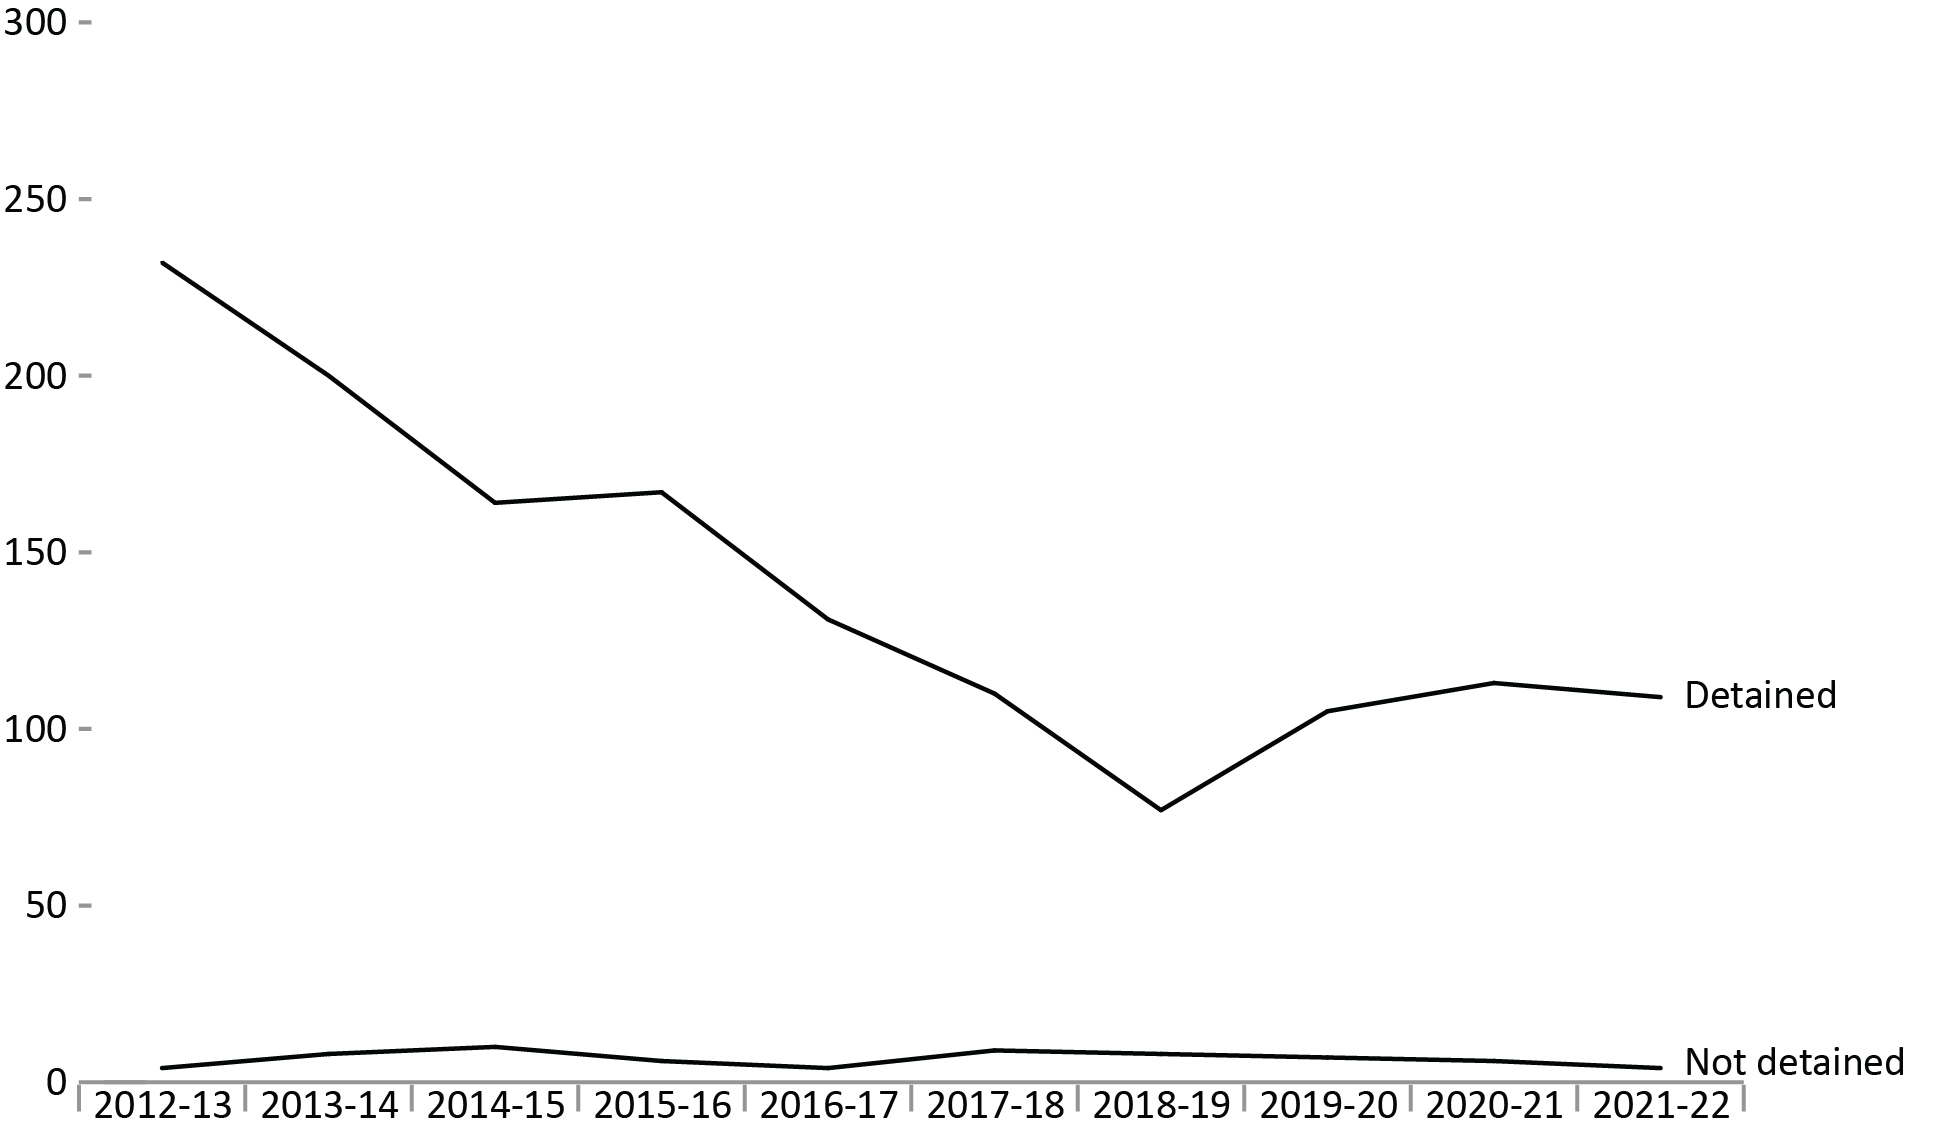
Image description
Line graph showing the number of initial detention reviews between fiscal year 2012 to 2013 and fiscal year 2021 to 2022. The number of reviews for detained offenders decreased steeply from a peak of 232 reviews in fiscal year 2012 to 2013, to a low of 77 reviews in fiscal year 2018 to 2019, increasing briefly to 113 reviews in fiscal year 2020 to 2021, and dropping to 109 reviews in fiscal year 2021 to 2022. The number of reviews for non-detained offenders was significantly lower, reaching a peak of only 10 reviews in fiscal year 2014 to 2015. Full data are available immediately below.
Source: Parole Board of Canada.
- In 2021-22, the number of referrals for detention decreased from 119 to 113 when compared to 2020-21.
- The proportion of Indigenous offenders detained as a result of an initial detention review increased 1.4% to 98.0% while the proportion of non-Indigenous offenders detained as a result of an initial detention review increased 1.9% to 95.2% compared to the previous year (2020-21).
- In 2021-22, Indigenous offenders accounted for 32.6% of federal incarcerated offenders serving determinate sentences while they accounted for 44.2% of offenders referred for detention.
Figure E1 Notes
Initial Detention Review: In accordance with subsection 130(1) of the Corrections and Conditional Release Act, a review conducted upon referral by the Correctional Service of Canada. On completion of its review, the Board may order that an individual not be released from imprisonment before the expiration of their sentence according to law – except on a escorted temporary absence for medical or administrative reasons – if it is satisfied that the individual is likely, if released, to commit an offence causing the death of or serious harm to another person, a sexual offence involving a child, or a serious drug offence before the end of their sentence. Detention orders are subject to review within one or two years, depending on the type of offence.
Reported year periods reflect fiscal years. A fiscal year runs from April 1 to March 31 of the following year.
| Fiscal year | Detained | Statutory release | Total | Total | |||||||
|---|---|---|---|---|---|---|---|---|---|---|---|
| Ind. | Non- Ind. | Total | % | Ind. | Non- Ind. | Total | % | Ind. | Non- Ind. | ||
| 2012-13 | 94 | 138 | 232 | 98.3 | 4 | 0 | 4 | 1.7 | 98 | 138 | 236 |
| 2013-14 | 91 | 109 | 200 | 96.2 | 4 | 4 | 8 | 3.8 | 95 | 113 | 208 |
| 2014-15 | 71 | 93 | 164 | 94.3 | 5 | 5 | 10 | 5.7 | 76 | 98 | 174 |
| 2015-16 | 75 | 92 | 167 | 96.5 | 2 | 4 | 6 | 3.5 | 77 | 96 | 173 |
| 2016-17 | 55 | 76 | 131 | 97.0 | 2 | 2 | 4 | 3.0 | 57 | 78 | 135 |
| 2017-18 | 51 | 59 | 110 | 92.4 | 5 | 4 | 9 | 7.6 | 56 | 63 | 119 |
| 2018-19 | 38 | 39 | 77 | 90.6 | 6 | 2 | 8 | 9.4 | 44 | 41 | 85 |
| 2019-20 | 50 | 55 | 105 | 93.8 | 4 | 3 | 7 | 6.3 | 54 | 58 | 112 |
| 2020-21 | 57 | 56 | 113 | 95.0 | 2 | 4 | 6 | 5.0 | 59 | 60 | 119 |
| 2021-22 | 49 | 60 | 109 | 96.5 | 1 | 3 | 4 | 3.5 | 50 | 63 | 113 |
| Total | 631 | 777 | 1,408 | 95.5 | 35 | 31 | 66 | 4.5 | 666 | 808 | 1,474 |
Source: Parole Board of Canada.
Table E1 Notes
Indigenous (Ind.) and non-Indigenous (Non-Ind.) are abbreviated in this table due to formatting.
Initial Detention Review: In accordance with subsection 130(1) of the Corrections and Conditional Release Act, a review conducted upon referral by the Correctional Service of Canada. On completion of its review, the Board may order that an individual not be released from imprisonment before the expiration of their sentence according to law – except on a escorted temporary absence for medical or administrative reasons – if it is satisfied that the individual is likely, if released, to commit an offence causing the death of or serious harm to another person, a sexual offence involving a child, or a serious drug offence before the end of their sentence. Detention orders are subject to review within one or two years, depending on the type of offence.
Reported year periods reflect fiscal years. A fiscal year runs from April 1 to March 31 of the following year.
Annual judicial review hearings
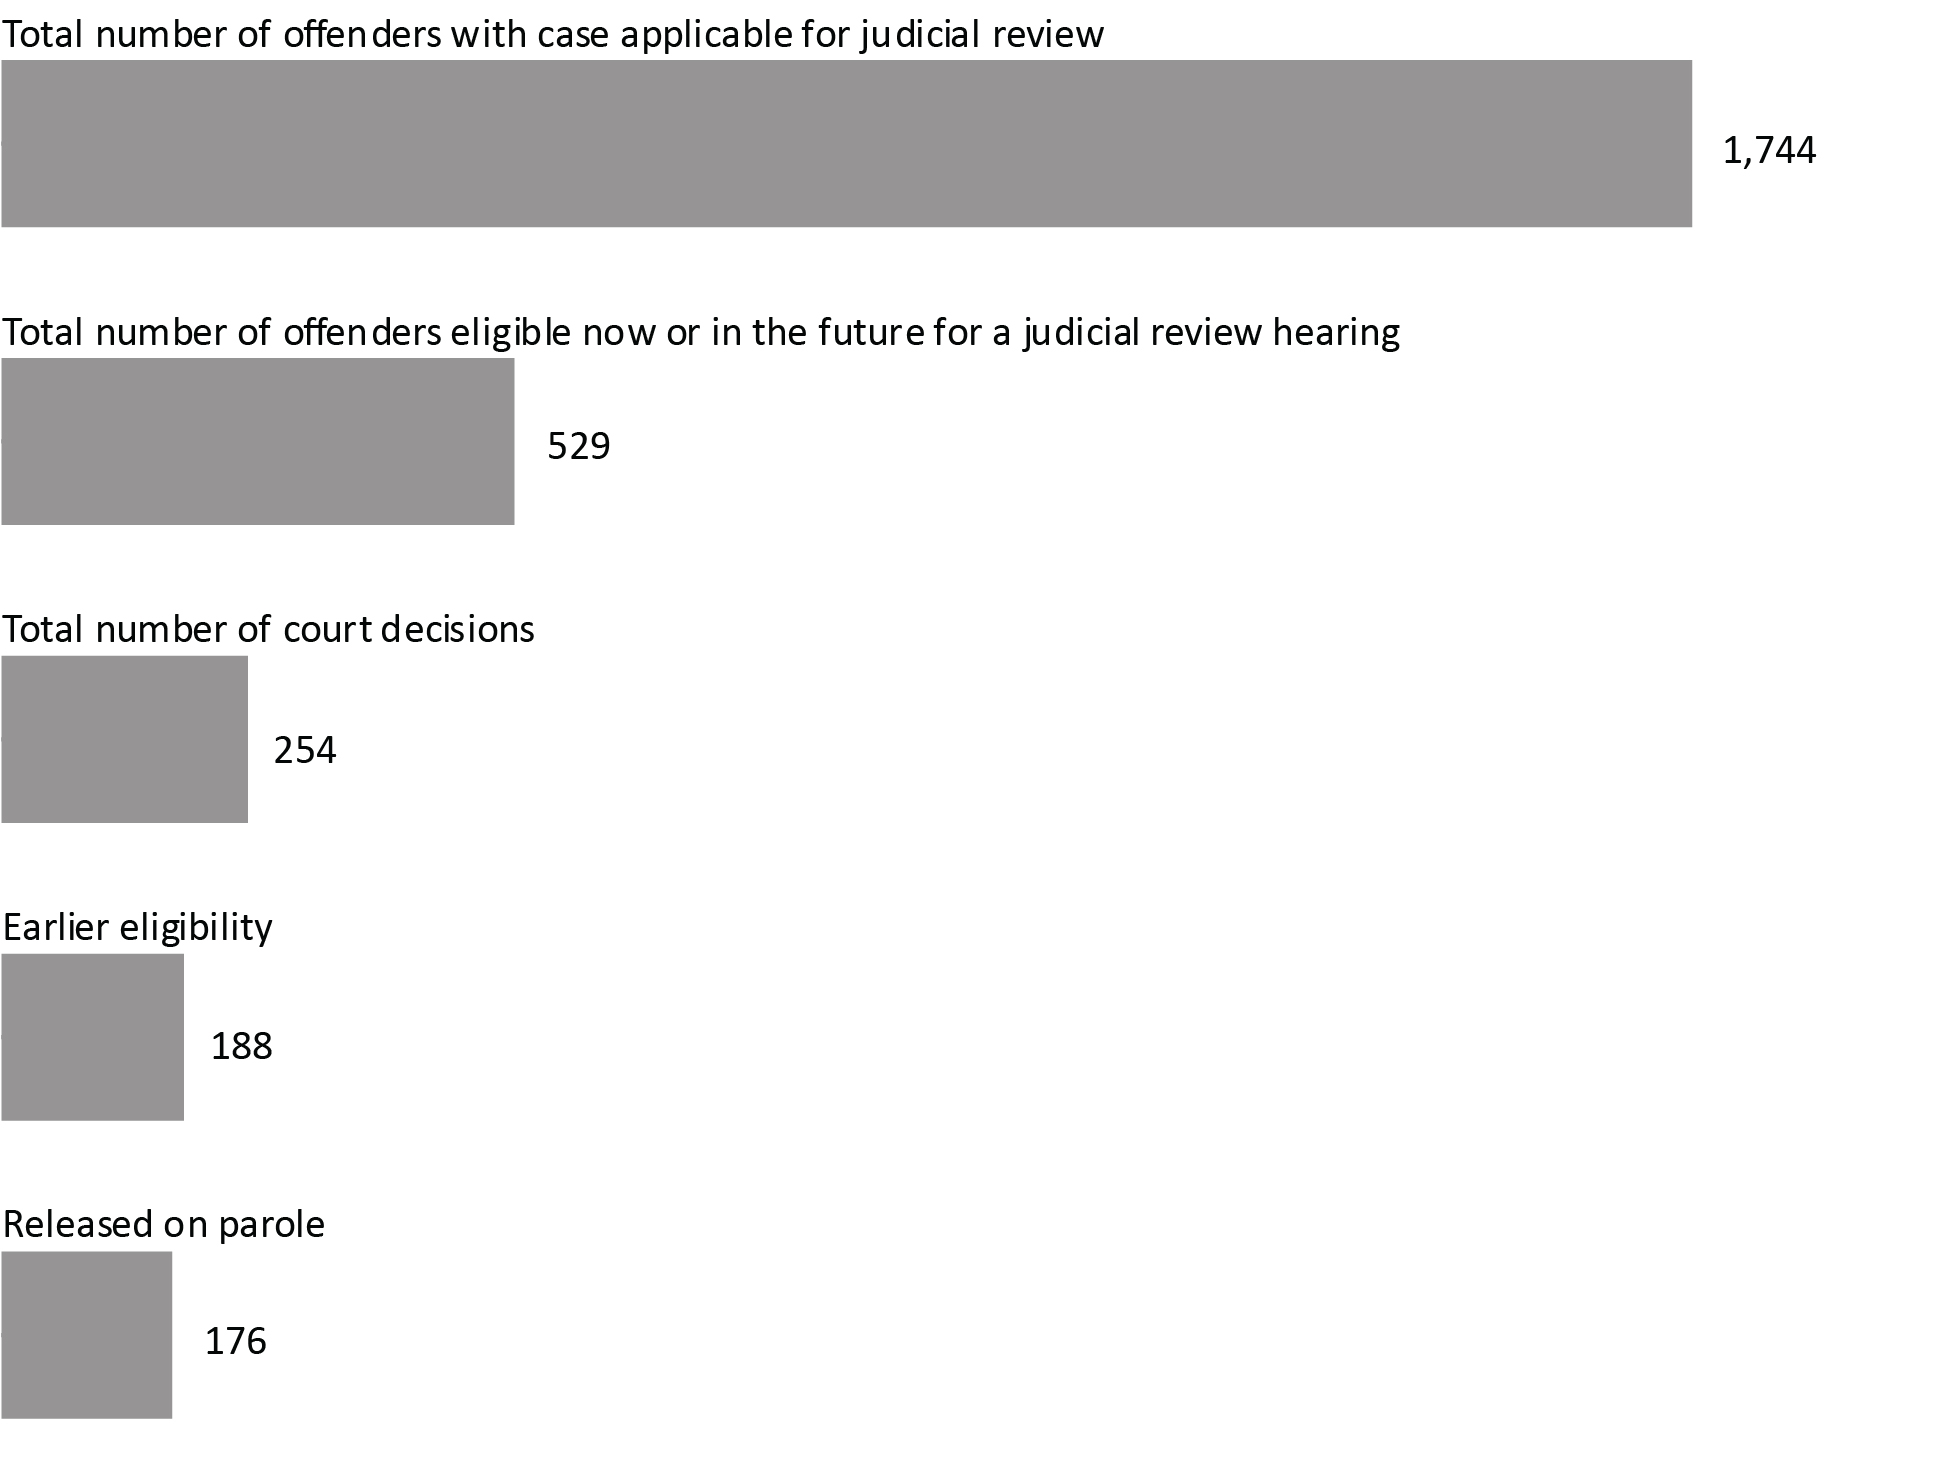
Image description
Bar chart showing the outcomes of annual judicial review hearings between fiscal year 1987 to 1988 and fiscal year 2021 to 2022. In order from most to least, the total number of offenders with cases applicable for judicial review was 1,744; the total number of offenders eligible at this time or in the future for a judicial review hearing was 529; the total number of court decisions was 254; there were 188 decisions of earlier eligibility; and 176 offenders were released on parole. Full data are available immediately below.
Source: Correctional Service of Canada.
- Since the first judicial review hearing in 1987, there have been a total of 254 court decisions (i.e., between fiscal year 1987-88 and the end of fiscal year 2021-22).
- Of these cases, 74.0% of the court decisions resulted in a reduction of the period that must be served before parole eligibility.
- Of the 529 offenders eligible to apply for a judicial review, 281 have already served 15 years of their sentence, whereas 248 have not.
- Of the 188 offenders who had their parole eligibility date moved closer, 185 had reached their revised Day Parole eligibility date. Of these offenders, 176 were released on parole, and 117 were being actively supervised in the communityFootnote *.
- A higher percentage of second degree (81.5%) than first degree (73.1%) murder cases have resulted in a reduction of the period required to be served before parole eligibility.
| Province/territory of judicial review | Parole ineligibility reduced by court | Reduction denied by court | Total | |||
|---|---|---|---|---|---|---|
| 1st degree murder | 2nd degree murder | 1st degree murder | 2nd degree murder | 1st degree murder | 2nd degree murder | |
| Northwest Territories | 0 | 0 | 0 | 0 | 0 | 0 |
| Nunavut | 0 | 0 | 0 | 0 | 0 | 0 |
| Yukon Territories | 0 | 0 | 0 | 0 | 0 | 0 |
| Newfoundland & Labrador | 0 | 0 | 0 | 0 | 0 | 0 |
| Prince Edward Island | 0 | 0 | 0 | 0 | 0 | 0 |
| Nova Scotia | 1 | 1 | 1 | 0 | 2 | 1 |
| New Brunswick | 1 | 0 | 0 | 0 | 1 | 0 |
| Quebec | 78 | 16 | 7 | 2 | 85 | 18 |
| Ontario | 24 | 0 | 31 | 1 | 55 | 1 |
| Manitoba | 8 | 4 | 1 | 0 | 9 | 4 |
| Saskatchewan | 7 | 0 | 3 | 0 | 10 | 0 |
| Alberta | 20 | 0 | 9 | 1 | 29 | 1 |
| British Columbia | 27 | 1 | 9 | 1 | 36 | 2 |
| Subtotal | 166 | 22 | 61 | 5 | 227 | 27 |
| Total | 188 | 66 | 254 | |||
Source: Correctional Service of Canada.
Table E2 Notes
Judicial review is an application to the court for a reduction in the time required to be served before being eligible for parole. Judicial review procedures apply to offenders who have been sentenced to imprisonment for life without eligibility for parole until more than 15 years of their sentence has been served. Offenders can apply when they have served at least 15 years of their sentence. Judicial reviews are conducted in the province where the conviction took place.
Reported year periods reflect fiscal years. A fiscal year runs from April 1 to March 31 of the following year.
Number of Dangerous Offender designations
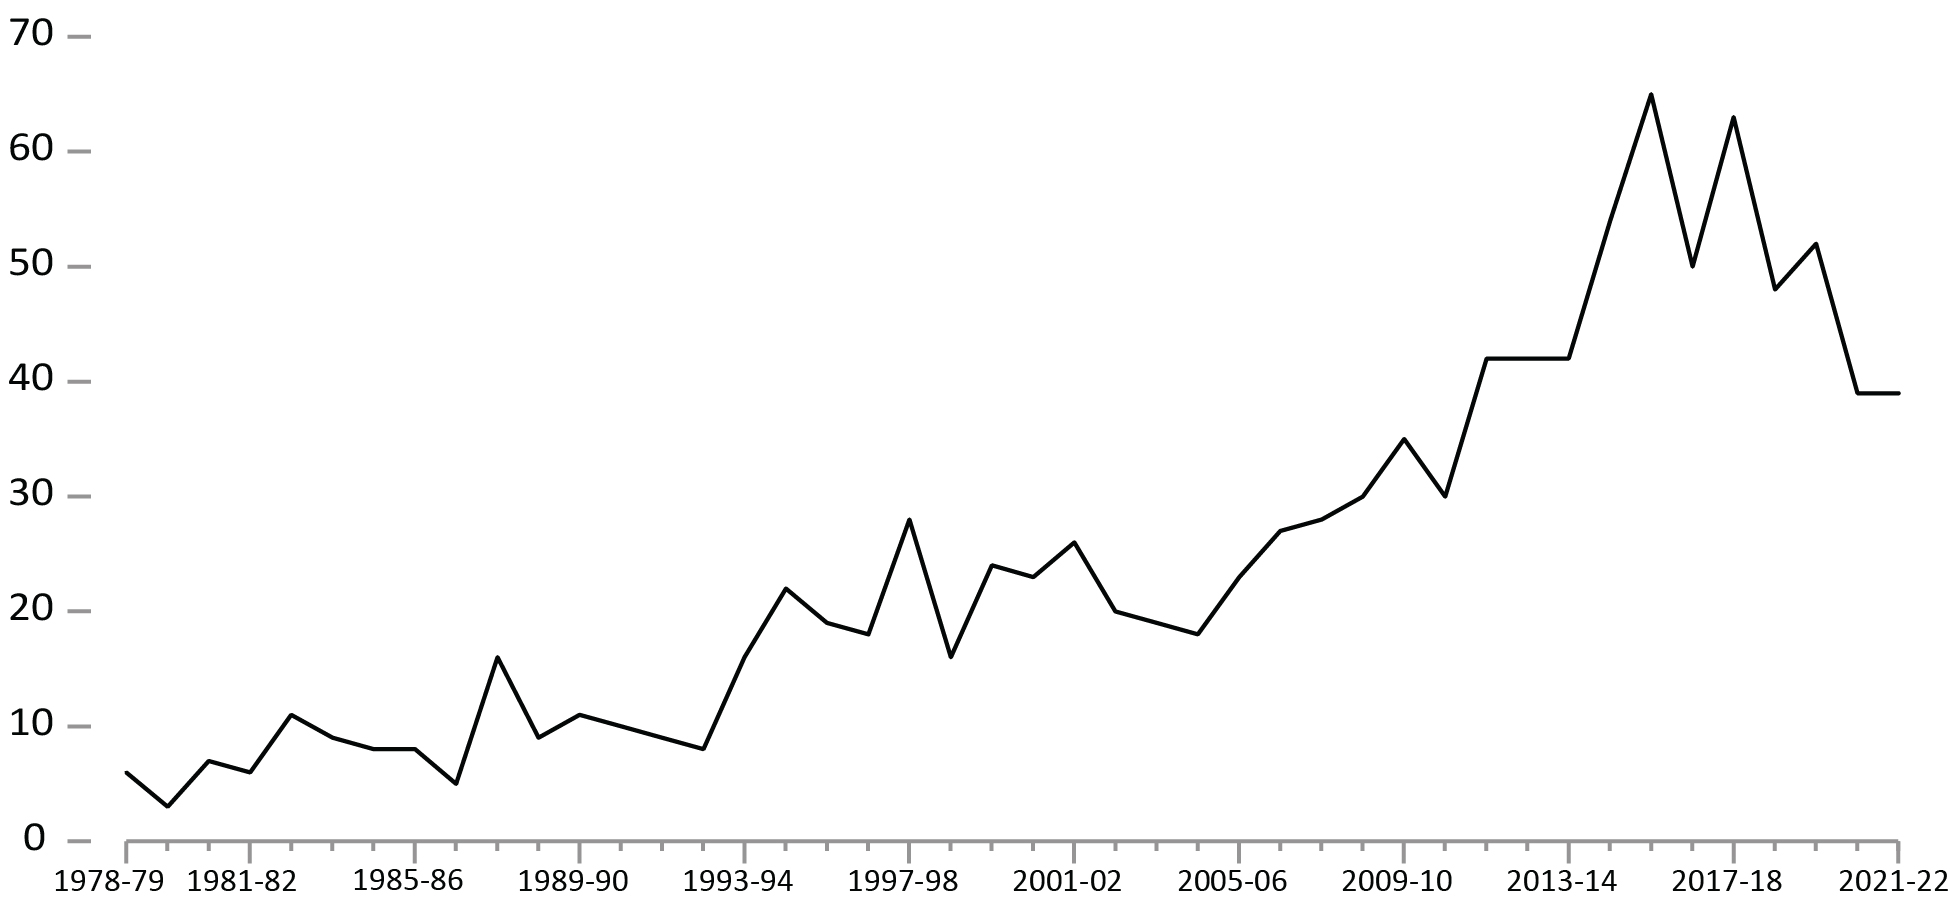
Image description
Line graph showing the number of offenders designated as Dangerous Offenders between fiscal year 1978 to 1979 and fiscal year 2021 to 2022. The number of dangerous offender designations increased gradually, with sharp fluctuations, from less than 10 designations in fiscal year 1978 to 1979 to around 25 designations a year in the mid-1990s, there was a brief dip in the number of designations between fiscal years 2002 to 2003 and 2004 to 2005, after which point the number of designations starts to increase more rapidly until reaching a peak of around 65 designations in fiscal year 2015 to 2016, then dropping to around 40 designations in fiscal year 2020 to 2021 and remaining stable for fiscal year 2021 to 2022. Full data by province, distinguishing between indeterminate and determinate offenders, are available immediately below.
Source: Correctional Service of Canada.
- At the end of fiscal year 2021-22, 1,084 offenders had been designated as Dangerous Offenders (DOs) since 1978.
- At the end of fiscal year 2021-22 there were 893 DOs under the responsibility of Correctional Service Canada, and of those, 75.5% had indeterminate sentences.
- Of these 893 DOs, 736 were in custody (representing 6.0% of the total in-custody population) and 157 were in the community under supervision. There were 9 female offenders with a Dangerous Offender designation. Indigenous offenders accounted for 36.3% of DOs and 28.1% of the total offender population.
Figure E3 Notes
The number of Dangerous Offenders designated per year does not include overturned decisions.
Offenders who have died since receiving designations are no longer classified as “active”; however, they are still represented in the above graph, which depicts the total number of offenders ‘”designated”.
The percentage of DOs who had at least 1 current conviction for a sexual offence is not available.
Dangerous Offender legislation came into effect in Canada on October 15, 1977, replacing the Habitual Offender and Dangerous Sexual Offender provisions that were abolished. A Dangerous Offender (DO) is an individual given an indeterminate or a determinate* sentence on the basis of a particularly violent crime or pattern of serious violent offences where it is judged that the offender’s behaviour is unlikely to be inhibited by normal standards of behavioural restraint (see section 753 of the Criminal Code of Canada).
In addition to the DOs, there were 9 Dangerous Sexual Offenders and 2 offenders with an Habitual Offender designation under the responsibility of Correctional Service Canada at the end of fiscal year 2021-22.
Determinate sentence for Dangerous Offenders must be a minimum punishment of imprisonment for a term of 2 years — and have an order that the offender be subject to long-term supervision for a period that does not exceed 10 years.
Reported year periods reflect fiscal years. A fiscal year runs from April 1 to March 31 of the following year.
| Province/territory of designation | All designations (designated since 1978) |
Active Dangerous Offenders | ||
|---|---|---|---|---|
| # of indeterminate offenders | # of determinate offenders | Total | ||
| Newfoundland & Labrador | 15 | 7 | 2 | 9 |
| Nova Scotia | 28 | 18 | 3 | 21 |
| Prince Edward Island | 0 | 0 | 0 | 0 |
| New Brunswick | 8 | 4 | 0 | 4 |
| Quebec | 148 | 94 | 34 | 128 |
| Ontario | 471 | 287 | 105 | 392 |
| Manitoba | 34 | 26 | 4 | 30 |
| Saskatchewan | 110 | 60 | 36 | 96 |
| Alberta | 78 | 55 | 10 | 65 |
| British Columbia | 171 | 111 | 20 | 131 |
| Yukon Territories | 7 | 2 | 3 | 5 |
| Northwest Territories | 11 | 10 | 1 | 11 |
| Nunavut | 3 | 0 | 1 | 1 |
| Total | 1,084 | 674 | 219 | 893 |
Source: Correctional Service of Canada.
Table E3 Notes
The number of Dangerous Offenders declared per year does not include overturned decisions.
Offenders who have died since receiving designations are no longer classified as "active", however, they are still represented in the total number of offenders "designated".
Numbers presented are current up to the end of fiscal year 2021-22. A fiscal year runs from April 1 to March 31 of the following year.
Number of long-term supervision orders imposed
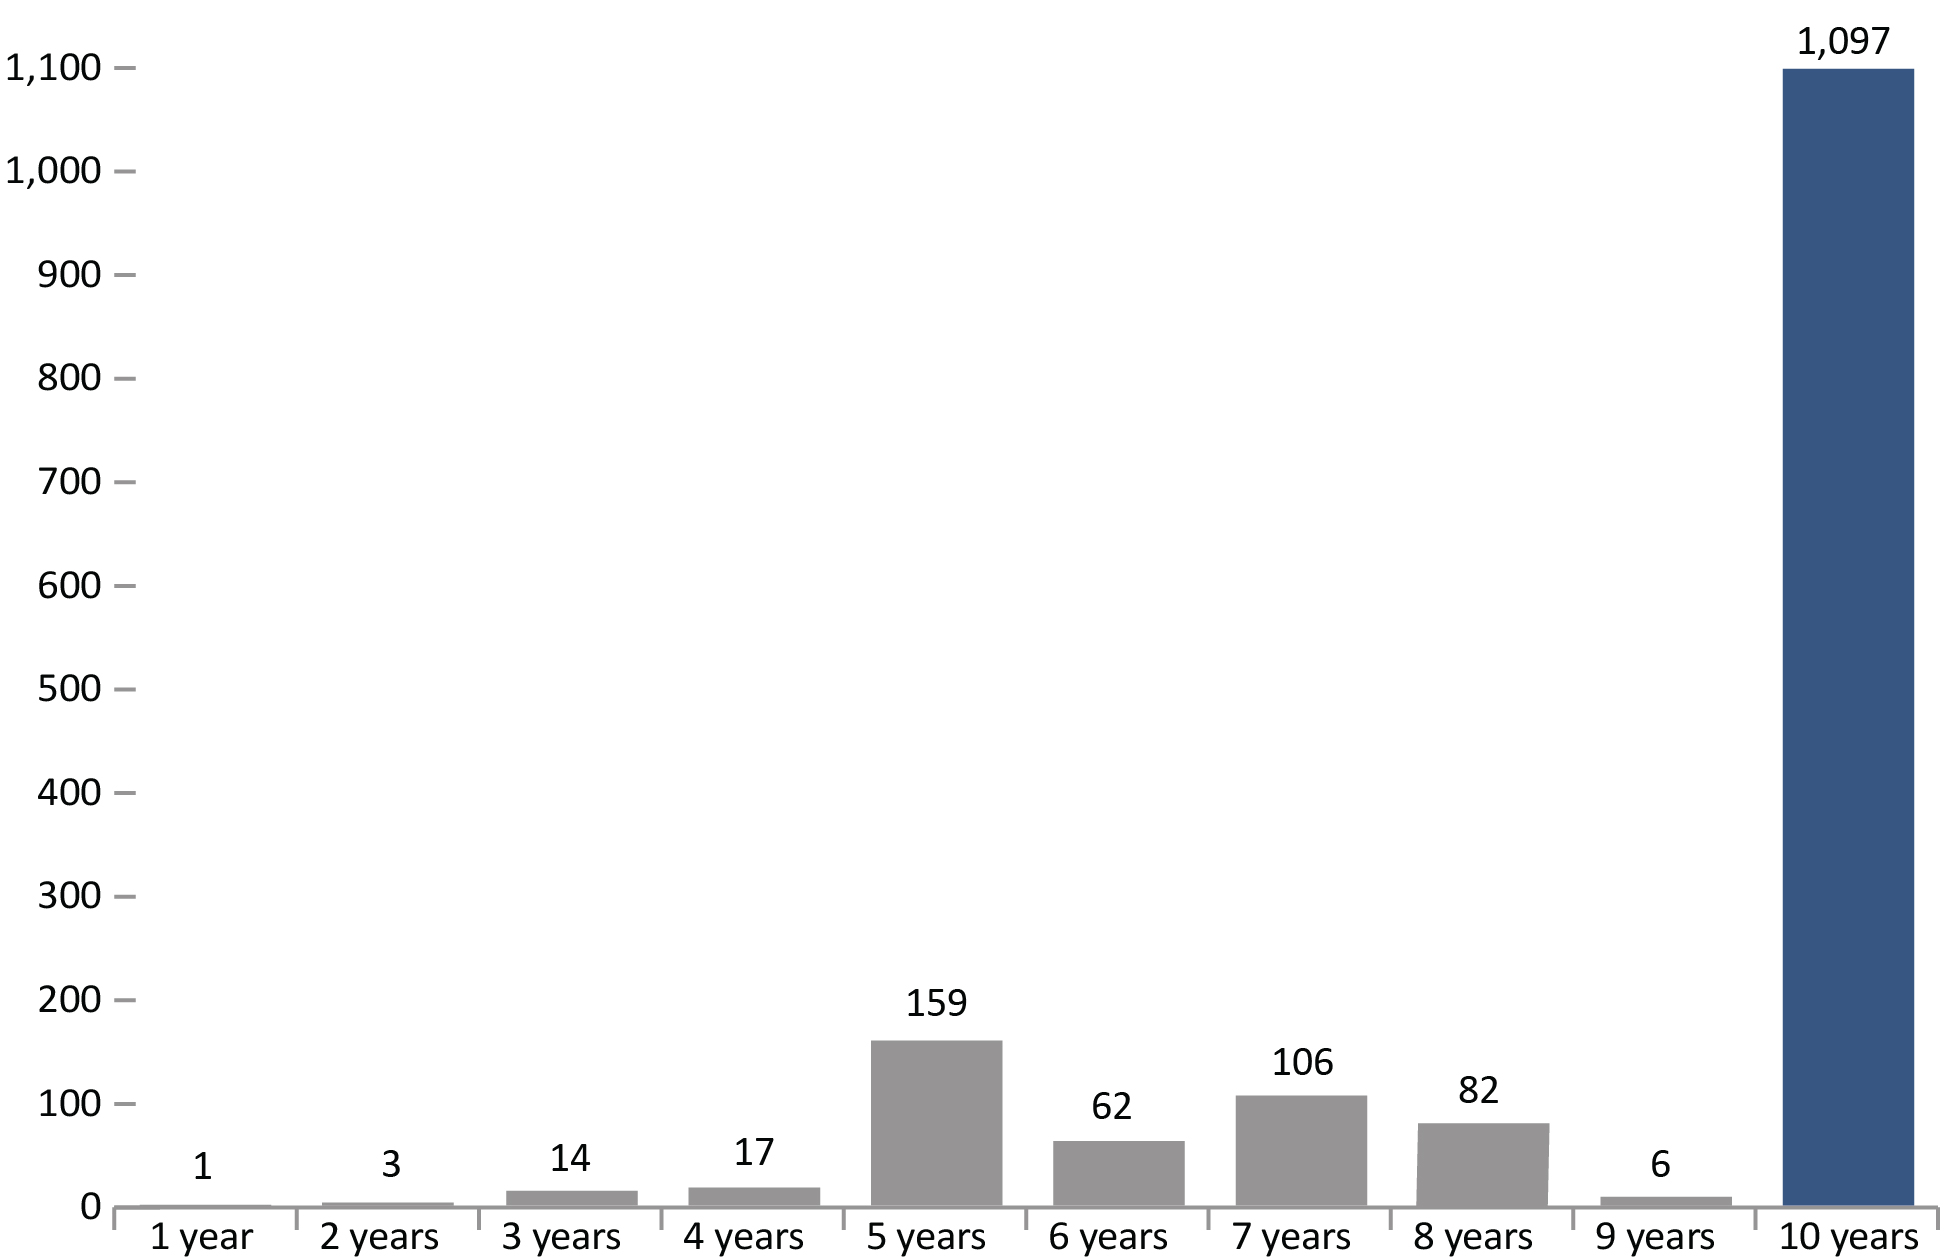
Image description
Bar graph showing the number of long-term supervision orders that were imposed during the fiscal year 2021 to 2022, by length of supervision order imposed. There was a single supervision order of 1 year; 3 supervision orders of 2 years; there is a small jump to 14 supervision orders of 3 years; 17 supervision orders of 4 years; there is a large jump to 159 supervision orders of 5 years, which is the second highest number of long-term supervision orders; 62 supervision orders of 6 years, 106 supervision orders of 7 years, and 82 supervision orders of 8 years; and the largest number of long-term supervision orders by far were those of 10 years, of which there were 1,097 supervision orders. Full data are available immediately below.
Source: Correctional Service of Canada.
- At the end of fiscal year 2021-22, the courts had imposed 1,547 Long-Term Supervision Orders since the legislation came into effect. Of these, 70.9% were for a period of 10 years.
- At the end of fiscal year 2021-22, there were 967 offenders with Long-Term Supervision Orders under the responsibility of Correctional Service Canada. There were 15 females with Long-Term Supervision Orders under the responsibility of Correctional Service Canada.
- There were 493 offenders being supervised in the community on their Long-Term Supervision Order at the end of the fiscal year 2021-22. Of these, 429 offenders were supervised in the community, 17 offenders were temporarily detained, 43 offenders were on remand and 4 offenders were unlawfully at large for less than 90 days.
Figure E4 Notes
Long-Term Supervision Order (LTSO) legislation, which came into effect in Canada on August 1, 1997, allows the court to impose a sentence of 2 years or more for the predicate offence and order that the offender be supervised in the community for a further period not exceeding 10 years.
119 offenders under these provisions have died, and 383 offenders have completed their long-term supervision period.
The percentage of long-term supervision orders who had at least 1 current conviction for a sexual offence is not available.
Remand is the temporary detention of a person while awaiting trial, sentencing or the commencement of a custodial disposition.
Reported year periods reflect fiscal years. A fiscal year runs from April 1 to March 31 of the following year.
| Province or territory of order | Length of supervision order (years) | Current status 2021-22 | ||||||||||||||
|---|---|---|---|---|---|---|---|---|---|---|---|---|---|---|---|---|
| 1 | 2 | 3 | 4 | 5 | 6 | 7 | 8 | 9 | 10 | Total | Incarcerated | DP, FP or SRFootnote * | LTSO period | LTSO interruptedFootnote ** | Total | |
| Sentencing province | ||||||||||||||||
| Newfoundland & Labrador | 0 | 0 | 0 | 0 | 0 | 0 | 0 | 1 | 0 | 13 | 14 | 2 | 1 | 5 | 1 | 9 |
| Nova Scotia | 0 | 0 | 0 | 0 | 4 | 0 | 1 | 3 | 0 | 16 | 24 | 3 | 0 | 6 | 1 | 10 |
| Prince Edward Island | 0 | 0 | 0 | 0 | 1 | 0 | 0 | 0 | 0 | 1 | 2 | 0 | 0 | 0 | 0 | 0 |
| New Brunswick | 0 | 0 | 1 | 0 | 2 | 0 | 0 | 1 | 0 | 8 | 12 | 1 | 0 | 4 | 2 | 7 |
| Quebec | 1 | 2 | 9 | 5 | 91 | 26 | 53 | 24 | 2 | 344 | 557 | 143 | 25 | 153 | 41 | 362 |
| Ontario | 0 | 0 | 1 | 8 | 20 | 16 | 25 | 31 | 0 | 347 | 448 | 72 | 15 | 172 | 29 | 288 |
| Manitoba | 0 | 0 | 0 | 0 | 1 | 2 | 3 | 2 | 0 | 39 | 47 | 5 | 0 | 8 | 7 | 20 |
| Saskatchewan | 0 | 1 | 1 | 1 | 11 | 10 | 13 | 11 | 3 | 88 | 139 | 29 | 4 | 41 | 25 | 99 |
| Alberta | 0 | 0 | 1 | 0 | 9 | 1 | 1 | 1 | 0 | 79 | 92 | 15 | 1 | 25 | 7 | 48 |
| British Columbia | 0 | 0 | 0 | 2 | 14 | 4 | 7 | 7 | 0 | 134 | 168 | 15 | 8 | 61 | 8 | 92 |
| Yukon Territories | 0 | 0 | 0 | 0 | 2 | 0 | 3 | 0 | 1 | 18 | 24 | 3 | 1 | 12 | 0 | 16 |
| Northwest Territories | 0 | 0 | 0 | 0 | 2 | 1 | 0 | 0 | 0 | 5 | 8 | 4 | 0 | 1 | 1 | 6 |
| Nunavut | 0 | 0 | 1 | 1 | 2 | 2 | 0 | 1 | 0 | 5 | 12 | 4 | 0 | 5 | 0 | 9 |
| Total | 1 | 3 | 14 | 17 | 159 | 62 | 106 | 82 | 6 | 1,097 | 1,547 | 296 | 55 | 493 | 122 | 966Footnote *** |
Source: Correctional Service of Canada.
Number of record suspension and pardon applications received: 5-year trend
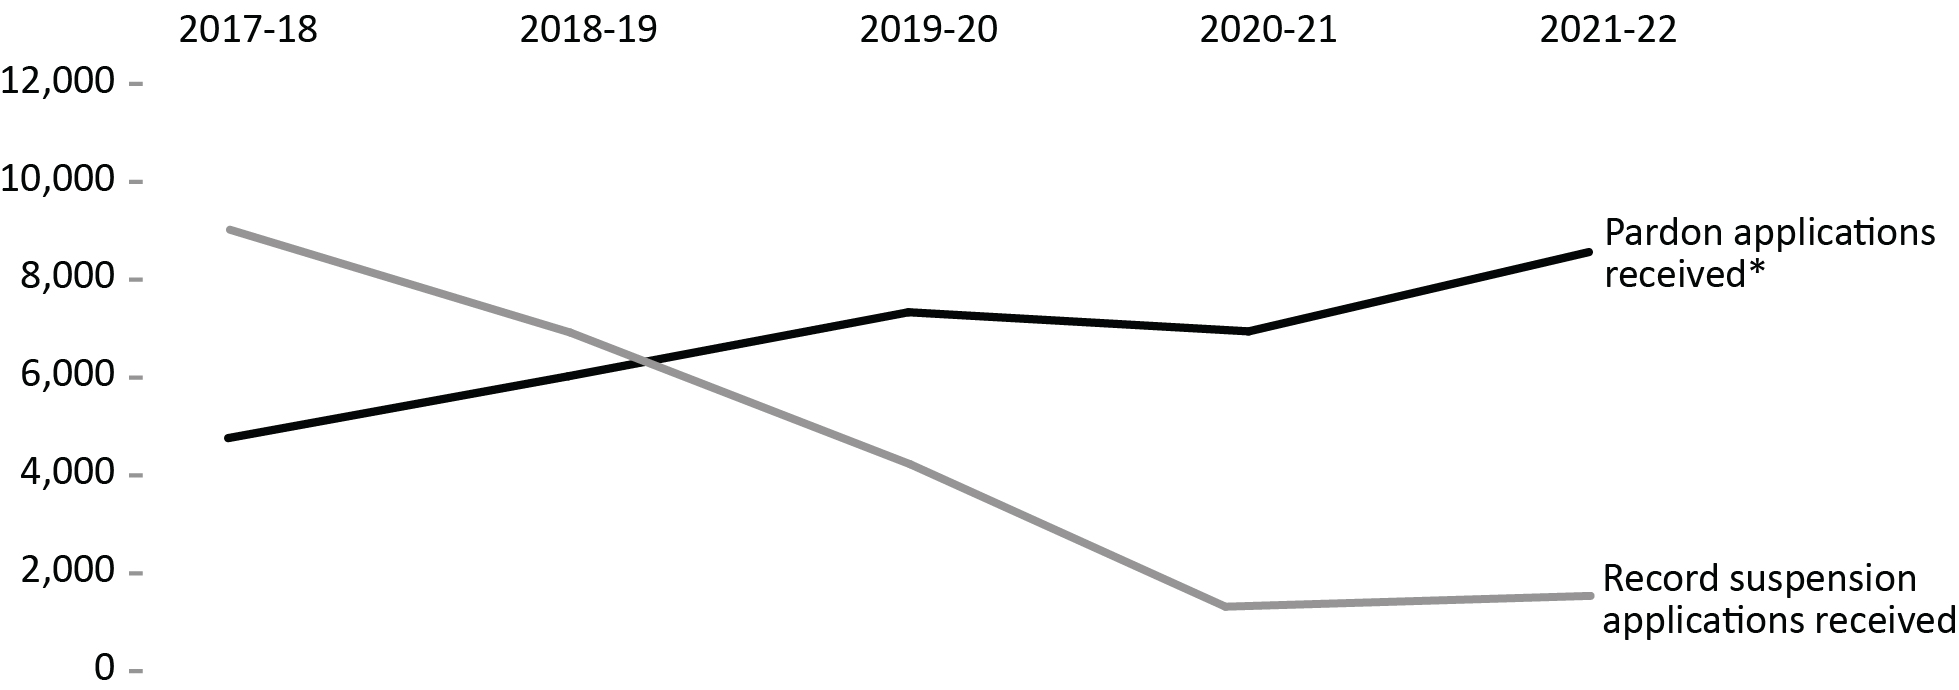
Image description
Line graph showing the number of record suspension and pardons applications received between fiscal year 2017 to 2018 and fiscal year 2021 to 2022. The number of record suspension applications is much higher than the number of pardons applications received in fiscal year 2017 to 2018, at 9,460 record suspension applications compared to 5,202 pardons applications. Record suspension applications then continue on a downward trend whereas pardons applications are on an upward trend, meeting each other in fiscal year 2018 to 2019 at around 7,000 applications. Pardons applications continue to increase to a peak of 9,003 applications in fiscal year 2021 to 2022, while record suspension applications continue to decrease to a low of 1,757 applications in fiscal year 2020 to 2021 which remains relatively stable into fiscal year 2021 to 2022. Full data are available immediately below.
Source: Parole Board of Canada.
- In 2021-22, the Parole Board of Canada received 1,978 record suspension applications and accepted 1,249 applications for processing. The Board also received 9,003 pardon applicationsFootnote * and accepted 6,020 applications for processing. The acceptance rate was 66.2%.
- In 2021-22, the Parole Board of Canada rendered 6,970 pardon decisions, granting/issuing a pardon in 96.5% of cases and denying a pardon in 3.5% of cases.
- In 2021-22, the Parole Board of Canada made 1,615 record suspension decisions; 96.5% of record suspensions were ordered and 3.5% were refused.
- In the past 5 years (from 2017-18 to 2021-22), the number of pardons applications received by the Parole Board of Canada increased by 73.1%. In the same time frame, the number of record suspension applications received decreased by 79.1%.
- Since 1970, when the pardon/record suspension process began, 562,609 pardons/record suspensions have been granted/issued and ordered.
| 2017-18 | 2018-19 | 2019-20 | 2020-21 | 2021-22 | |
|---|---|---|---|---|---|
| Record suspension applications processed | |||||
| Received | 9,460 | 7,360 | 4,667 | 1,757 | 1,978 |
| Accepted | 6,502 | 5,341 | 2,964 | 1,344 | 1,249 |
| % accepted | 68.7 | 72.6 | 63.5 | 76.5 | 63.1 |
| Record suspensions | |||||
| Ordered | 7,037 | 6,028 | 5,287 | 1,403 | 1,559 |
| Refused | 142 | 225 | 209 | 103 | 56 |
| Total ordered/refused | 7,179 | 6,253 | 5,496 | 1,506 | 1,615 |
| % ordered | 98.0 | 96.4 | 96.2 | 93.2 | 96.5 |
| Pardon applications processed | |||||
| Received | 5,202 | 6,466 | 7,774 | 7,383 | 9,003 |
| Accepted | 4,366 | 5,186 | 6,749 | 6,207 | 6,020 |
| % accepted | 83.9 | 80.2 | 86.8 | 84.1 | 66.9 |
| Pardons | |||||
| Granted | 227 | 2,631 | 3,155 | 4,846 | 4,669 |
| Issued | 1,730 | 1,772 | 1,552 | 2,467 | 2,054 |
| Denied | 133 | 42 | 209 | 219 | 247 |
| Total granted/issued/denied | 2,090 | 4,445 | 4,916 | 7,532 | 6,970 |
| % granted/issued | 93.6 | 99.1 | 95.7 | 97.1 | 96.5 |
| Pardon/record suspension revocations/cessations | |||||
| RevocationsFootnote ** | 85 | 59 | 410 | 314 | 251 |
| Cessations | 690 | 527 | 440 | 271 | 307 |
| Total revocations/cessations | 775 | 586 | 850 | 585 | 558 |
| Cumulative # granted/issued and orderedFootnote *** | 525,186 | 535,617 | 545,611 | 554,327 | 562,609 |
| Cumulative # revocations/cessationsFootnote *** | 26,683 | 27,269 | 28,119 | 28,704 | 29,262 |
Source: Parole Board of Canada.
Section F: Federal Services to Registered Victims
Number of contacts with registered victims: 5-year trend
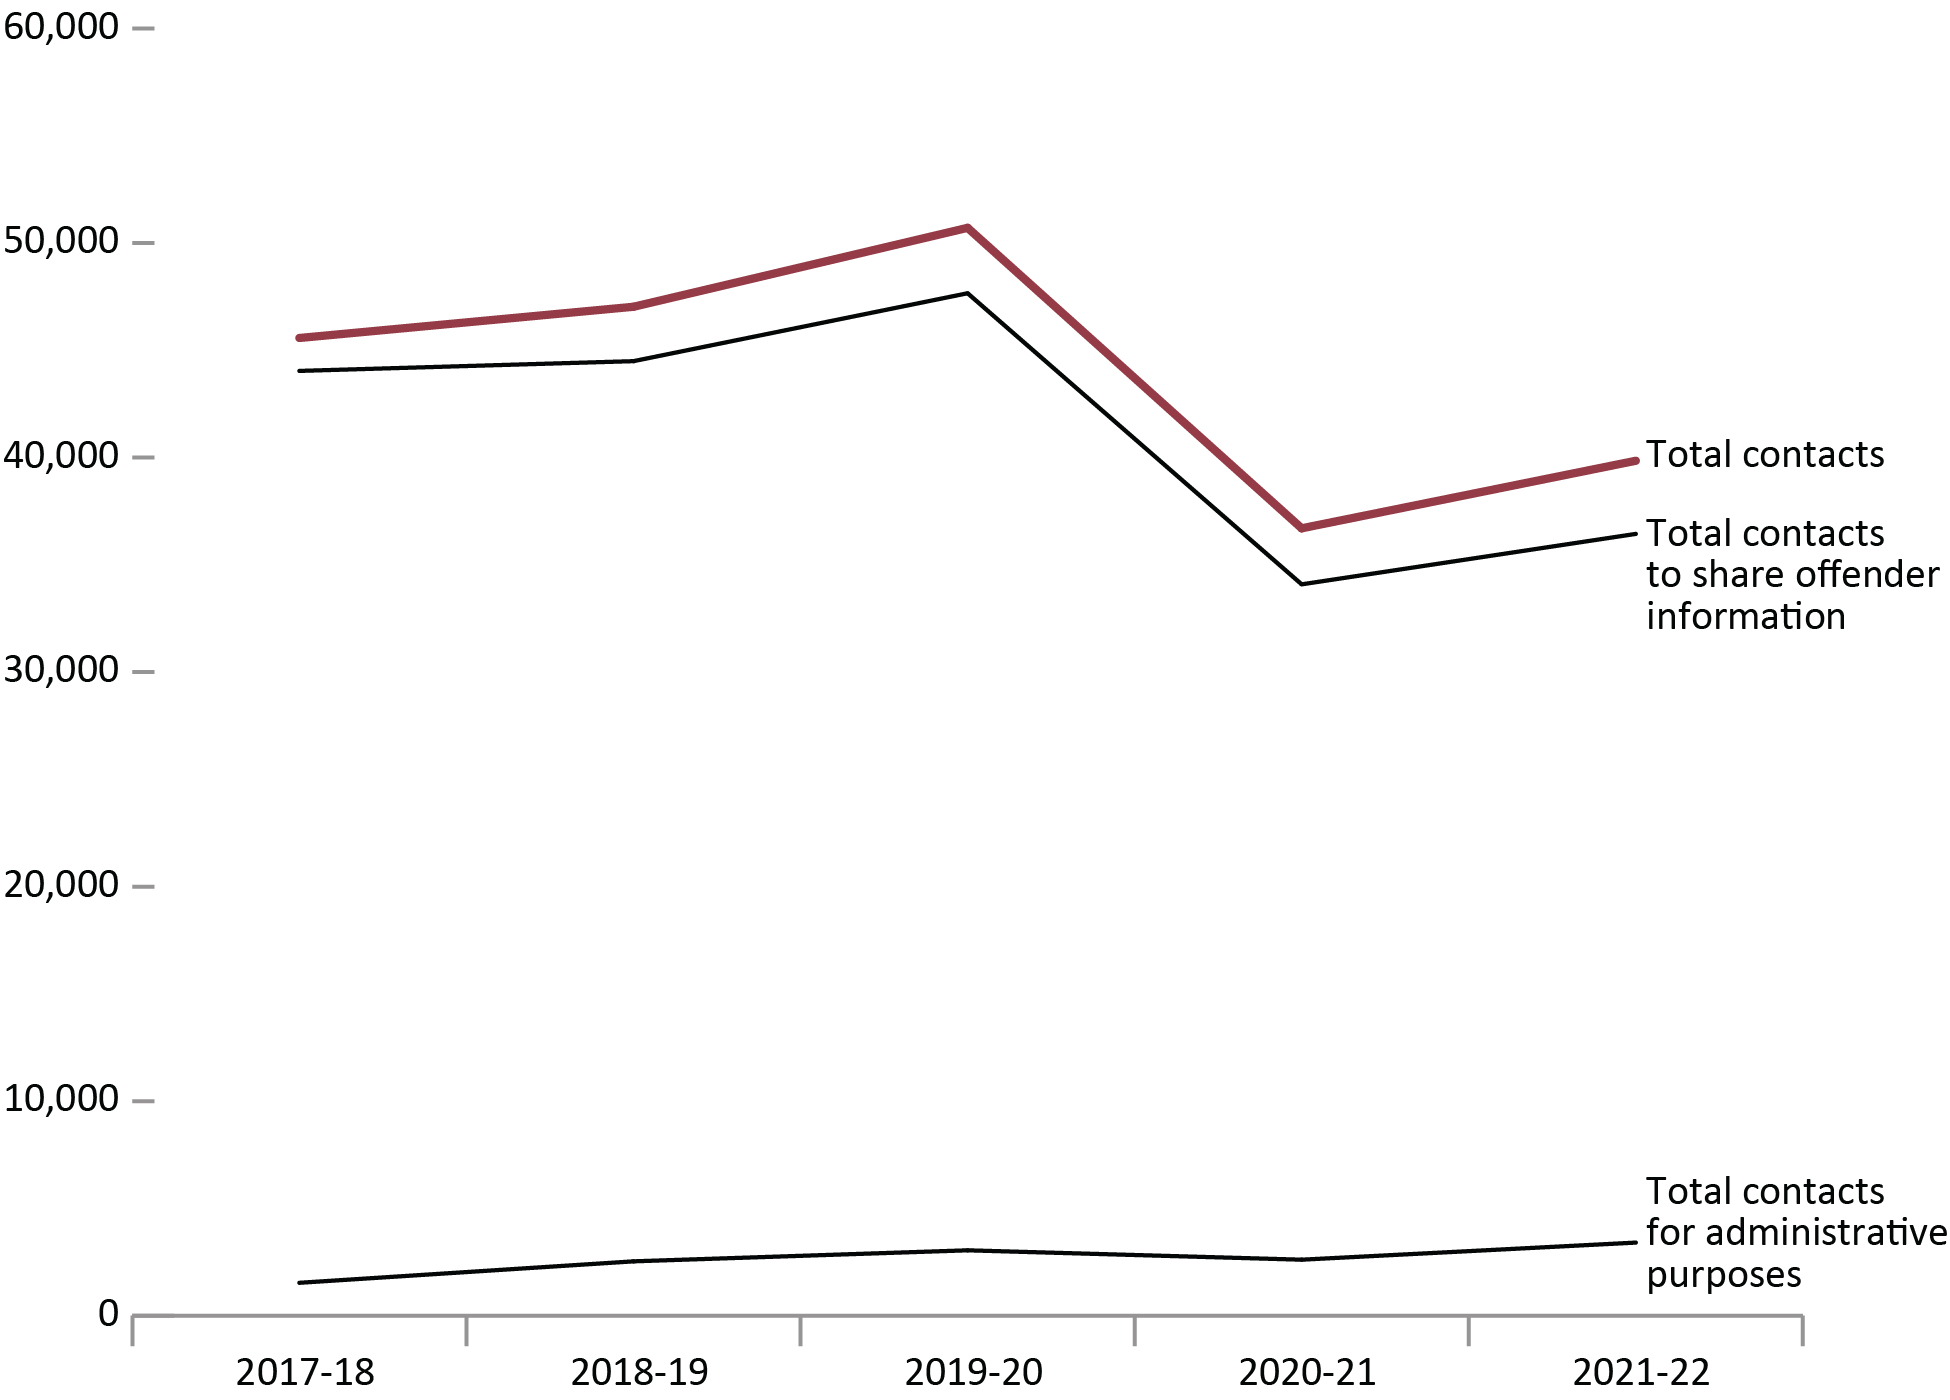
Image description
Line graph of the number of contacts with registered victims, over a five year period between fiscal year 2017 to 2018 and fiscal year 2021 to 2022. Total contacts rose steadily from 45,574 contacts in fiscal year 2017 to 2018 to 50,708 contacts in fiscal year 2019 to 2020, then dropping to 36,703 contacts in fiscal year 2020 to 2021 and rising again to 39,851 contacts in fiscal year 2021 to 2022. Total contacts to share offender information followed a similar trend, rising from 44,039 contacts in fiscal year 2017 to 2018 to 47,659 contacts in fiscal year 2019 to 2020. The number of contacts with registered victims fell precipitously in fiscal year 2020 to 2021 to 34,091 contacts, before increasing in fiscal year 2021 to 2022 to 36,442. Total contacts for administrative purposes were far lower, rising steadily from 1,535 contacts in fiscal year 2017 to 2018 to 3,049 contacts in fiscal year 2019 to 2020, dropping slightly to 2,612 contacts in fiscal year 2020 to 2021, before increasing again to 3,409 contacts in fiscal year 2021 to 2022. Full data are available immediately below.
Source: Correctional Service of Canada.
- The majority of contacts with registered victims (91.4%) were to share offender information. This pattern has remained consistent over the past 5 years (from 2017-18 to 2021-22).
- The total number of contacts with registered victims decreased by 19.5% from 2017-18 to 2020-21 (45,574 to 36,703) and then increased by 8.6% from 2020-21 to 2021-22 (36,703 to 39,851).
Figure F1 Notes
The Canadian Victims Bill of Rights defines a victim as any individual who has suffered physical or emotional harm, property damage, or economic loss as the result of the commission of an offence. The law also allows a spouse, a relative or dependant, an individual who is responsible for the care or support of the victim or the care or support of a dependant of the victim, to act on behalf of a victim, if the victim cannot act on their own behalf. Victims include persons harmed by the offender regardless of whether the offender has been prosecuted or not, as long as an official complaint has been made to the police or to the Crown.
Victims do not automatically receive information about the offender who harmed them. If they have been harmed by an offender serving a sentence of 2 years or more, victims must register with the Correctional Service of Canada (CSC) or the Parole Board of Canada to receive information or access services. Registration allows CSC to verify that the individual meets the definition of victim, which is required by law before sharing protected offender information. https://www.csc-scc.gc.ca/victims/003006-7001-en.shtml
Contacts to share offender information include those where the CSC Victim Services Unit communicates offender information to victims. This might include information such as temporary absences, transfers, travel permits, conditional release, and sentencing information. Contacts for administrative reasons include tasks such as updating contact information, discussing the Restorative Opportunities program, and referrals to provincial or community stakeholders.
Activity types that are used to document either a contact with a victim or an internal administrative task are excluded from the numbers above.
Note that due to an oversight, some contacts were incorrectly reported in the previous CCRSO. The error has been corrected in this version, and the new figures are more representative of the true number of contacts.
Reported data is current up to the end of each fiscal year. A fiscal year runs from April 1 to March 31 of the following year.
| 2017-18 | 2018-19 | 2019-20 | 2020-21 | 2021-22 | |
|---|---|---|---|---|---|
| Total contacts to share offender information | 44,039 | 44,494 | 47,659 | 34,091 | 36,442 |
| Total contacts for administrative purposes | 1,535 | 2,535 | 3,049 | 2,612 | 3,409 |
| Total contacts | 45,574 | 47,029 | 50,708 | 36,703 | 39,851 |
Source: Correctional Service of Canada.
Table F1 Notes
The Canadian Victims Bill of Rights defines a victim as any individual who has suffered physical or emotional harm, property damage, or economic loss as the result of the commission of an offence. The law also allows a spouse, a relative or dependant, an individual who is responsible for the care or support of the victim or the care or support of a dependant of the victim, to act on behalf of a victim, if the victim cannot act on their own behalf. Victims include persons harmed by the offender regardless of whether the offender has been prosecuted or not, as long as an official complaint has been made to the police or to the Crown.
Victims do not automatically receive information about the offender who harmed them. If they have been harmed by an offender serving a sentence of 2 years or more, victims must register with the Correctional Service of Canada (CSC) or the Parole Board of Canada to receive information or access services. Registration allows CSC to verify that the individual meets the definition of victim, which is required by law before sharing protected offender information. https://www.csc-scc.gc.ca/victims/003006-7001-en.shtml
Contacts to share offender information include those where the CSC Victim Services Unit communicates offender information to victims. This might include information such as temporary absences, transfers, travel permits, conditional release, and sentencing information. Contacts for administrative reasons include tasks such as updating contact information, discussing the Restorative Opportunities program, and referrals to provincial or community stakeholders.
Activity types that are used to document either a contact with a victim or an internal administrative task are excluded from the numbers above.
Note that due to an oversight, some contacts were incorrectly reported in the previous CCRSO. The error has been corrected in this version, and the new figures are more representative of the true number of contacts.
Reported data is current up to the end of each fiscal year. A fiscal year runs from April 1 to March 31 of the following year.
Number of victim statements received for consideration in release decisions: 5-year trend
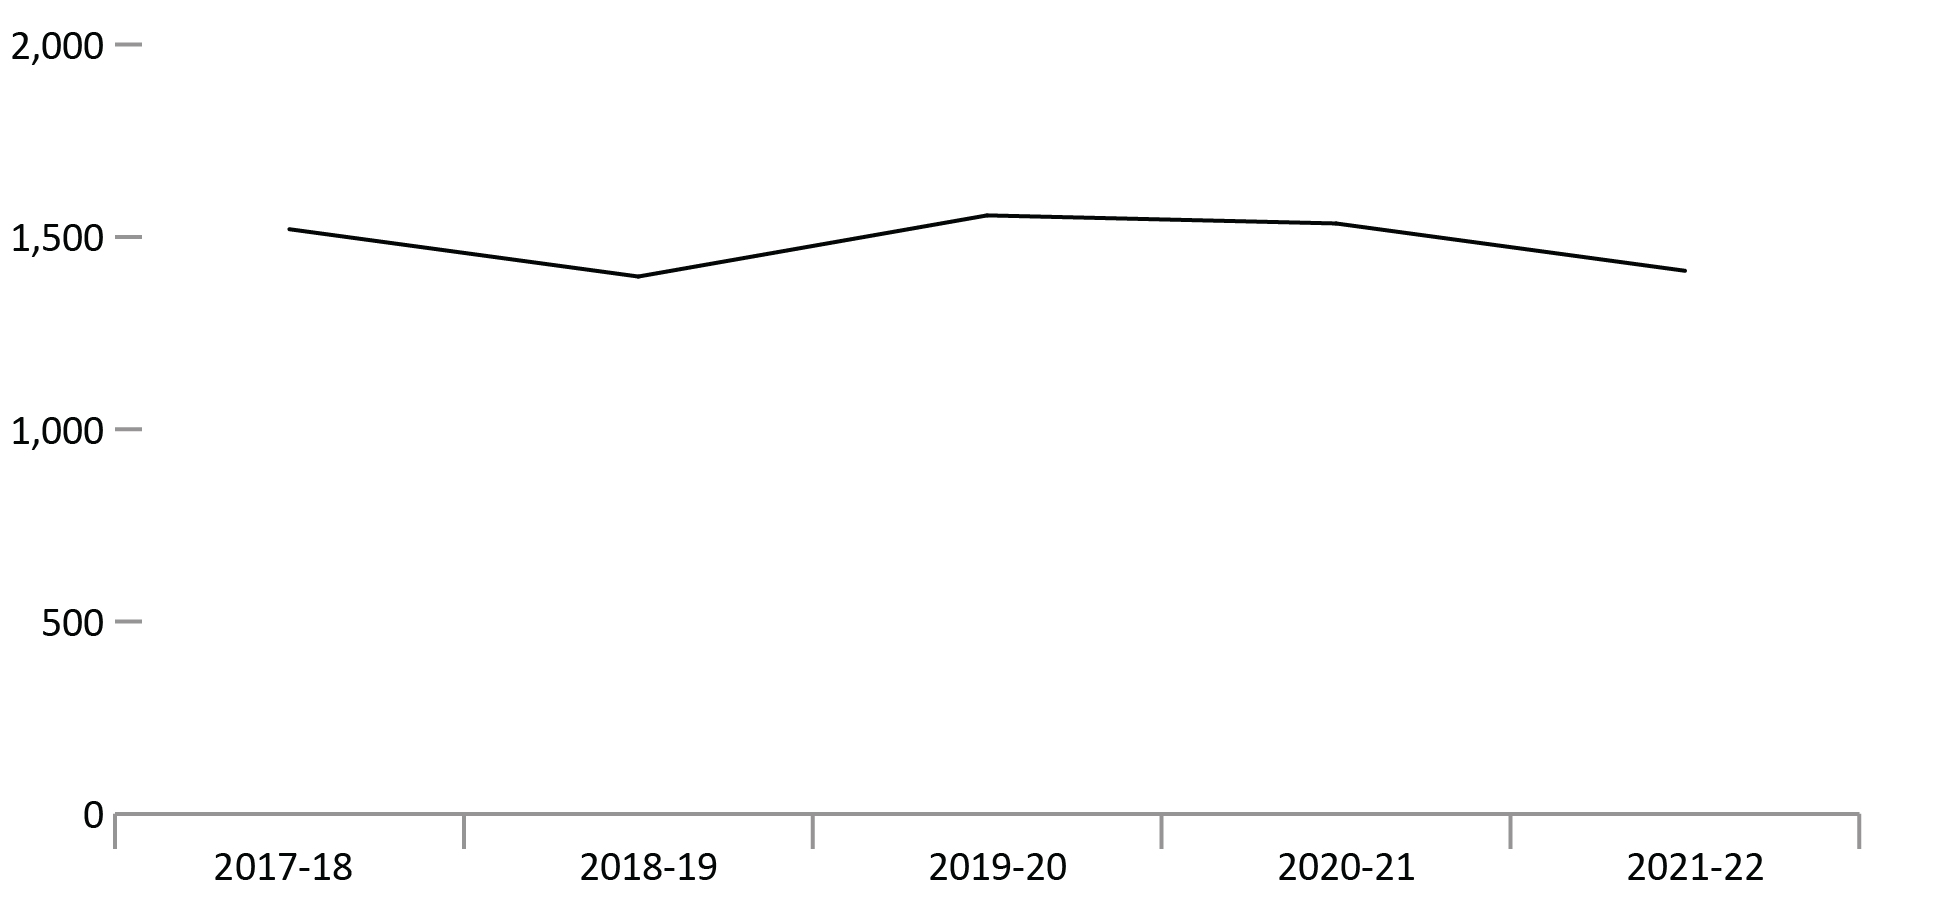
Image description
Line graph showing the number of victim statements received for consideration in release decisions, over a five year period, from fiscal year 2017 to 2018 to fiscal year 2021 to 2022. 1,520 victim statements were received in fiscal year 2017 to 2018, dropping slightly to 1,397 victim statements in fiscal year 2018 to 2019, then rising to 1,556 statements in fiscal year 2019 to 2020, and dropping gradually to 1,412 victim statements in fiscal year 2021 to 2022. Full data are available immediately below.
Source: Correctional Service of Canada.
- The number of victim statements received for consideration decreased by 7.1% from 1,520 in 2017-18 to 1,412 in 2021-22.
Figure F2 Notes
The Canadian Victims Bill of Rights defines a victim as any individual who has suffered physical or emotional harm, property damage, or economic loss as the result of the commission of an offence. The law also allows a spouse, a relative or dependant, an individual who is responsible for the care or support of the victim or the care or support of a dependant of the victim, to act on behalf of a victim, if the victim cannot act on their own behalf. Victims include persons harmed by the offender regardless of whether the offender has been prosecuted or not, as long as an official complaint has been made to the police or to the Crown.
CSC will consider statements from victims who choose not to register.
Not all statements received will be considered when release decisions are made; victims may choose to withdraw their statement before it is considered. In previous years, these withdrawn statements were included in the reported totals, but they have been excluded from the totals above given they are withdrawn before being considered.
Reported data is current up to the end of each fiscal year. A fiscal year runs from April 1 to March 31 of the following year.
| Fiscal year | # |
|---|---|
| 2017-18 | 1,520 |
| 2018-19 | 1,397 |
| 2019-20 | 1,556 |
| 2020-21 | 1,535 |
| 2021-22 | 1,412 |
Source: Correctional Service of Canada.
Table F2 Notes
The Canadian Victims Bill of Rights defines a victim as any individual who has suffered physical or emotional harm, property damage, or economic loss as the result of the commission of an offence. The law also allows a spouse, a relative or dependant, an individual who is responsible for the care or support of the victim or the care or support of a dependant of the victim, to act on behalf of a victim, if the victim cannot act on their own behalf. Victims include persons harmed by the offender regardless of whether the offender has been prosecuted or not, as long as an official complaint has been made to the police or to the Crown.
CSC will consider statements from victims who choose not to register.
Not all statements received will be considered when release decisions are made; victims may choose to withdraw their statement before it is considered. In previous years, these withdrawn statements were included in the reported totals, but they have been excluded from the totals above given they are withdrawn before being considered.
Reported data is current up to the end of each fiscal year. A fiscal year runs from April 1 to March 31 of the following year.
Requests for financial assistance to attend parole hearings: 5-year trend
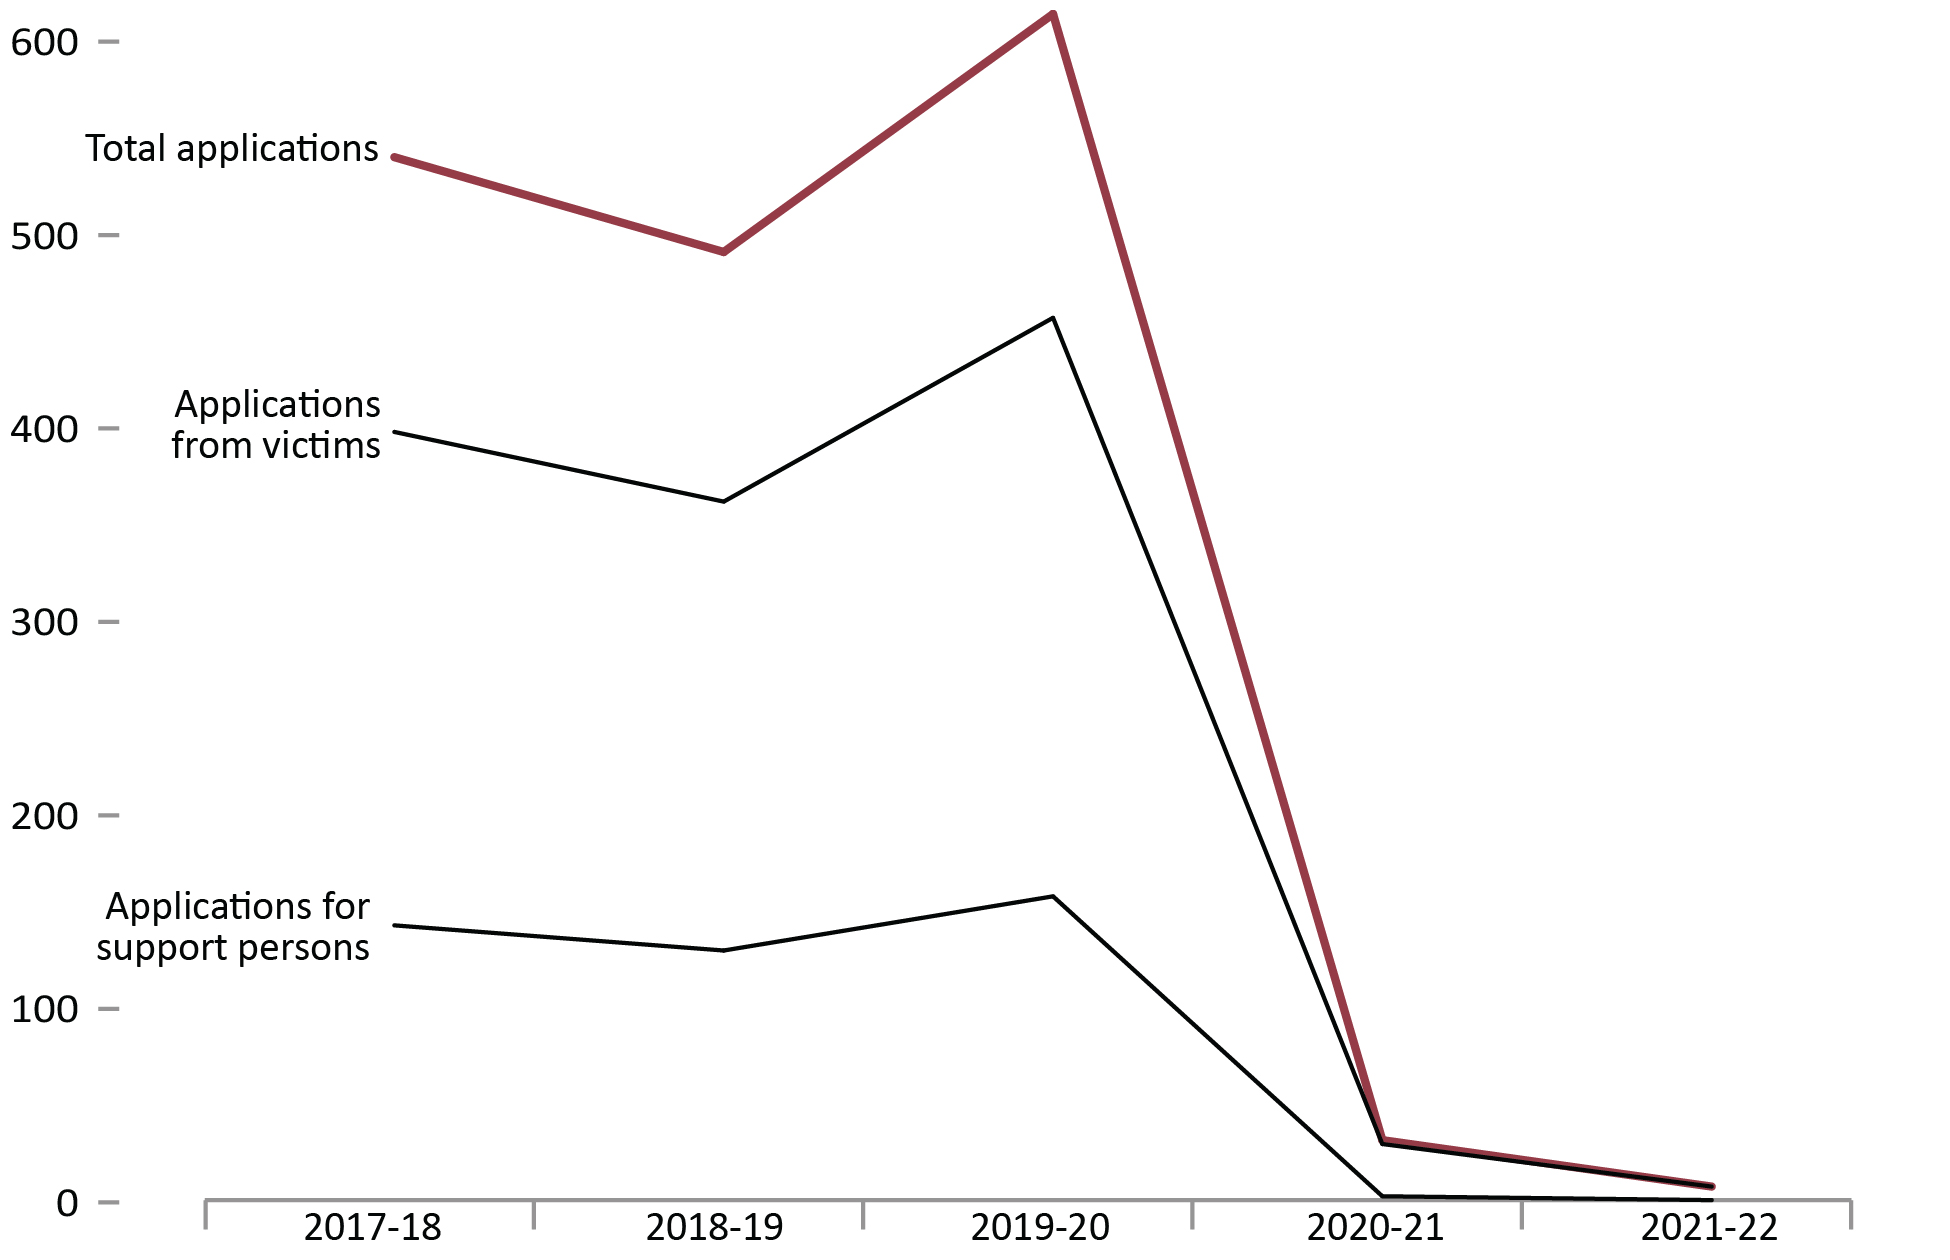
Image description
Line graph of the number of requests for financial assistance to attend parole hearings between fiscal year 2017 to 2018 and fiscal year 2021 to 2022. The trend lines for the number of total applications and applications for victims follow a similar pattern because there are about three or four times more applications from victims as there are applications for support persons. The total number of applications fall from 539 applications in fiscal year 2017 to 2018 to 490 applications in fiscal year 2018 to 2019, then rising to 613 applications in fiscal year 2019 to 2020, before dropping dramatically in the following fiscal years to the lowest point of 7 applications in fiscal year 2021 to 2022.
The number of applications from victims falls from 397 in fiscal year 2017 to 2018 to 361 applications in 2018 to 2019, then rises to 456 requests in fiscal year 2019 to 2020, before dropping dramatically in the following fiscal years to the lowest point of 7 applications in fiscal year 2021 to 2022. In comparison, applications for support persons remained relatively stable, fluctuating between 129 applications and 157 applications from fiscal year 2017 to 2018 until fiscal year 2019 to 2020, after which point there is a dramatic drop to 2 applications in fiscal year 2020 to 2021 and 0 applications in the fiscal year 2021 to 2022. Full data are available immediately below.
Source: Justice Canada.
- The number of victim applications for financial assistance fluctuated between 2017-18 and 2019-20 and then had a sharp decline between 2019-20 and 2021-22. This decline was impacted by the COVID-19 pandemic related restrictions and limited access to CSC institutions, which began in mid-March 2020. To adapt to COVID-19, Parole Board of Canada hearings were conducted primarily by teleconference and/or video conference in 2020-21 and 2021-22.
Figure F3 Notes
Victims can apply for financial assistance for a support person to accompany them to a parole hearing.
Reported year periods reflect fiscal years. A fiscal year runs from April 1 to March 31 of the following year.
| 2017-18 | 2018-19 | 2019-20 | 2020-21 | 2021-22 | |
|---|---|---|---|---|---|
| Number of applications for financial assistance received from victims | 397 | 361 | 456 | 29 | 7 |
| Number of applications for financial assistance received from support persons | 142 | 129 | 157 | 2 | 0 |
Total number of applications |
539 | 490 | 613 | 31 | 7 |
Source: Justice Canada.
Table F3 Notes
Victims can apply for financial assistance for a support person to accompany them to a parole hearing.
Reported year periods reflect fiscal years. A fiscal year runs from April 1 to March 31 of the following year.
Number of Parole Board of Canada contacts with victims: 10-year trend
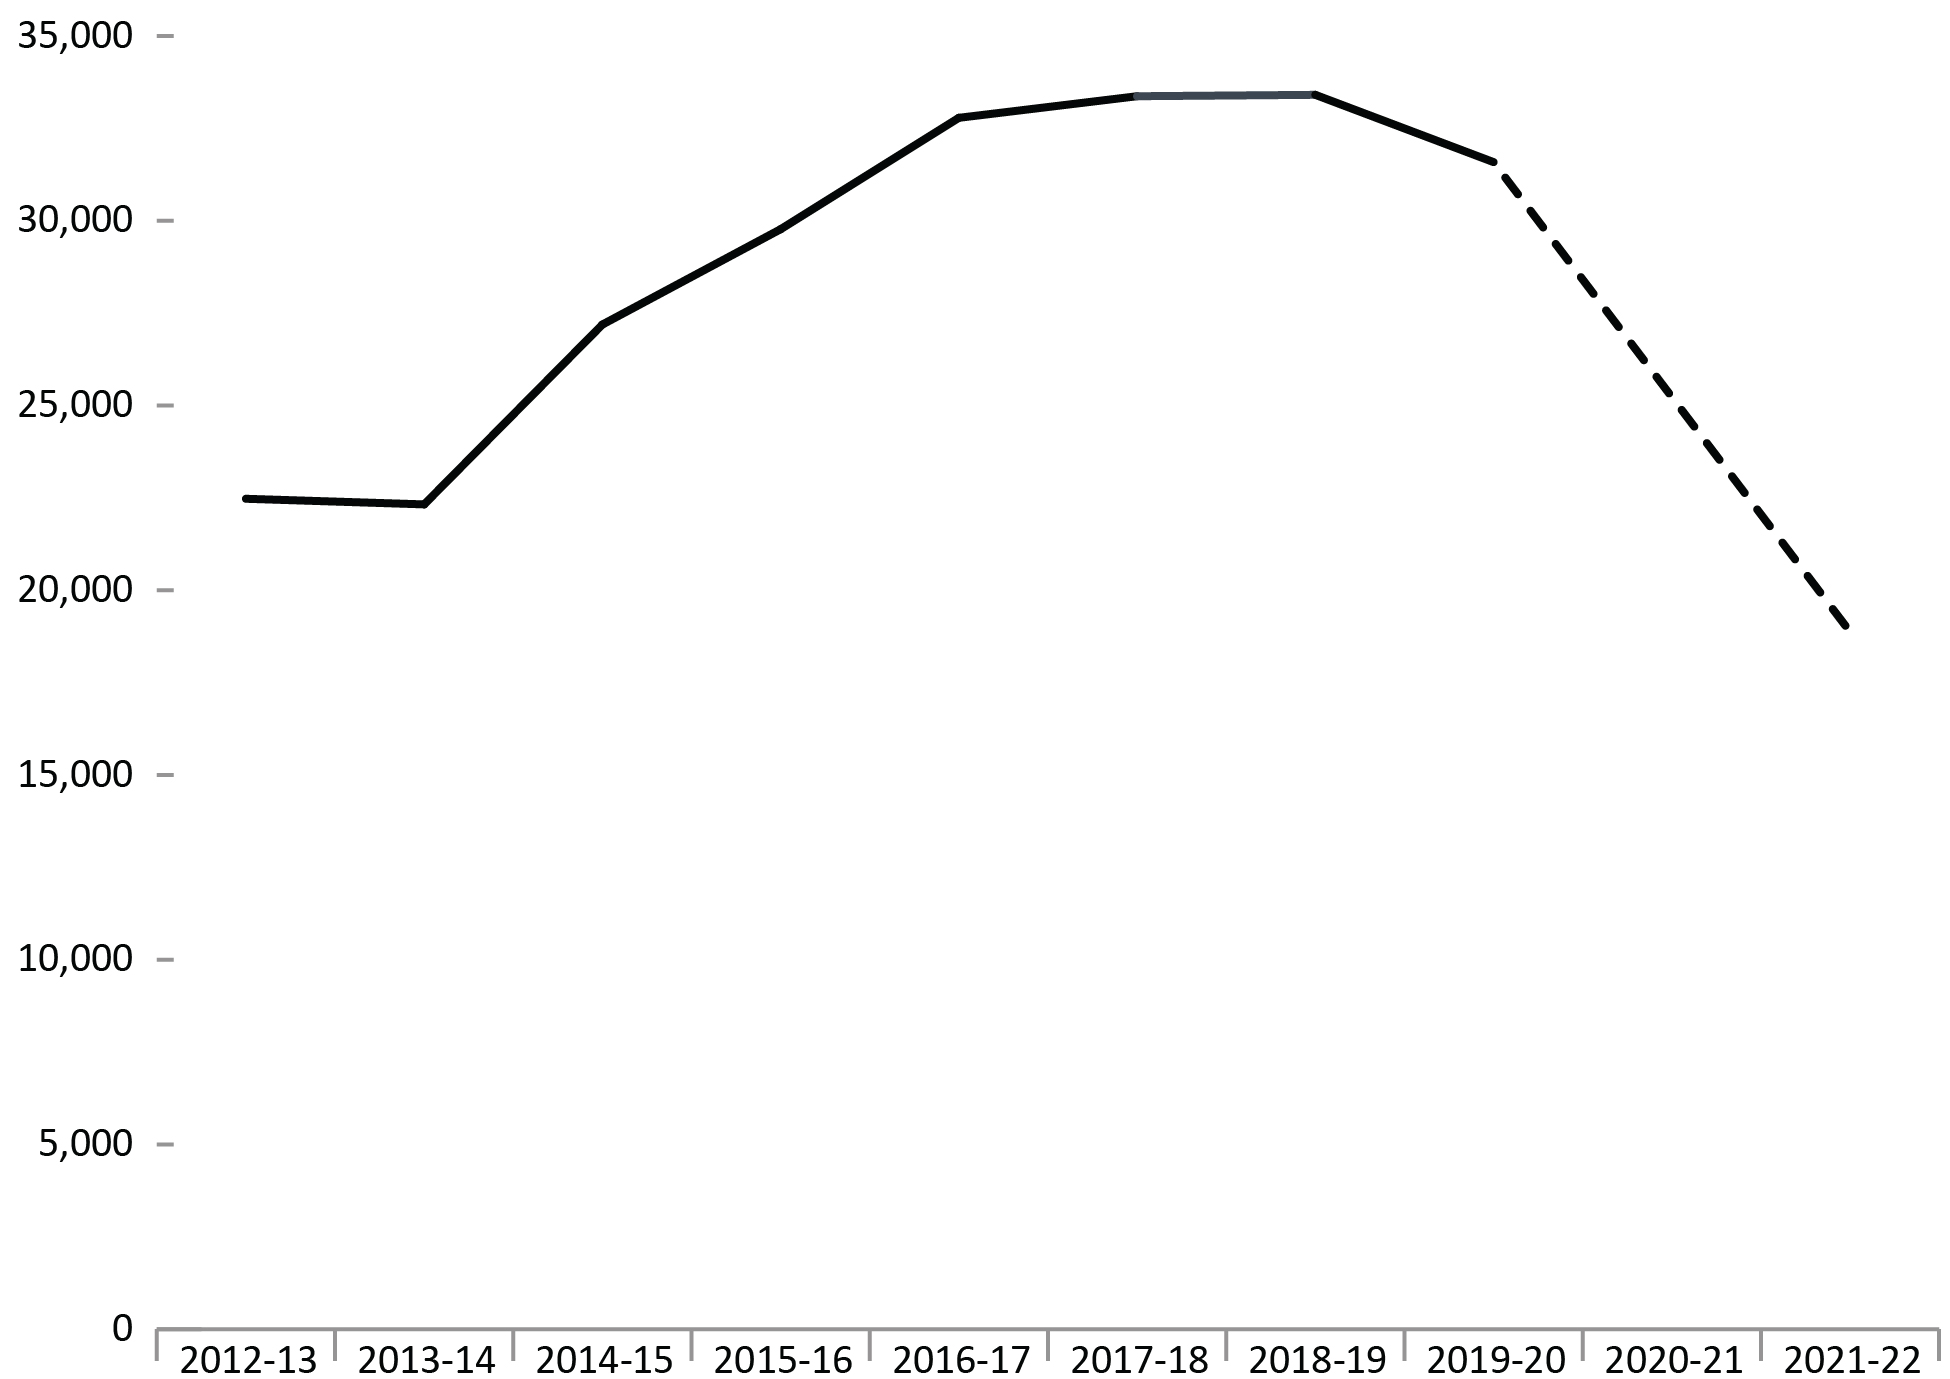
Image description
Line graph of the number of victims that are formally contacted by the Parole Board of Canada, between fiscal year 2012 to 2013 and fiscal year 2021 to 2022. Between fiscal year 2012 to 2013 and 2013 to 2014, the number of contacts was relatively stable at around 22,500 contacts with victims. The number of contacts then rose from this level to crest at around 32,000 contacts between fiscal year 2016 to 2017 and fiscal year 2019 to 2020. In fiscal year 2021 to 2022 the number of contacts drops to 18,839 contacts with victims a year. Full data are available immediately below.
Source: Parole Board of Canada.
- In 2021-22, the Parole Board of Canada (PBC) reported 18,859 contacts with victims, a decrease of 40.3% compared to 2019-20.
- In the past 10 years (from 2012-13 to 2021-22), the number of PBC contacts with victims decreased by 16.1% (3,616 fewer contacts).
Figure F4 Notes
The dotted line between 2019-20 and 2021-22 is intended to signify that the data for 2020-21 are not available as the Parole Board of Canada (PBC) transitioned from manual data collection to using an automated system, Victims Application Module, during this timeframe. The reduction in PBC contacts with victims between 2019-20 and 2021-22 is also the result of this transition to an automated system. A victim contact refers to each time the PBC has contact with a victim by mail, fax, telephone, in person, or through the Victims Portal.
Reported year periods reflect fiscal years. A fiscal year runs from April 1 to March 31 of the following year.
| Fiscal yearFootnote * | Number of contacts |
|---|---|
| 2012-13 | 22,475 |
| 2013-14 | 22,323 |
| 2014-15 | 27,191 |
| 2015-16 | 29,771 |
| 2016-17 | 32,786 |
| 2017-18 | 33,370 |
| 2018-19 | 33,408 |
| 2019-20 | 31,587 |
| 2020-21 | NA |
| 2021-22 | 18,859 |
Source: Parole Board of Canada.
Victim presentations at PBC Hearings: 10-year trend
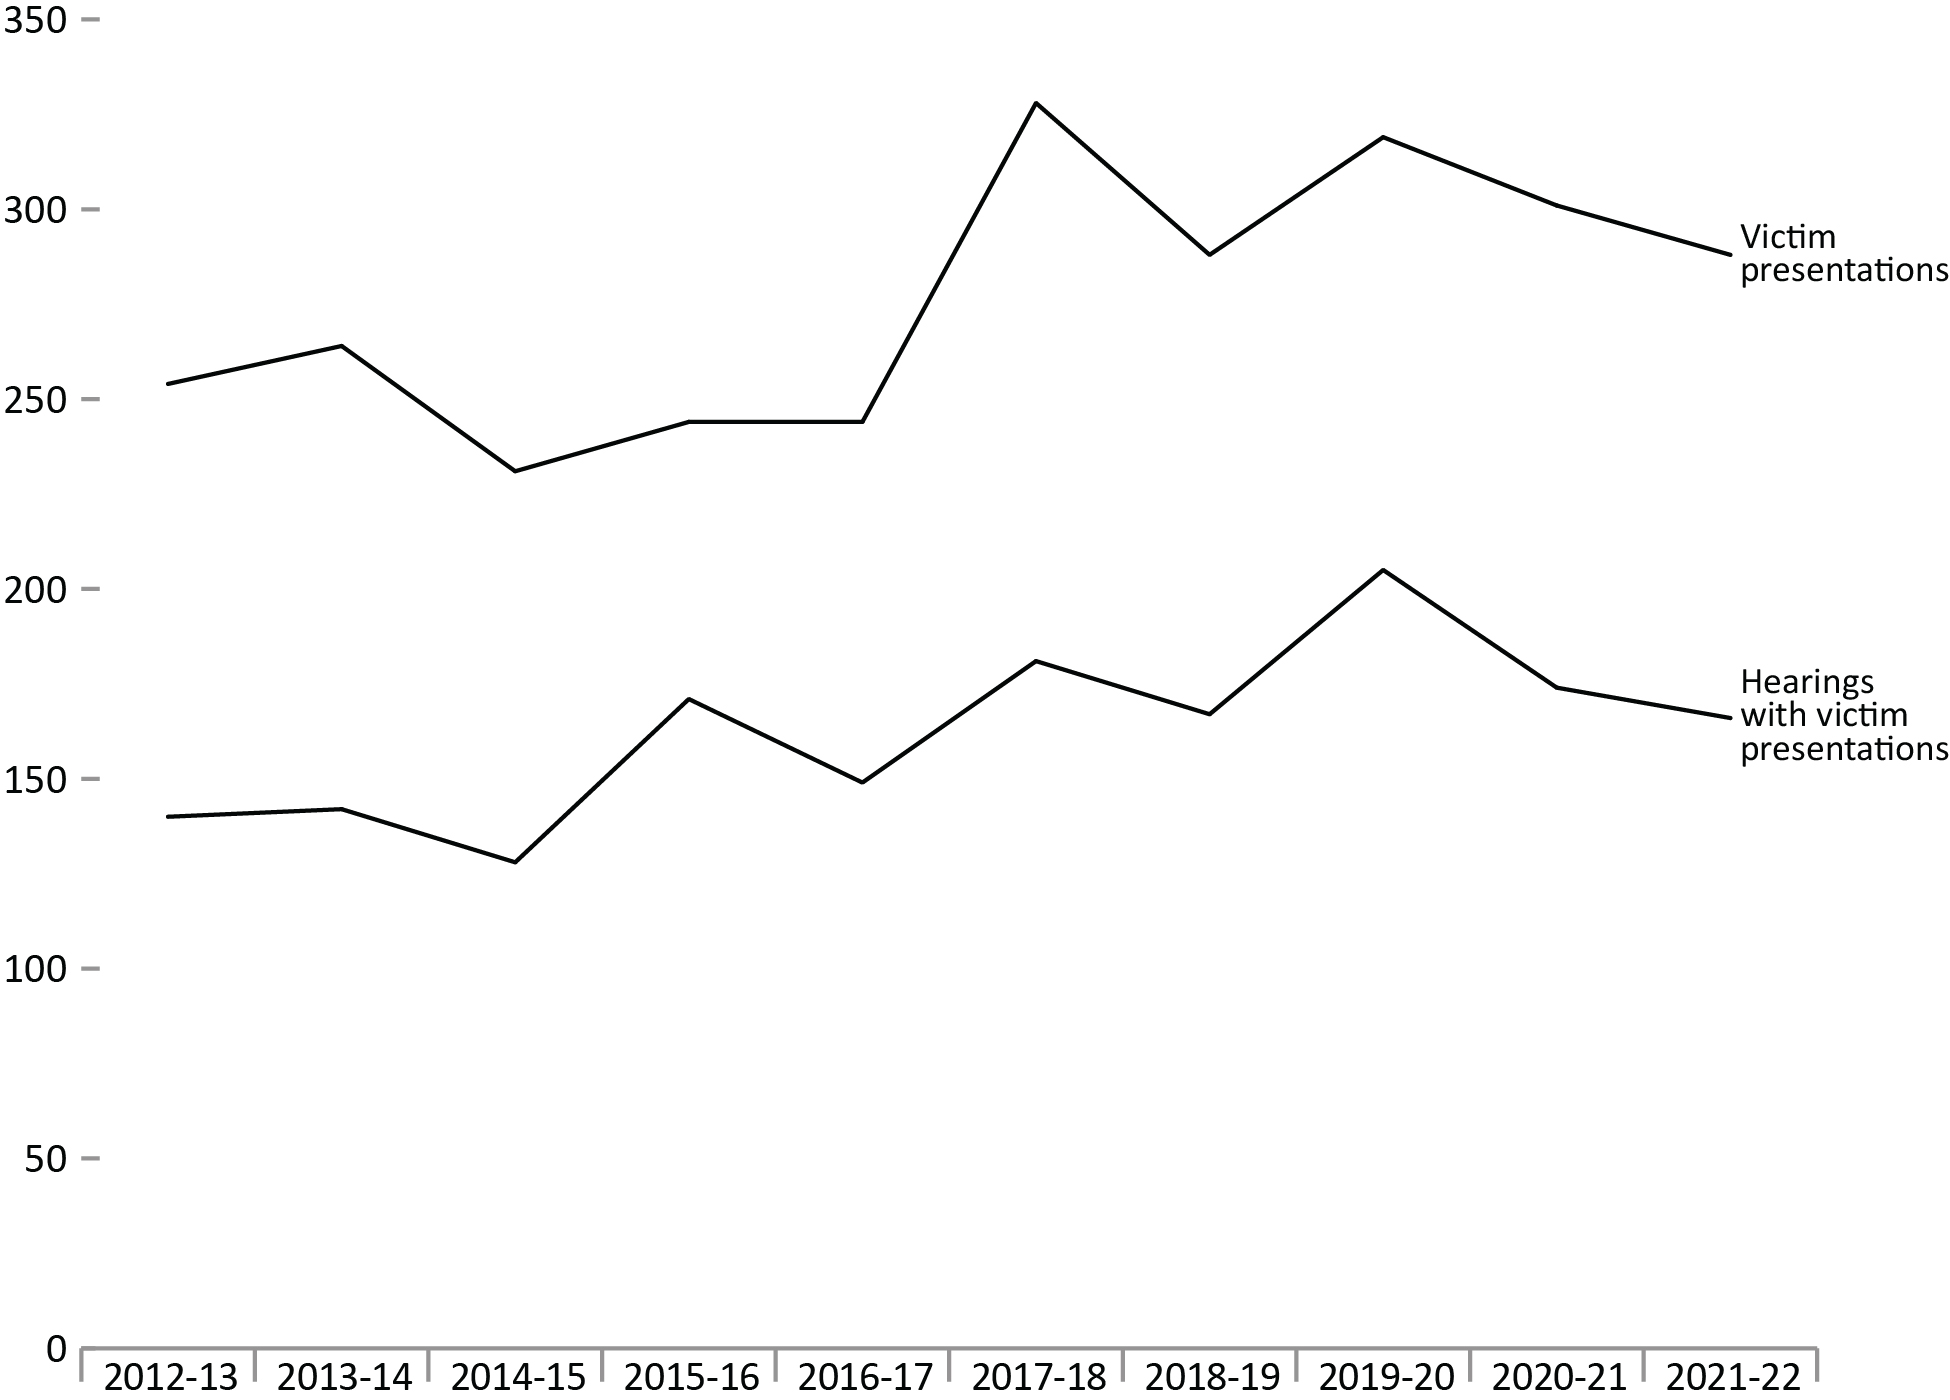
Image description
Line graph showing the number of victim presentations and the number of hearings with victim presentations, between fiscal year 2012 to 2013 and fiscal year 2021 to 2022. The two lines follow roughly the same trend, with victim presentations averaging around 100 counts higher than hearings with victim presentations. Victim presentations increase slightly from 254 victim presentations in fiscal year 2012 to 2013 to 264 victim presentations in fiscal year 2013 to 2014, followed by a drop to 231 victim presentations in fiscal year 2014 to 2015, after which point it gradually increases to 321 presentations in fiscal year 2017 to 2018. Victim presentations hover around 300 until the last year of available data, in fiscal year 2021 to 2022. Meanwhile, hearings with victims presentations saw a gradual increase – with slight fluctuations – from 140 hearings in fiscal year 2012 to 2013 to 205 hearings in fiscal year 2019 to 2020, before dropping to 166 hearings in fiscal year 2021 to 2022. Full data are available immediately below.
Source: Parole Board of Canada.
- In 2021-22, victims made 288 presentations (a decrease of 4.3% or 13 fewer presentations) at 166 hearings (a decrease of 4.6% or 8 fewer hearings) compared to 2020-21.
- The total number of Parole Board of Canada hearings have decreased. Between 2020-21 and 2021-22, there was a 12.9% decrease (794 fewer hearings) in the number of hearings (with or without victim presentations).
- In the past 10 years (from 2012-13 to 2021-22), the number of presentations made by victims at hearings has been fluctuating. This number increased by 13.4% (34 more presentations) between 2012-13 and 2021-22.
- In 2021-22, 95.1% of victim presentations at hearings were made by victims themselves. In 3.8% of these cases, victims presented their statement using other media and in 1.0% of hearings, a presentation was made on the victim’s behalf.
Figure F5 Notes
Reported year periods reflect fiscal years. A fiscal year runs from April 1 to March 31 of the following year.
| Fiscal year | Number of hearings with presentations | Number of presentations |
|---|---|---|
| 2012-13 | 140 | 254 |
| 2013-14 | 142 | 264 |
| 2014-15 | 128 | 231 |
| 2015-16 | 171 | 244 |
| 2016-17 | 149 | 244 |
| 2017-18 | 181 | 328 |
| 2018-19 | 167 | 288 |
| 2019-20 | 205 | 319 |
| 2020-21 | 174 | 301 |
| 2021-22 | 166 | 288 |
Source: Parole Board of Canada.
Table F5 Notes
Reported year periods reflect fiscal years. A fiscal year runs from April 1 to March 31 of the following year.
Number of requests made by victims to access the PBC decision registry: 10-year trend
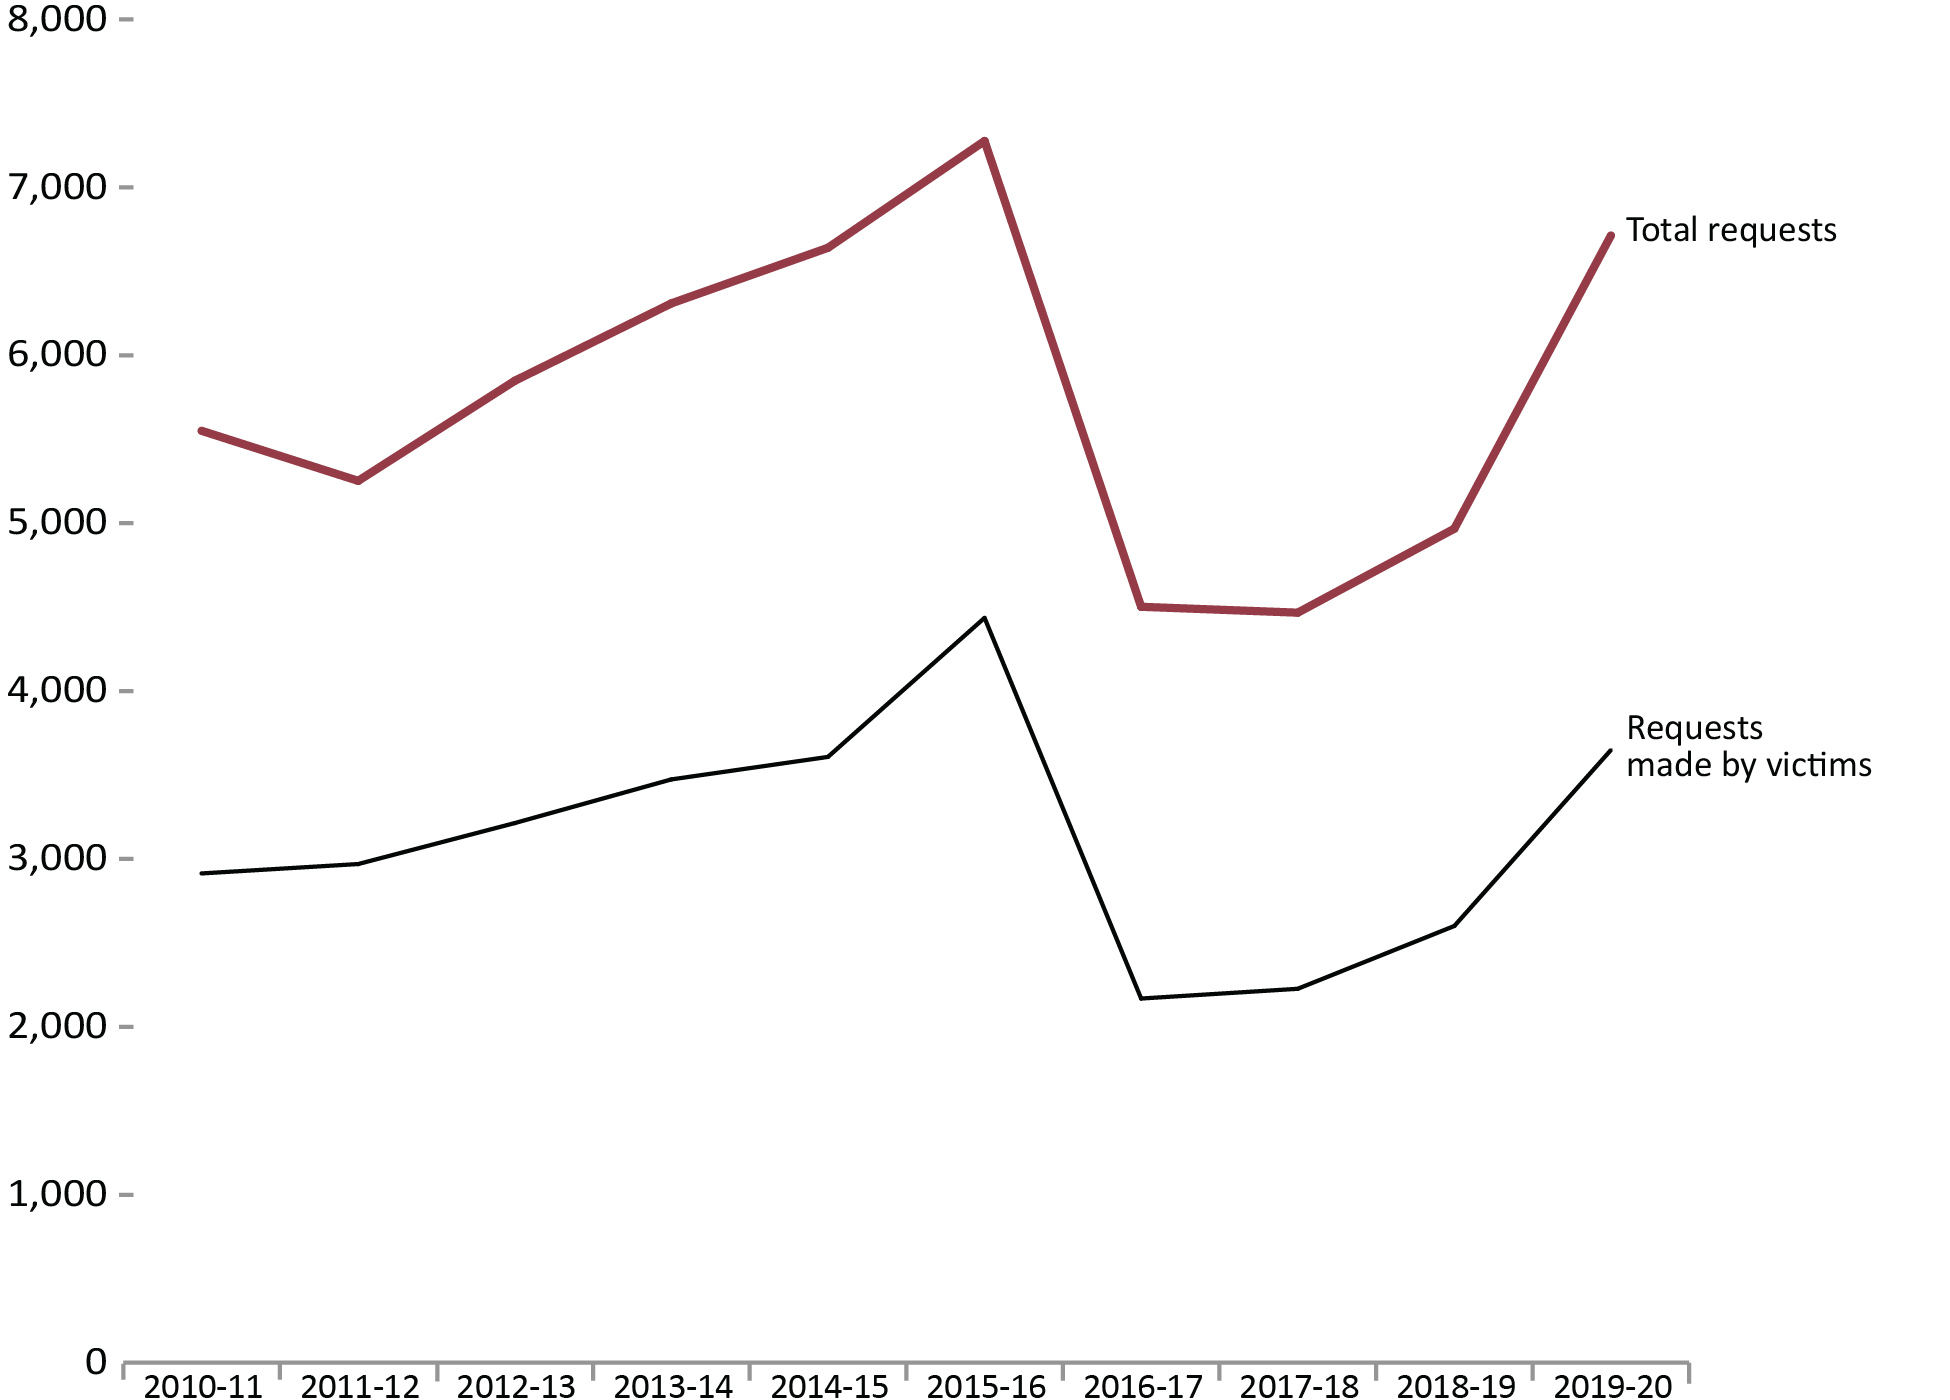
Image description
Line graph of the number of requests to access the decision registry and the number of requests made by victims to access the decision registry, between fiscal year 2010 to 2011 and fiscal year 2019 to 2020. The lines for total requests and requests made by victims follow a similar trend, with total requests averaging around 3,000 requests more. Total requests dropped briefly from 5,550 requests in fiscal year 2010 to 2011 to 5,252 requests in fiscal year 2011 to 2012, after which point there was an increase year-over-year until fiscal year 2015 to 2016 where it reached a peak of 7,276 requests. The number of total requests then declined drastically in fiscal year 2016 to 2017 to 4,502 requests and remained relatively stable until an uptick to 6,713 requests in fiscal year 2019 to 2020. Requests made by victims went from 2,914 requests in fiscal year 2010 to 2011 to a peak of 4,436 requests in fiscal year 2015 to 2016, then dropping to an all time low of 2,169 requests in fiscal year 2016 to 2017, after which point the number of requests made by victims rises gradually to 3,649 requests fiscal year 2019 to 2020. Full data are available immediately below.
Source: Parole Board of Canada.
- In 2019-20, the number of requests to access the decision registry made by victims increased by 40.3% to 3,649 and the proportion of requests made by victims increased 2.0% to 54.4% compared to 2018-19.
| Fiscal year | Requests made by victims | Total number of requests | |
|---|---|---|---|
| # | % | ||
| 2010-11 | 2,914 | 52.5 | 5,550 |
| 2011-12 | 2,970 | 56.5 | 5,252 |
| 2012-13 | 3,214 | 55.0 | 5,848 |
| 2013-14 | 3,474 | 55.1 | 6,309 |
| 2014-15 | 3,608 | 54.3 | 6,640 |
| 2015-16 | 4,436 | 61.0 | 7,276 |
| 2016-17 | 2,169 | 48.2 | 4,502 |
| 2017-18 | 2,227 | 49.9 | 4,467 |
| 2018-19 | 2,601 | 52.4 | 4,967 |
| 2019-20 | 3,649 | 54.4 | 6,713 |
Source: Parole Board of Canada.
Number of decisions sent from PBC decision registry
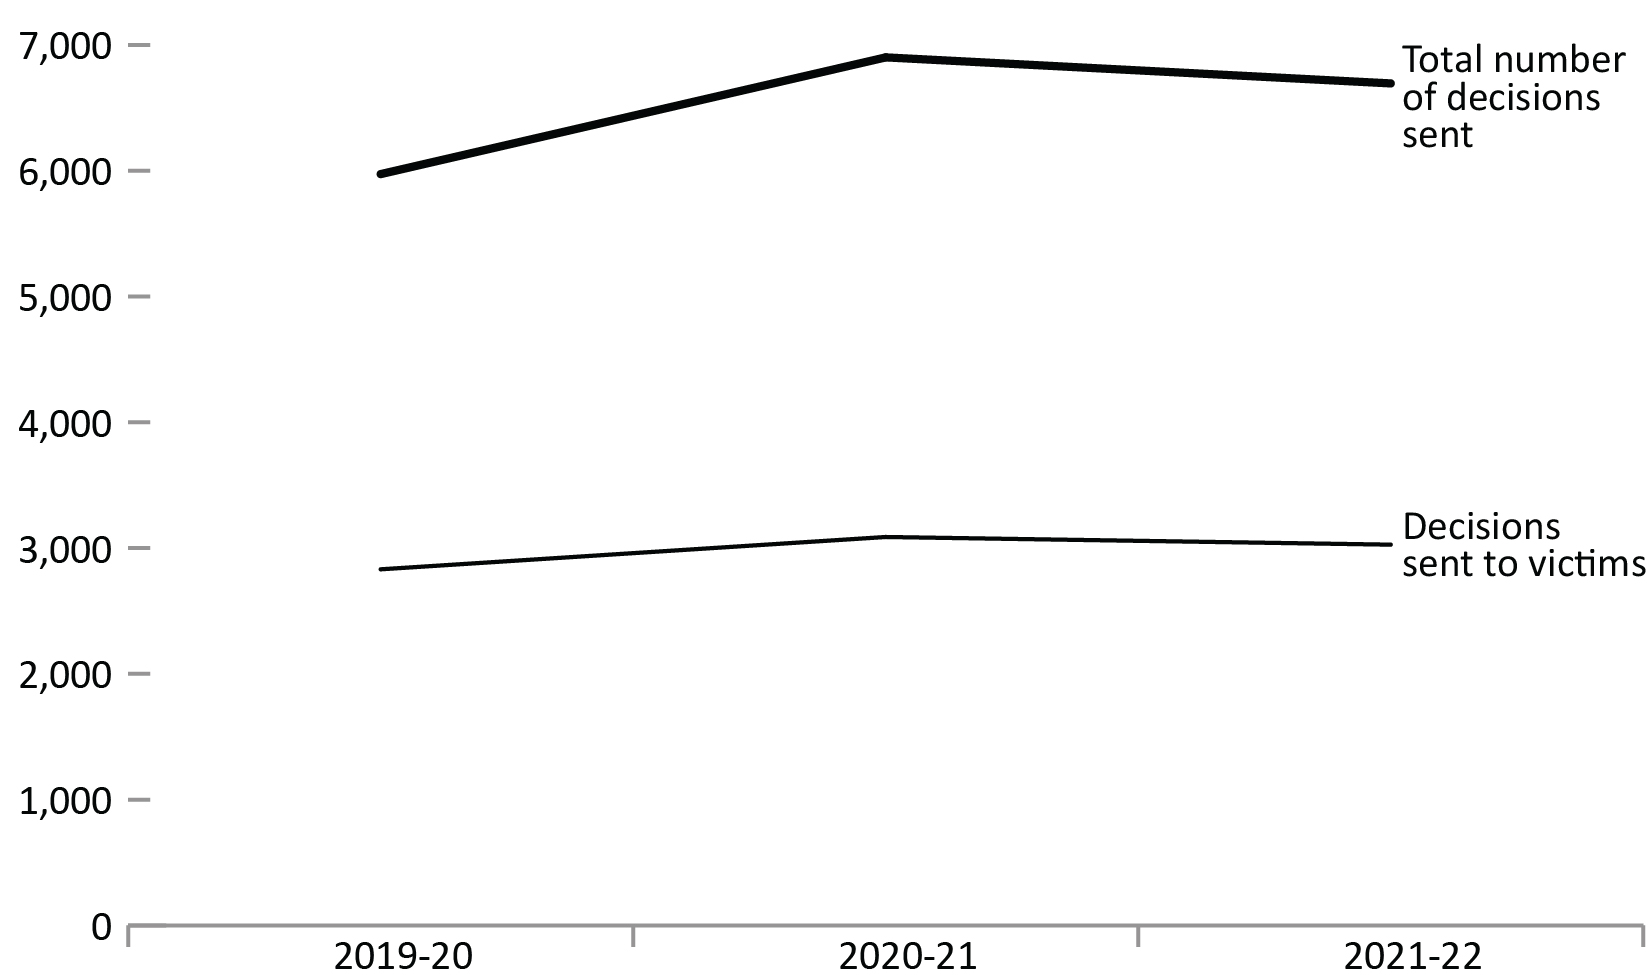
Image description
Line graph describing the total number of decisions sent from Line graph showing the total number of decisions sent from the Parole Board of Canada decision registry and the number of decisions sent to victims, between fiscal year 2019 to 2020 and fiscal year 2021 to 2022. The total number of decisions increases from 5,973 decisions in fiscal year 2019 to 2020 to a peak of 6,901 decisions in fiscal year 2020 to 2021, before dropping slightly to 6,694 decisions in fiscal year 2021 to 2022. Decisions sent to victims increased from 2,831 decisions in fiscal year 2019 to 2020 to 3,088 decisions in fiscal year 2020 to 2021, before dropping slightly to 3,027 decisions in fiscal year 2021 to 2022. Full data are available immediately below.
Source: Parole Board of Canada.
- Compared to 2020-21, the number of decisions sent to victims from the decision registry in 2021-22 decreased by 2.0% to 3,027, while the proportion of decisions sent to victims remained stable (45.2%; +0.5%).
| Fiscal year | Decisions sent to victims | Total number of decisions sent | |
|---|---|---|---|
| # | % | ||
| 2019-20 | 2,831 | 47.4 | 5,973 |
| 2020-21 | 3,088 | 44.7 | 6,901 |
| 2021-22 | 3,027 | 45.2 | 6,694 |
Source: Parole Board of Canada.
- Date modified: