Public Safety Canada Quarterly Financial Report
For the quarter ended June 30, 2017
Table of contents
- 1.0 Introduction
- 2.0 Highlights of Fiscal Quarter and Fiscal Year-to-Date (YTD) Results
- 3.0 Risks and Uncertainty
- 4.0 Significant Changes in Relation to Operations, Programs and Personnel
- 5.0 Approval by Senior Officials
- 6.0 Statement of Authorities (unaudited)
- 7.0 Departmental budgetary expenditures by Standard Object (unaudited)
1.0 Introduction
This quarterly financial report for the period ending June 30, 2017 has been prepared by management as required by section 65.1 of the Financial Administration Act, in the form and manner prescribed by Treasury Board. The report should be read in conjunction with the Main Estimates and the Supplementary Estimates, as well as Building a Strong Middle Class (Budget 2017).
This quarterly financial report has not been subject to an external audit or review. However, it has been reviewed by the Departmental Audit Committee prior to approval by senior officials.
Information on the mandate, roles, responsibilities and programs of Public Safety Canada can be found in the 2017-18 Departmental Plan and the 2017-18 Main Estimates.
1.1 Basis of Presentation
This quarterly report has been prepared using an expenditure basis of accounting. The accompanying Statement of Authorities table includes the Department's spending authorities granted by Parliament, or received from Treasury Board Central Votes, and those used by the Department consistent with the Main Estimates and the Supplementary Estimates (A) for the 2017-18 fiscal year. This quarterly report has been prepared using a special purpose financial reporting framework designed to meet the information needs concerning the use of spending authorities.
The authority of Parliament is required before funds can be spent by the Government. Approvals are given in the form of annually approved limits through Appropriation Acts or through legislation in the form of statutory spending authority for specific purposes.
Public Safety Canada uses the full accrual method of accounting to prepare and present its annual departmental financial statements that are part of the departmental performance reporting process. However, the spending authorities voted by Parliament remain on an expenditure basis, as do the expenditures presented in this report.
2.0 Highlights of Fiscal Quarter and Fiscal Year-to-Date (YTD) Results
The following graph provides a comparison of the net budgetary authorities and expenditures as of June 30, 2017 and June 30, 2016 for the Department's combined:
- Vote 1: Operating Expenditures;
- Vote 5: Grants and Contributions;
- Statutory Votes:
- Employee Benefit Plans; and
- Minister's Salary and Car Allowance.
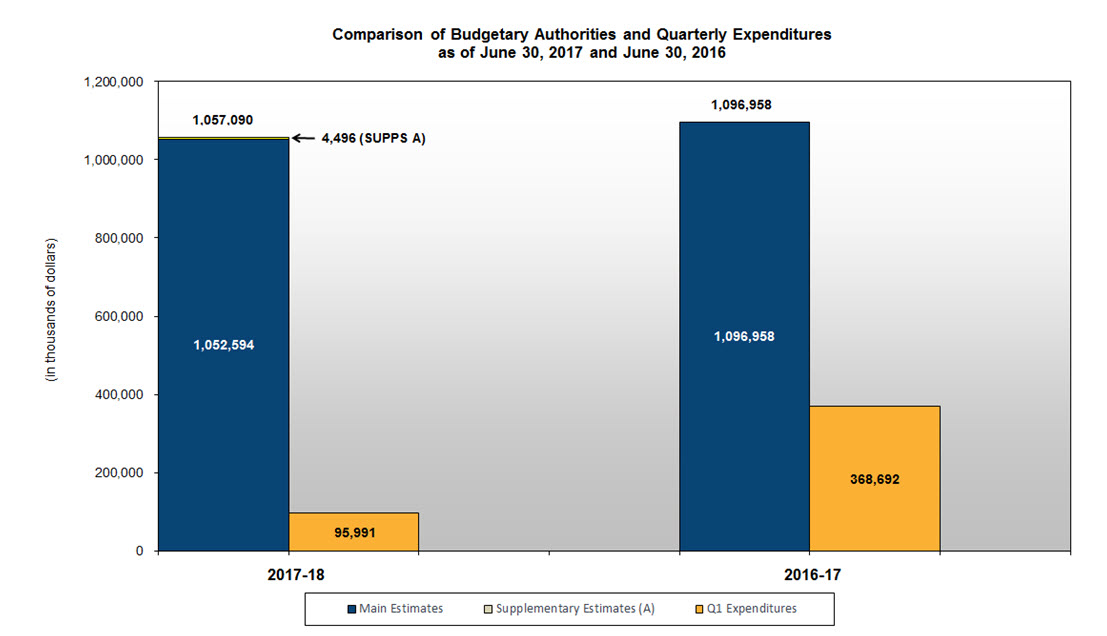
Image description
| 2017-18 | 2016-17 | |
|---|---|---|
| Main Estimates | 1,052,594 | 1,096,958 |
| Supplementary Estimates (A) | 4,496 | 0 |
| Q1 Expenditures | 95,991 | 368,692 |
Note: The 2017-18 Supplementary Estimates "A" (SUPPS A) amounted to $4,496K. Public Safety's appropriations have increased to $1,057,090K as of June 30, 2017. The department did not have funding identified in SUPPS A in 2016-17.
2.1 Significant Changes to Authorities
For the period ending June 30, 2017, the authorities provided to the Department include Main Estimates and Supplementary Estimates (A). The 2016-17 authorities for the same period included Main Estimates only. The Statement of Authorities table presents a net decrease of $39.9 million (3.6 percent) compared to those of the same period of the previous year (from $1,097.0 million to $1,057.1 million).
Operating Expenditures authorities have decreased by $0.6 million (0.5 percent) (from $128.1 million to $127.5 million) mainly due to:
- A decrease of $2.1 million in funding level for the ongoing Phase II of Canada's Cyber Security Strategy, which will introduce actions to secure cyber systems outside of the Government of Canada;
- A decrease of $1.5 million in funding level for the National Disaster Mitigation Program, aimed at reducing the impacts of natural disasters on Canadians;
- A decrease of $1.1 million for the completion of a Beyond the Border time-limited program, which sought to strengthen the security of the Canada and the United States shared perimeter and facilitate secure trade and travel across borders;
- A decrease of $0.8 million for a permanent reduction to funding in operating expenditures authorities (Budget 2016 reduction); and
- A decrease of $0.4 million for a transfer to Shared Services Canada for costs associated with the transfer of employees, labs and local server rooms (data centre space) following the creation of Shared Services Canada;
These decreases are offset by the following increases:
- An increase of $2.4 million for new funding to explore options for the potential deployment of a public safety broadband network in Canada (Budget 2015);
- An increase of $2.2 million towards the creation of the Canada Centre for Community Engagement and Prevention of Violence (Budget 2016); and
- An increase of $0.7 million for a one year funding renewal for the national security review of foreign investments (Budget 2017).
Grants and Contributions (G&C) authorities have decreased by $38.3 million (4.0 percent) (from $952.9 million to $914.5 million) mainly due to:
- A decrease of $38.3 million associated with the completion of financial assistance to the Province of Quebec for decontamination costs following the train derailment and explosion in Lac-Mégantic, Quebec; and
- A decrease of $10.5 million in funding level for non-discretionary requirements to address existing and future obligations under the Disaster Financial Assistance Arrangements program;
These decreases are offset by the following increases:
- An increase of $4.2 million in funding level for the National Disaster Mitigation Program, which aims at reducing the impacts of natural disasters on Canadians;
- An increase of $3.1 million towards the creation of the Heavy Urban Search and Rescue Program announced in Budget 2016;
- An increase of $2.4 million towards the creation of the Canada Centre for Community Engagement and Prevention of Violence (Budget 2016); and
- An increase of $0.8 million in funding level for the National Search and Rescue Secretariat (NSS).
Budgetary Statutory authorities have decreased by $0.9 million (5.8 percent) in 2017-18 mostly as a result of the Employee Benefit Plan (EBP) costs associated with the department's budgetary requirements for salary, for which the real rate decreased from 17.2% to 15.7%.
2.2 Significant Variances from Previous Year Expenditures
First Quarter Expenditures
Compared to the previous year, expenditures used during the quarter ended June 30, 2017 have decreased by $272.7 million (74.0 percent) (from $368.7 million to $96.0 million) as reflected in the Departmental Budgetary Expenditures by Standard Object table.
- Personnel expenditures have increased by $0.3 million (1.2 percent) mainly due to:
- An increase of $0.6 million in expenditures in acting pay resulting from delays in the Public Service Pay Centre in processing past year acting transactions;
Offset by the following decrease:
- A net decrease of $0.3 million for other expenditure variances of lesser value.
- Other operating expenditures have decreased by $0.7 million (17.5 percent) mainly due to:
- A decrease of $1.6 million in Professional and special services due to the timing of payments for legal services from the Department of Justice Canada related to its new funding structure;
Offset by the following increases:
- An increase of $0.4 million in Other Subsidies and payments due to salary overpayments and salary advances recorded as non-personnel expenditures in 2017-18; and
- A net increase of $0.5 million for other expenditure variances of lesser value.
- Transfer payments expenditures have decreased by $272.3 million (80.7 percent) mainly due to:
- A decrease of $296.5 million in payments under the Disaster Financial Assistance Arrangements (DFAA) program, explained largely by a $307.0 million advance payment to the Province of Alberta to assist with the recovery efforts of the Fort McMurray wildfire made in the first quarter of 2016-17;
Offset by the following increases:
- An increase of $15.9 million in expenditures for the First Nations Policing Program;
- An increase of $5.5 million in expenditures for the National Crime Prevention Strategy Program;
- An increase of $1.4 million in expenditures for the Search and Rescue New Initiatives Fund (SARNIF);
- An increase of $1.1 million in expenditures for the Combat Child Sexual Exploitation and Human Trafficking (CSEHT) program; and
- A net increase of $0.3 million for other expenditure variances of lesser value.
3.0 Risks and Uncertainty
The Department's mandate spans from public safety and security, intelligence and national security functions, social interventions for youth-at-risk, to readiness for all manner of emergencies. Public Safety is called, on behalf of the Government of Canada, to rapidly respond to emerging threats and ensure the safety and security of Canadians. The Department's ability to deliver its programs and services is subject to several risk sources, such as the rapidly changing asymmetrical threat environment, its ability to respond to natural or man-made disasters, government priorities, and government-wide or central agency initiatives. To deliver this mandate effectively, the collaboration of many departments and agencies, provincial and territorial governments, international partners, private sector and first responders is required.
Disaster Financial Assistance Arrangements
The Disaster Financial Assistance Arrangements (DFAA) contribution program presents a greater level of risk and uncertainty than other PS grants and contributions programs given that it represents a significant portion of the PS budget and that it is subject to unforeseen events. The DFAA was established in 1970 to provide a consistent and equitable mechanism for federal sharing of provincial and territorial costs for natural disaster response and recovery where such costs would place an undue burden on a provincial or territorial economy.
- There are currently 75 natural disasters for which Orders-in-Council (OiCs) have been approved, authorizing the provision of federal financial assistance under the DFAA, and for which final payments have not yet been made.
- Public Safety's total outstanding share of liability under the DFAA in regards to these 75 events is $1.8 billion as of June 30, 2017, the majority of which is expected to be paid out over the next five years. This does not include recent 2017 events.
- The following are the most significant events within Public Safety's DFAA liability:
- Alberta 2013 June Flood ($415.7 million);
- Manitoba 2011 Spring Flood ($350 million);
- Alberta 2016 Wildfires ($161.6 million);
- Saskatchewan 2011 Spring Flood ($140.9 million); and
- Manitoba 2014 June Rainstorm ($122 million).
Compensation Adjustments (Collective Agreements)
The Government of Canada announced in 2013 a freeze in the overall federal operating budget, generating government-wide savings of roughly $550 million in 2014-15 and $1.1 billion in 2015-16. Consequently, Public Safety will have to absorb the increases in salaries resulting from collective agreements that take effect during the freeze period (2014-2015 and 2015-2016), and for the ongoing impact of those adjustments. Salary increase impact for 2016-17 and beyond will be funded through adjustments to authorities.
Many collective bargaining agreements will take effect in 2017-18. The retroactive salary payments to be absorbed by the department in 2017-18 are estimated at $4.1 million. As a mitigation strategy, surplus funds from previous years totaling $3.1 million have been set aside, resulting in a $1.0 million pressure in 2017-18.
In 2017-18, the ongoing salary increases related to 2014-15 and 2015-16 to be absorbed by the department are estimated at $1.9 million.
Phoenix Pay Modernization Project
In April 2016, Public Safety moved to the new Phoenix federal public service pay system. In transitioning to the new pay system, large backlogs and delays at the centralized Pay Centre have led to a significant increase in pay-related issues reported by employees.
To support employees at highest risk, Public Safety continues to work on a range of issues that fall within the department's scope of control to support employees who are experiencing difficulties with their pay, including: providing emergency salary advances, analyzing and resolving integration issues between the department's Human Resource Management System and the Phoenix pay system, and working with partners to ensure readiness for collective agreement updates. Issues affecting Public Safety employees and the measures the Department is able to take to help mitigate them have been discussed with the unions at local and national level management consultation committees. At these meetings, union representatives have been engaged to ensure that employees' perspectives are shared with Management.
The Department is closely monitoring pay transactions to identify and address over and under payments in a timely manner and continues to apply ongoing mitigating controls which were implemented in 2016.
4.0 Significant Changes in Relation to Operations, Programs and Personnel
- On April 28, 2017, the Prime Minister appointed Gina Wilson, Public Safety's Associate Deputy Minister, as Deputy Minister of Status of Women Canada. Her last day with Public Safety was May 19, 2017.
- On June 23, 2017, the Prime Minister announced that Vincent Rigby, Assistant Deputy Minister of Strategic Policy, Global Affairs Canada, will become the Associate Deputy Minister of Public Safety effective July 17, 2017.
- Lori MacDonald, Assistant Deputy Minister (ADM), Emergency Management and Programs Branch (EMPB), has left Public Safety to assume a new role at Transport Canada as Senior Advisor, Safety and Security Renewal. Lori's last day at Public Safety was June 23, 2017.
- On June 16, 2017, the Deputy Minister announced that Patrick Tanguy, former Assistant Secretary to the Cabinet, Intergovernmental Relations from the Privy Council Office, will become ADM, EMPB effective July 4, 2017.
5.0 Approval by Senior Officials
Approved as required by the Policy on Financial Resource Management, Information and Reporting:
Malcolm Brown
Deputy Minister
Public Safety Canada
Ottawa (Canada)
Date: August 16, 2017
Caroline Weber
Chief Financial Officer and Assistant Deputy Minister
Corporate Management Branch
Public Safety Canada
Ottawa (Canada)
Date: August 15, 2017
6.0 Statement of Authorities (unaudited)
| Total available for use for the year ending March 31, 2018 (1) | Used during the quarter ended June 30, 2017 | Year to date used at quarter-end | |
|---|---|---|---|
| Vote 1 - Net Operating Expenditures | 127,465,602 | 27,041,546 | 27,041,546 |
| Vote 5 - Grants and Contributions | 914,540,358 | 65,243,829 | 65,243,829 |
| Employee Benefit Plans (EBP) | 14,999,364 | 3,684,485 | 3,684,485 |
| Minister's Salary and Motor Car Allowance | 84,400 | 21,150 | 21,150 |
| TOTAL AUTHORITIES | 1,057,089,724 | 95,991,010 | 95,991,010 |
| (1) Includes only authorities available for use and granted by Parliament at quarter end. | |||
| Total available for use for the year ended March 31, 2017 (1) | Used during the quarter ended June 30, 2016 | Year to date used at quarter-end | |
|---|---|---|---|
| Vote 1 - Net Operating Expenditures | 128,080,019 | 27,195,867 | 27,195,867 |
| Vote 5 - Grants and Contributions | 952,867,801 | 337,507,534 | 337,507,534 |
| Employee Benefit Plans (EBP) | 15,927,088 | 3,981,772 | 3,981,772 |
| Minister's Salary and Motor Car Allowance | 83,500 | 6,958 | 6,958 |
| TOTAL AUTHORITIES | 1,096,958,408 | 368,692,132 | 368,692,132 |
| (1) Includes only authorities available for use and granted by Parliament at quarter end. | |||
7.0 Departmental budgetary expenditures by Standard Object (unaudited)
| Planned expenditures for the year ending March 31, 2018 (1) | Expended during the quarter ended June 30, 2017 | Year to date used at quarter-end | |
|---|---|---|---|
| Expenditures: | |||
| Personnel | 110,263,117 | 27,627,242 | 27,627,242 |
| Transportation and communications | 3,625,205 | 481,736 | 481,736 |
| Information | 1,834,867 | 226,218 | 226,218 |
| Professional and special services | 19,441,215 | 1,846,099 | 1,846,099 |
| Rentals | 4,344,385 | 521,680 | 521,680 |
| Repair and maintenance | 692,756 | 32,251 | 32,251 |
| Utilities, material and supplies | 1,292,354 | 75,861 | 75,861 |
| Acquisition of land, buildings and works | - | - | - |
| Acquisition of machinery and equipment | 3,654,953 | 517,260 | 517,260 |
| Transfer payments | 914,540,358 | 65,243,829 | 65,243,829 |
| Public debt charges | - | - | - |
| Other subsidies and payments | 100,514 | 440,085 | 440,085 |
| Total gross budgetary expenditures | 1,059,789,724 | 97,012,260 | 97,012,260 |
| Less Revenues netted against expenditures: | |||
| Interdepartmental Provision of Internal Support Services | 2,700,000 | 1,021,250 | 1,021,250 |
| Total net budgetary expenditures | 1,057,089,724 | 95,991,010 | 95,991,010 |
| (1) Includes only planned expenditures against authorities for use and granted by Parliament at quarter end. | |||
| Planned expenditures for the year ended March 31, 2017 (1) | Expended during the quarter ended June 30, 2016 | Year to date used at quarter-end | |
|---|---|---|---|
| Expenditures: | |||
| Personnel | 108,609,936 | 27,289,444 | 27,289,444 |
| Transportation and communications | 3,539,090 | 478,794 | 478,794 |
| Information | 6,288,012 | 293,271 | 293,271 |
| Professional and special services | 19,024,219 | 3,310,175 | 3,310,175 |
| Rentals | 3,806,779 | 677,681 | 677,681 |
| Repair and maintenance | 412,822 | 37,179 | 37,179 |
| Utilities, material and supplies | 934,225 | 77,903 | 77,903 |
| Acquisition of land, buildings and works | 1,959,830 | - | - |
| Acquisition of machinery and equipment | 2,215,694 | 142,650 | 142,650 |
| Transfer payments | 952,867,801 | 337,507,534 | 337,507,534 |
| Public debt charges | - | - | - |
| Other subsidies and payments | - | (597) | (597) |
| Total gross budgetary expenditures | 1,099,658,408 | 369,814,034 | 369,814,034 |
| Less Revenues netted against expenditures: | |||
| Interdepartmental Provision of Internal Support Services | 2,700,000 | 1,121,902 | 1,121,902 |
| Total net budgetary expenditures | 1,096,958,408 | 368,692,132 | 368,692,132 |
| (1) Includes only planned expenditures against authorities for use and granted by Parliament at quarter end. | |||
- Date modified: