Public Safety HR Dashboard
Organizational Health Dashboard: Demographics
Employee Count, Age, Language and Location
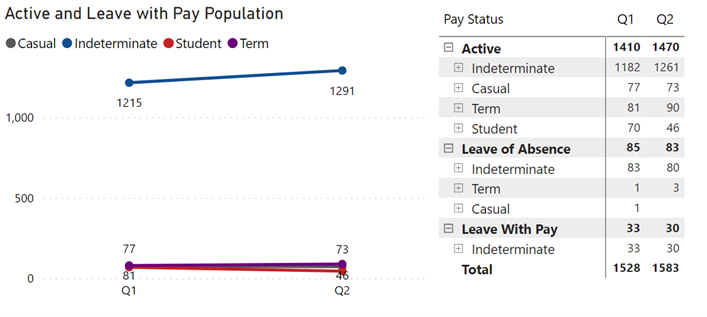
Image description
The Active and Leave with Pay Population line graph and table shows the total number of Casual, Indeterminate, Student and Term employees in Public Safety for FY 2022-23 April 1 to June 30, 2022 (Q1) and July 1 to September 30, 2022 (Q2). The total number of employees for Q1 is: Active Indeterminate: 1182, Active Casual: 77, Active Term: 81, Active Student: 70 for a total of 1410. Leave of Absence Indeterminate: 83, Leave of Absence Term: 1, Leave of Absence Casual: 1 for a total of 85. Leave with Pay Indeterminate: 33.
The total number of employees for Q2 is: Active Indeterminate: 1261, Active Casual: 73, Active Term: 90, Active Student: 46 for a total of 1470. Leave of Absence Indeterminate: 80, Leave of Absence Term: 3 for a total of 83. Leave with Pay Indeterminate: 30.
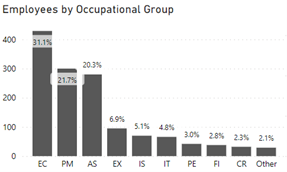
Image description
Employees by Occupational Group is a bar graph which shows employees by Occupational Group in Public Safety for FY 2022-2023 (April 1 to September 30, 2022). The percentages as well as the number of employees are as follows: EC is 31.1% or 429 employees, PM is 21.7% or 300 employees, AS is 20.3% or 280 employees, EX is 6.9% or 95 employees, IS is 5.1% or 70 employees, IT is 4.8% or 66 employees, PE is 3.0% or 42 employees, FI is 2.8% or 38 employees, CR is 2.3% or 32 employees and Other is 2.1% or 29 employees.
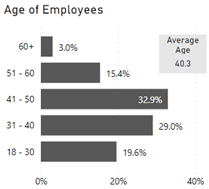
Image description
The Age of Employees bar graph shows the percentage age of employees in age range groups as well as the average age being 40.3. The percentage is as follows: Age 60+ 3.0%, 51-60 15.4%, 41-50 32.9%, 31-40 29.0% and 18-30 19.6%.
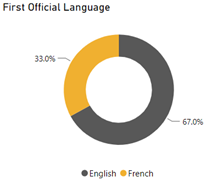
Image description
The First Official Language donut diagram shows the first official language of employees at Public Safety. The percentages are as follows: 33.0% of employees have French as their first official language, 67.0% of employees have English as their first official language.
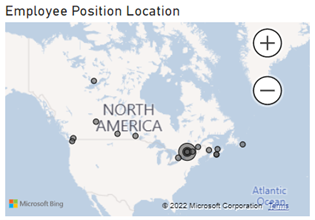
Image description
The Employee Position Location map identifies where Public Safety's offices are located and number of employees in that location. Location with count of employees are as follows: NWT 1, Victoria 1, Burnaby 23, Edmonton 18, Regina 7, Winnipeg 13, Toronto 40, 269 Laurier 898, 340 Laurier 280, 257 Slater 103, 284 Wellington 4, Montréal 26, Québec 1, Fredericton 10, Charlottetown 1, Dartmouth 4 and St John's 4.
Organizational Health Dashboard: Retention
Turnover, Departures and Eligibility to Retire
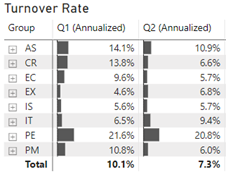
Image description
The Turnover Rate table shows the annualized Public Safety turnover by group for FY 2022-23 April 1 to June 30, 2022 (Q1) and July 1 to September 30, 2022 (Q2). The percentage rate by group is as follows: AS is 14.1% for Q1 and 10.9% for Q2, CR is 13.8% for Q1 and 6.6% for Q2, EC is 9.6% for Q1 and 5.7% for Q2, EX is 4.6% for Q1 and 6.8% for Q2, IS is 5.6% for Q1 and 5.7% for Q2, IT is 6.5% for Q1 and 9.4% for Q2, PE is 21.6% for Q1 and 20.8% for Q2, PM is 10.8% for Q1 and 6.0% for Q2, with the total annualization for Q1 is 10.1% and 7.3% for Q2.
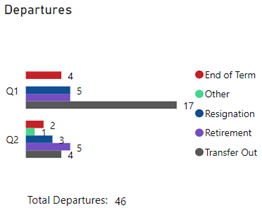
Image description
The Departures bar graph shows the number of departures and the reason for the departure for Q1 and Q2 for FY 2022-23. The following is the number of departures: Q1 - 4 End of Term, 5 Resignation, 5 Retirement and 17 Transfer Outs. Q2 - 2 End of Term, 1 Other, 3 Resignation, 5 Retirement and 4 Transfer Out for a total of 46 departures for Q1 and Q2.
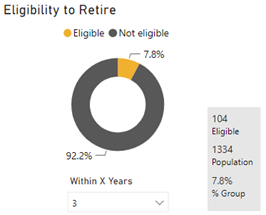
Image description
The Eligibility to Retire donut shows who is eligible and not eligible to retire within 3 years. The percentage who are eligible to retire is 7.8% and 92.2 not eligible. This indicates there is 104 eligible from a population of 1334 which is 7.8% of the group.
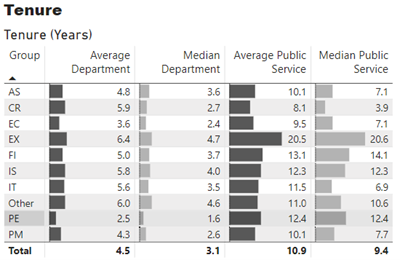
Image description
The Tenure chart represents the tenure in years by group based on Average in Department, Median in Department, Average in the Public Service and Median in the Public Service. The following is the average years in each group for department and public service: AS – average department 4.8, median department 3.6, average public service 10.1, median public service 7.1 years; CR – average department 5.9, median department 2.7, average public service 8.1, median public service 3.9 years; EC – average department 3.6, median department 2.4, average public service 9.5, median public service 7.1 years; EX – average department 6.4, median department 4.7, average public service 20.5, median public service 20.6 years; FI – average department 5.0, median department 3.7, average public service 13.1, median public service 14.1 years; IS – average department 5.8, median department 4.0, average public service 12.3, median public service 12.3 years; IT – average department 5.6, median department 3.5, average public service 11.5, median public service 6.9 years; Other – average department 6.0, median department 4.6, average public service 11.0, median public service 10.6 years; PE – average department 2.5, median department 1.6, average public service 12.4, median public service 12.4 years; PM – average department 4.3, median department 2.6, average public service 10.1, median public service 7.7 years. Overall total average department 4.5, median department 3.1, average public service 10.9, median public service 9.4 years.
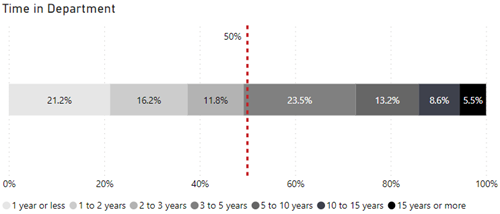
Image description
The Time in Department bar chart represents the percentage of how long an employee is staying at Public Safety. The percentages are as follows: 21.2% 1 year or less, 16.2% between 1-2 years, 11.8% between 2-3 years, 23.5% between 3-5 years, 13.2% between 5-10 years, 8.6% between 10-15 years and 5.5% 15 years or more.
Organizational Health Dashboard: Workload
Compensatory Time, Paid Overtime, Sick and Vacation Leave
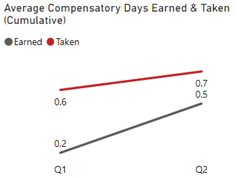
Image description
The Average Compensatory Days Earned and Taken (Cumulative) line graph shows how many days were earned and taken cumulatively for Q1 and Q2 of FY 2022-23. The following is the number of days earned and taken: Q1 earned 0.2 days and 0.6 days taken. Q2 earned 0.5 days and 0.7 days taken (the total for Q2 is cumulative with Q1).
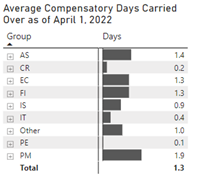
Image description
The Average Compensatory Days Carried Over as of April 1, 2022 table shows the average total of compensatory time in days that employees have carried over by group. The following is the number of days carried over by group: AS: 1.4, CR: 0.2, EC: 1.3, FI: 1.3, IS: 0.9, IT: 0.4, Other: 1.0, PE: 0.1, PM: 1.9, with the total for all groups being 1.3 days.
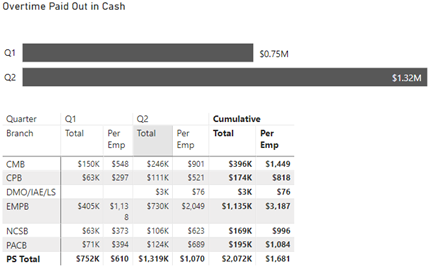
Image description
The Overtime Paid Out in Cash bar graph shows the amount paid out in cash for overtime for Q1 being $0.75M and Q2 being $1.32M.
The overtime paid out in cash table shows a breakdown for the amount paid out by quarter, branch, and per employee with a cumulative amount. The dollar amounts per branch for Q1 and Q2 as follows: Q1 CMB total $150K and per employee $548, CPB total $63K and per employee $297, DMO/IAE/LS total $0 and per employee 0, EMPB total $450 and per employee $1,138, NCSB total $63K and per employee $373, PACB total $71K and per employee $394, PS total $752K and per employee $610; Q2 CMB total $246K and per employee $901, CPB total $111K and per employee $521, DMO/IAE/LS total $3K and per employee $76, EMPB total $730 and per employee $2,049, NCSB total $106K and per employee $623, PACB total $124K and per employee $689, PS total $1,319K and per employee $1,070.
The cumulative total by branch is as follows: CMB total $396K and per employee $1,149, CPB total $174K and per employee $818, DMO/IAE/LS total $3K and per employee $76, EMPB total $1,135 and per employee $3,187, NCSB total $169K and per employee $996, PACB total $195K and per employee $1,084, PS total $2,072K and per employee $1,161.
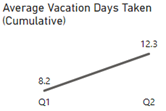
Image description
The Average Vacation Days Taken (Cumulative) line graph shows how many vacation days on average were taken cumulatively for Q1 and Q2 of FY 2022-23. The following is the number of days taken: Q1 8.2 days and for Q2 12.3 days (the total for Q2 is cumulative with Q1).
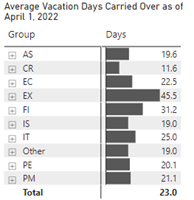
Image description
The Average Vacation Days Carried Over as of April 1, 2022 table shows the average number of vacation days carried over from the previous fiscal by group with a total. The following is the average vacation days by group: AS is 19.6, CR is 11.6, EC is 22.5, EX is 45.5, FI is 31.2, IS is 19.0, IT is 25.0, Other is 19.0, PE is 20.1 and PM is 21.1, with a total average vacation days carried over of 23.0.
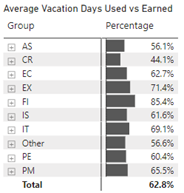
Image description
The Average Vacation Days Used versus Earned table shows the percentage of vacation used compared to earned by group. The percentages are as follows: AS is 56.1%, CR is 44.1%, EC is 62.7%, EX is 71.4%, FI is 85.4%, IS is 61.6%, IT is 69.1%, Other is 56.6%, PE is 60.4% and PM is 65.5%, with a total average vacation days used versus earned of 62.8%.
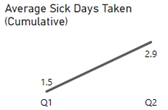
Image description
The Average Sick Days Taken (Cumulative) line graph shows how many sick days were taken cumulatively for Q1 and Q2 of FY 2022-23. The following is the average number of days taken: Q1 1.5 days and for Q2 2.9 days (the total for Q2 is cumulative with Q1).
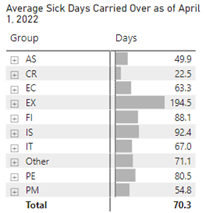
Image description
The Average Sick Days Carried Over as of April 1, 2022 table shows the number of sick days taken by group with a total. The following is the average sick days by group: AS is 49.9, CR is 22.5, EC is 63.3, EX is 194.5, FI is 88.1, IS is 92.4, IT is 67.0, Other is 71.1, PE is 80.5 and PM is 54.8, with a total average sick days carried over of 70.3.
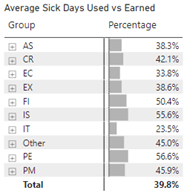
Image description
The Average Sick Days Used versus Earned table shows the percentage of sick used versus earned by group. The percentages are as follows: AS- is 38.3%, CR is 42.1%, EC is 33.8%, EX is 38.6%, FI is 50.4%, IS is 55.6%, IT is 23.5%, Other is 45.0%, PE is 56.6% and PM is 45.9%, with a total average sick days used vs earned of 39.8%.
Organizational Health Dashboard: Staffing
Staffing Actions, Temporary Staffing Actions and Job Advertisements
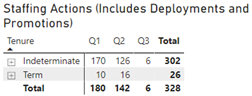
Image description
The Staffing Actions which includes deployments and promotions table shows the total number of long term (indeterminate and term) staffing actions for Q1, Q2 and Q3 (April 1, 2022 to October 4, 2022). The table shows the following: 170 indeterminate and 10 term actions for Q1 with a total of 180 actions; 126 indeterminate and 16 term actions for Q2 for a total of 142 actions; 6 indeterminate actions for Q3 with a total of 6 actions. The total indeterminate actions for all quarters is 302, and the total term actions for all quarters 26 for a grand total of 328 actions.
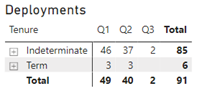
Image description
The Deployments table shows indeterminate and term deployments staffing actions for Q1, Q2 and Q3 (April 1, 2022 to October 4, 2022). The table shows the following: 46 indeterminate and 3 term deployments for Q1 with a total of 49; 37 indeterminate and 3 term deployments for Q2 for a total of 40; 2 indeterminate deployments for Q3 with a total of 2. The total indeterminate deployments for all quarters is 85, and the total term deployments for all quarters is 6 for a total of 91 deployments.
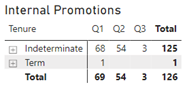
Image description
The Internal Promotions table shows promotions for Q1, Q2 and Q3 (April 1, 2022 to October 4, 2022). The table shows the following: 68 indeterminate and 1 term internal promotion for Q1 with a total of 69; 54 indeterminate internal promotions for Q2 for a total of 54; 3 indeterminate internal promotions for Q3 with a total of 3. The total indeterminate internal promotions for all quarters is 125, and the total term internal promotions for all quarters is 1 for a total of 126 internal promotions.
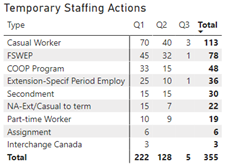
Image description
The Temporary Staffing Actions table shows the type and number of temporary staffing actions for Q1, Q2 and Q3 (April 1, 2022 to October 4, 2022). The table shows the following breakdown by type of action: Casual worker Q1-70 actions, Q2-40 actions, Q3-3 actions for a total of 113. FSWEP Q1-45 actions, Q2-32 actions, Q3-1 action for a total of 78. COOP Program Q1-33 actions, Q2-15 actions for a total of 48. Extension-specif Period Employ Q1-25 actions, Q2-10 actions, Q3-1 action for a total of 36. Secondment Q1-15 actions, Q2-15 actions for a total of 30. NA-Ext/Casual to term Q1-15 actions, Q2-7 actions, for a total of 22. Part-time worker Q1-10 actions, Q2-9 actions for a total of 19. Assignment Q1-6 actions for a total of 6. Interchange Canada Q1-3 actions for a total of 3. Total actions for Q1-222, Q2-128, Q3-5 for a total of 355 temporary staffing actions.
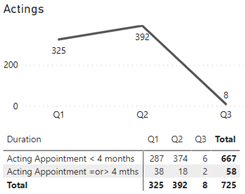
Image description
The Actings line graph shows the total number of acting appointments by duration – less than 4 months as well as acting appointments equal to or more than 4 months. The numbers are as follows: Q1 had a total of 325 actings, Q2 392 and Q3 8. The table shows the following detailed breakdown: Q1 had 287 acting appointments of less than 4 months, 374 for Q2 and 6 for Q3 with a total for all quarters of 667 actings. Q1 had 38 acting appointments equals to or more than 4 months, 18 for Q2 and 2 for Q3 with a total for all quarters of 58.
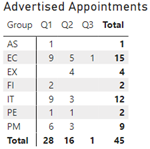
Image description
The Advertised Appointments table by group for Q1, Q2 and Q3 includes the total number of appointments as follows: advertised appointments by quarter and group Q1 – AS 1, EC 15, EX 4, FI 2, IT 12, PE 2, PM 9 for a total of 28; Q2 - AS 0, EC 5, EX 4, FI 0, IT 3, PE 1, PM 3 for a total of 16; Q3 - AS 0, EC 1, EX 0, FI 0, IT 0, PE 0, PM 0 for a total of 1. The total advertised appointments by group – AS 1, EC 15, EX 4, FI 2, IT 12, PE 2, PM 9 for a total of 45 advertised appointments.
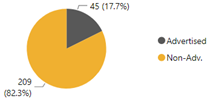
Image description
The advertised and non-advertised pie chart shows the number and percentages of appointments. There is a total of 45 advertised appointments (17.7%) and a total of 209 non-advertised appointments (82.3%).
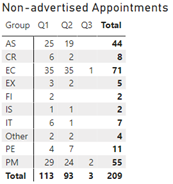
Image description
The Non-advertised Appointments by group for Q1, Q2 and Q3 table includes the total number of appointments as follows: non-advertised appointments by quarter and group Q1 – AS 25, CR 6, EC 35, EX 3, FI 2, IS 1 IT 6, Other 2, PE 4, PM 29 for a total of 113; Q2 - AS 19, CR 2, EC 35, EX 2, FI 0, IS 1 IT 1, Other 2, PE 7, PM 24 for a total of 93; Q3 - AS 0, CR 0, EC 1, EX 0, FI 0, IS 0 IT 0, Other 0, PE 0, PM 0 for a total of 2. The total non-advertised appointments by group – AS 44, CR 8, EC 71, EX 5, FI 2, IT 7, Other 4, PE 11, PM 55 for a total of 209 non-advertised appointments.
Organizational Health Dashboard: Timeliness of HR Transactions
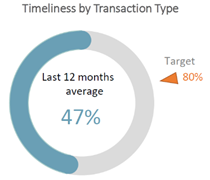
Image description
The Timeliness by Transaction Type donut shows the average percentage of timely transactions being 47% within the last 12 months with a target of 80%.
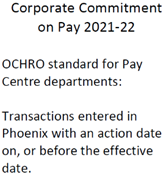
Image description
The Corporate Commitment image on pay 2021-22 explains the standard for OCHRO standards for Pay Centre departments which is transactions entered in Phoenix with an action date on, or before the effective date.
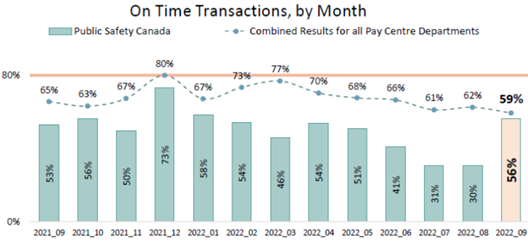
Image description
The On Time Transactions by Month bar graph shows the percentage results of on time transactions for Public Safety Canada as well as combined results for all Pay Centre departments starting from September 2021 to September 2022. The percentage is as follows: Public Safety 2021-09 53%, 2021-10 56%, 2021-11 50%, 2021-12 73%, 2022-01 58%, 2022-02 54%, 2022-03 46%, 2022-04 54%, 2022-05 51%, 2022-06 41%, 2022-07 31%, 2022-08 30% and 2022-09 56%. The percentage combined for all Pay Centre departments is as follows: 2021-09 65%, 2021-10 63%, 2021-11 67%, 2021-12 80%, 2022-01 67%, 2022-02 73%, 2022-03 77%, 2022-04 70%, 2022-05 68%, 2022-06 66%, 2022-07 61%, 2022-08 62% and 2022-09 59%.
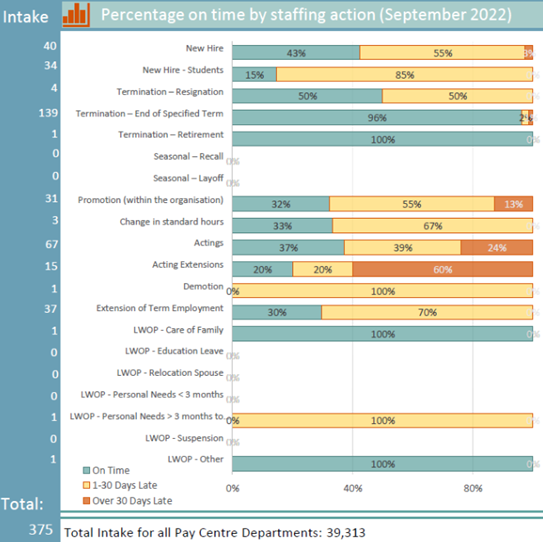
Image description
The Percentage on Time Transactions by Type bar graph for September 2022 shows the percentage of actions which are On Time, 1-30 Days Late and Over 30 Days Late. Public Safety had an intake of 375 where the intake for all Pay Centre departments was 39,313.
The percentages by action type are as follows: New Hire 43% on time, 55% 1-30 days late, 3% over 30 days late; New Hire – Students 15% on time, 85% 1-30 days late; Termination – Resignation 50% on time, 50% 1-30 days late; Termination – End of specified term 90% on time, 2% 1-30 days late, 2% over 30 days late; Termination Retirement 100% on time; Promotion (within the organization) 32% on time, 55% 1-30 days late, 13% over 30 days late; Change in standard hours 33% on time, 67% 1-30 days late; Actings 37% on time, 39% 1-30 days late, 24% over 30 days late; Acting extensions 20% on time, 20% 1-30 days late, 60% over 30 days late; Demotion 100% on time; Extension of term employment 30% on time, 70% 1-30 days late; LWOP – Care of Family 100% on time; LWOP – personal needs > 3 months 100% 1-30 days late; LWOP - Other 100% on time.
A transaction is considered on time if the action date (entered in Phoenix) is on or before the effective date of the HR action (e.g., the start date of an employee). Timeliness is a shared responsibility with hiring managers needing to submitting actions sufficiently in advance, and HR processing them on time. Source: Public Services and Procurement Canada – Pay Administration Branch (Phoenix)
Organizational Health Dashboard: Diversity
Employment Equity Representation vs. Workforce Availability (WFA)
Women
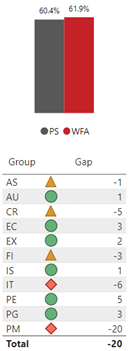
Image description
The employment and equity representation vs workforce availability (WFA) for women shows the percentage as well as the gap within the specific group. The percentages for women are as follows: 60.4% Public Safety and 61.9% WFA.
The following is the gap by group: AS -1, AU 1, CR -5, EC 3, EX 2, FI -3, IS 1, IT -6, PE 5, PG 3, PM -20 for a total gap of -20.
Indigenous Peoples
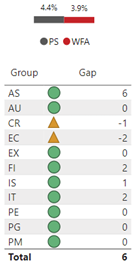
Image description
The employment and equity representation vs workforce availability (WFA) for indigenous peoples shows the percentage as well as the gap within the specific group. The percentages for indigenous peoples are as follows: 4.4% Public Safety and 3.9% WFA.
The following is the gap by group: AS 6, AU 0, CR -1, EC -2, EX 0, FI -2, IS 1, IT 2, PE 0, PG 0, PM 0 for a total gap of 6.
Visible Minorities
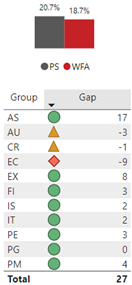
Image description
The employment and equity representation vs workforce availability (WFA) for visible minorities shows the percentage as well as the gaps within the specific group. The percentages for visible minorities are as follows: 20.7% Public Safety and 18.7% WFA.
The following is the gap by group: AS 17, AU -3, CR -1, EC -9, EX 8, FI 3, IS 2, IT 2, PE 3, PG 0, PM 4 for a total gap of 27.
Persons with Disabilities
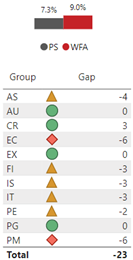
Image description
The employment and equity representation vs workforce availability (WFA) for persons with disabilities shows the percentage as well as the gaps within the specific group. The percentages for persons with disabilities are as follows: 7.3% Public Safety and 9.0% WFA.
The following is the gap by group: AS -4, AU 0, CR 3, EC -6, EX 0, FI -3, IS -3, IT -3, PE -2, PG 0, PM -6 for a total gap of -23.
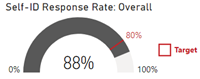
Image description
The Self-ID Response Rate dial shows the overall percentage of employees who self-id. The percentage is as follows: 88% self-id overall with 80% being the target response rate.
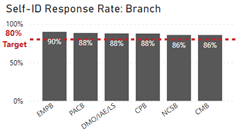
Image description
The Self-ID Response Rate bar graph shows the percentage of employees who self-id by branch. The percentage is as follows: PACB 88%, EMPB 90%, CPB 88%, NCSB 86%, CMB 86% and DMO/IAE/LS 88% with 80% being the target response rate.
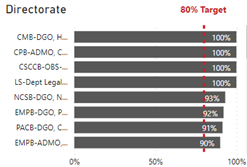
Image description
The Self-ID Response Rate bar graph shows the percentage of employees who self-id by directorate. The percentage is as follows: CMB-DGO-Human Resources 100%, CPB-ADMO 100%, CPB-OBS-NCPC Exec Dir Office 100%, LS-Dept Legal Services Unit 100%, NCSB-DGO, Natl Security Ops 93%, EMPB-DGO, Programs 92%, PACB-DGO, Cab Parl Aff EX Svcs 91% and EMPB-ADMO, Emerg Mgmt & Prog 90% with 80% being the target response rate.
Organizational Health Dashboard: Well-Being
Federal Public Service Workplace Mental Health Dashboard, Pulse Survey: Well-being and Employee Assistance Program (EAP) at Public Safety
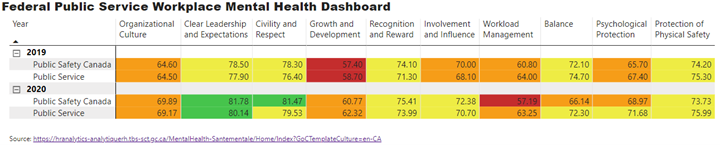
Image description
The Federal Public Service Workplace Mental Health Dashboard graph bars and table cells are coloured according to the score presented as follows. The purpose of this feature is to make it easier for users to both analyze and present the data. The comparison is FY 2019 and FY 2020 for Public Safety Canada and the Public Service with risk factor. The colour coding of scores is as follows: red score 59.99 or less, Orange score from 60-69.99, Yellow score from 70-79.99 and Green score from 80 to 89.99. Scores for FY 2019 are as follows by risk factor: Organizational Culture – Public Safety 64.60, Public Service 64.50 both orange, Clear Leadership and Expectations - Public Safety 78.50, Public Service 77.90 both yellow, Civility and Respect - Public Safety 78.30, Public Service 76.40 both yellow, Growth and Development - Public Safety 57.40, Public Service 58.70 both red, Recognition and Reward - Public Safety 74.10, Public Service 71.30 both yellow, Involvement and Influence - Public Safety 70.00, Public Service 68.10 both orange, Workload Management - Public Safety 60.80, Public Service 64.00 both orange, Balance - Public Safety 72.10, Public Service 74.70 both yellow, Psychological Protection - Public Safety 65.70, Public Service 67.40 both orange, Protection of Physical Safety - Public Safety 74.20, Public Service 75.30 both yellow.
The scores for FY 2020 are as follows by risk factor: Organizational Culture – Public Safety 69.89, Public Service 69.17 both orange, Clear Leadership and Expectations - Public Safety 81.78, Public Service 80.14 both green, Civility and Respect - Public Safety 81.47 green, Public Service 79.53 yellow, Growth and Development - Public Safety 60.77, Public Service 62.32 both orange, Recognition and Reward - Public Safety 75.41, Public Service 73.99 both yellow, Involvement and Influence - Public Safety 72.83, Public Service 70.70 both yellow, Workload Management - Public Safety 57.19 red, Public Service 63.25 orange, Balance - Public Safety 66.14 orange, Public Service 72.30 yellow, Psychological Protection - Public Safety 68.97 orange, Public Service 71.68 yellow, Protection of Physical Safety - Public Safety 73.73, Public Service 75.99 both yellow.
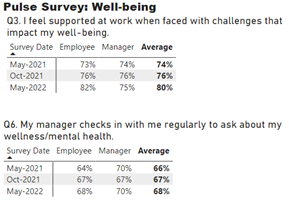
Image description
The Pulse Survey table compares the percentage of employees, manager's as well as the average number of employees who answered 2 of the questions within the survey over 3 years – May 2021, October 2021 and May 2022. The percentage results are as follows: Question 3. I feel supported at work when faced with challenges that impact my well-being – May 2021 73% employee, 74% manager with an average of 74%; October 2021 76% employee, 76% manager with an average of 76%; May 2022 82% employee, 75% manager with an average of 80%.
Question 6. My manager checks in with me regularly to ask about my wellness/mental health - May 2021 64% employee, 70% manager with an average of 66%; October 2021 67% employee, 67% manager with an average of 67%; May 2022 68% employee, 70% manager with an average of 68%.
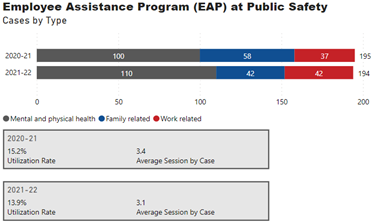
Image description
The Employee Assistance Program (EAP) at Public Safety bar graph shows the number of EAP cases for FY 2020-21 and 2021-22 by Mental and physical health, Family related and Work related. The number of cases is as follows: 100 Mental and physical health, 58 Family related and 37 Work related for a total of 195 cases for FY 2020-21. There was 110 Mental and physical health, 42 Family related and 42 Work related cases for a total of 194 cases for FY 2021-22.
The two charts show the utilization rate percentage as well as the average session by case. The utilization rate for FY 2020-21 was 15.2% with the average session by case being 3.4. The utilization rate for FY 2021-22 was 13.9% with the average session by case being 3.1.
- Date modified: